Implied volatility indicator - Bouhmidi-Bands Volatility trading with the Bouhmidi-Bands
Most known indicators such as Bollinger Bands or Keltner Channel focus only on historical volatility. Bouhmidi bands follow a different approach, namely an indicator based on implied volatility.
Style tags: Implied Volatility, Volatility Trading, Trend Analysis
Asset class: Equities, Futures, Commodities
Dataset: Minutes / Hours
Description
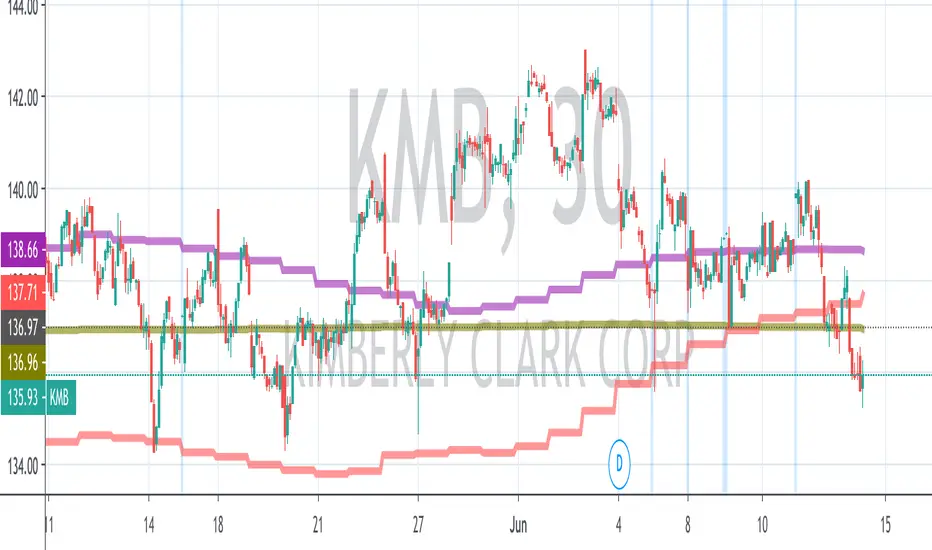
The most famous volatility indicators such as Bollinger Bands , Keltner Channel , Donchian Channels , etc. all use the historical volatility of the underlying asset. However, volatility is determined not only by historical volatility but also by implied volatility. The additional analysis of implied volatility sharpens the view and improves trading.
The Bouhmidi Bands ® were developed by myself and are based on implied volatility. They calculate an expected daily bandwidth under the assumption of normally distributed returns. The bandwidth is based on 1σ or 2σ. This means that an underlying closes with a probability of 68% or 95% within the expected Bouhmidi bandwidth at the end of the day. Check the historical development. The track record over the past 20 years shows a strong robustness of the indicator.
Benefits using Bouhmidi bands
- The Bouhmidi bands can be used to identify and filter "invisible" resistance and support that cannot be detected with simple chart analysis.
- The Bouhmidi bands can be used for different trading approaches. For example, they are suitable for mean reversion and volatility breakouts.
- If you combine the Bouhmidi bands with e.g. Keltner channel or Bollinger bands, you have the historical and implied volatility in one view in your tradingview chart.
Which underlyings can I trade with the Bouhmidi bands?
To determine the Bouhmidi bands, we need the underlying and the corresponding implied volatility index:
- S&P 500 - VIX
- DAX - VDAX-NEW
- Dow Jones - VXD
- Nasdaq 100 - VXN
- Gold - GVZ
- WTI - OVX
- Apple - VXAPL
- Amazon - VXAZN
- Google - VXGOG
- IBM - VXIBM
Intradaytrading

Zeta ScalperWhat is Scalping?
Scalping is a trading strategy aimed at profiting from quick momentum in a volatile index or stock.
Traders who use such strategies place anywhere from 10 to a few hundred trades in a single day.
The idea behind such type of trading is that small moves in an index or stock price are much easier to capture than the larger moves.
Traders who use such strategies are known as scalpers. When you take many small profits a number of times, say 10 points scalped 20 times per day, they can easily add up to large gains.
An Option Buyer's Biggest Enemy is Time Decay and when you scalp, you do not allow the time decay to eat your Option Premium as your Entry and Exit is often quick enough.
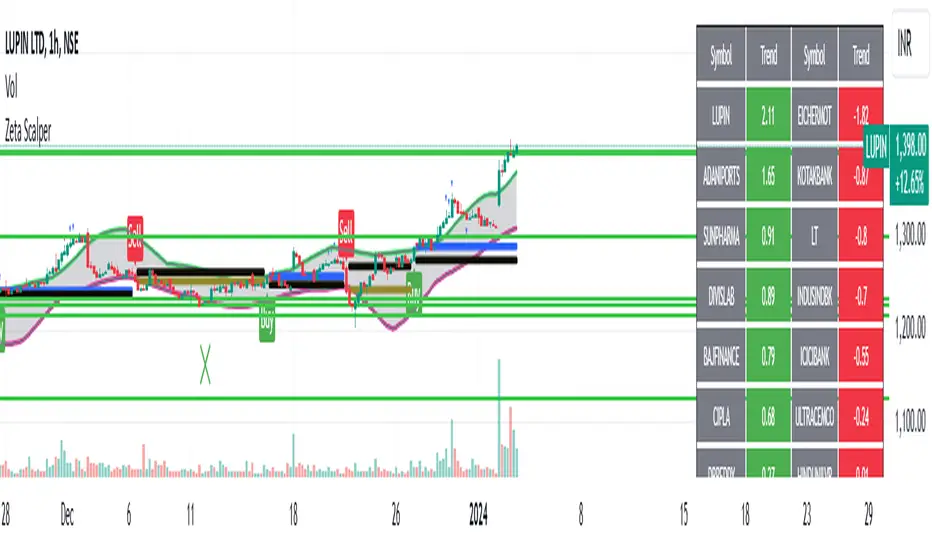
What is Zeta Scalper?
Zeta Scalper indicator is a momentum based indicator which tries to detect momentum based upon a number of Candle Stick Patterns.
When it thinks a move has the potential to turn into a big move, it generated its Buy/Sell Signals.
It is a well known fact that actual drivers of the market are Big Institutions, Mutual Funds & Big Guys with deep pockets.
They have large amounts of money to invest and they buy & sell in bulk.
When they buy, often their objective is to buy at lower levels (below average price of the day) & when they sell they sell at higher levels (above average price of the day).
Zeta Scalper seeks to detect this activity. When aggressive buying or selling starts where Buying & Selling Forces become unequal, the Price starts moving in one direction with candles making Higher Highs or Lower Lows.
Zeta Scalper detects these Higher Highs or Lower Lows and generates Buy or Sell signals when this happens.
In order to use this indicator, simply deploy this on your chart, and wait for Buy/Sell signals.
It works on all time frames including 1 min. 3min. 5min. & 10min. etc.
When a Buy Signal is followed by Sell signal (let it be after 3 - 4 candles or after many candles) or vice-versa, you have to switch your position to make most of the reverse move.
It is a general purpose indicator and may be used on stocks, commodities and currencies alike and is not meant for any specific market.
How to Take Buy/Sell Entry with Zeta Scalper?
Whenever you see a Buy Signal, mark its closing price with a horizontal line and as soon as a candle breaks this candle's High, it is time for you to take Entry.
Your STOP LOSS could be just 0.5% below your Entry Price, hence, no big loss even if things go wrong.
Keep moving your STOP LOSS up as the price moves in your favour and when market turns around and you see a SELL signal, it is time to book your BUY position profit and take Entry on SELL Side now and so on.
How to get this indicator?
This is invite-only indicator. Get in touch with us using information given below in Signature field to try this tool FREE.

Daily Moving Averages on Intraday ChartShows the Daily Simple Moving Averages on the Intraday Chart
This will include the 200 day SMA, 50 day SMA and 20 day SMA automatically on the intraday chart.
Daily SMA time periods can be adjusted in the settings.
Based on the following script:
Algo Trader Intraday ToolAlgo Trader Intraday Tool is a script that detects the trend and determines entry into the market based on price action / strength. To detect the trend, the volatility metric is used and is based on 2 standard deviations, one fast and one slow. The value of the fast standard deviations, will allow the indicator to be closer to the price, else the metric will be closer to the slow standard deviation which helps the indicator from changing trend and giving the expected results.
Additionally the tool is designed to monitor the strength of the market using more than 5 built-in indicators and thus making a firm alert for BUY and Sell. Also clients will get an option to customize Four EMA to re-check the quality of alerts generated by this tool.
Since the tool is designed for Intraday, Every start of the day is marked with a vertical violet line, which makes it easier to check the past performance of this tool.
Algo Trader Intraday Tool is designed and tested for Indian stock market (NSE, BSE and MCX ).
Tool is designed to use for Intraday trading only. 3 or 5 mins time frame charts are recommended to use.
Use the instruction below to obtain access to this indicator

MACD Bull Crossover and RSI Oversold 5 Candles Ago-Long StrategyHello everyone, I've been having a great time perfecting this strategy for a few weeks now. I finally feel like it's time to release it to the public and share what I have been working on.
This strategy only enters a long trade when the MACD crosses over the signal line and the RSI was oversold looking back 5 candles ago. The logic behind this is to wait for RSI to enter the oversold territory, and then when the market starts to recovery the MACD will crossover telling us the sell off is over.
This strategy will close once these 2 conditions are met.
1. MACD Histogram is above 0 and MACD crosses under the signal line.
2. RSI was overbought 5 previous candles ago.
In the strategies settings, you'll be able to enable visual stop-loss and profit levels and change those levels to what you like, enable up to 5 EMA'S,
ADDONS That Affect Strategy:
* Enable visual stop-loss and profit levels as soon as a buy signal is triggered.
* Modify stop-loss and profit levels.
* Modify RSI oversold and RSI overbought levels.
* Modify MACD Fast and Slow moving average.
ADDONS That Do Not Affect Strategy:
* Enable up to 5 EMA's. (This will not affect strategy, and is the only purpose is for people who like following EMA's.)
Thank you for taking the time to try my strategy. I hope you have the best success. I will be making a short strategy, and alerts for this strategy soon. Follow me for updates!

Intraday Masters AnalogyIntraday Masters Analogy is the tool where Buy and sell signals generates automatically according to the candles behavior.
It uses WD Gann Levels to calculate entry point with the help of VWAP.
Zigzag trend lines shows the momentum behavior for last few days and shows whether it following current trend or building new trend.
Pivot points determines the recent support and resistance levels.
Trading rule for this indicator
This indicator is designed for Indian equity stocks
Best performance is expected on 5 minutes chart or 15 minutes chart
Order thumb rule
1. avoid any trade signal before 9:35 AM Indian time
2. signal and and related stop loss candle must be formed in the same day
3. if order placed in 5 minutes chart then don't go for a target of 15 minutes chart
4. if order placed in 15 minutes time frame and target is too far then check the target in 5 minutes time frame
5. if signal candle touches the target then avoid the signal.
6. Money management is most important for this indicator.
7. Take trade only if it satisfy risk reward ratio
Signal
using vwap calculates gann square of 9 levels and if any smart money activity on that level then checks the confirmation of the trend by higherhigh or lowerlow formation
Buy Entry : entry price should be on the high of the candle before signal for buy and sl on bottom of flagged candle just before signal
SellEntry : entry price should be on the lowof the candle before signal for sell and sl on top of flagged candle just before signal
Warning : Don't place any order without stop loss

Price reversal intraday IndicatorIndicator “Price reversal intraday”
Class : oscillator
Trading type : scalping+intraday trading
Time frame : 15-30 min
Purpose : trading on rebounds and reversals
Level of aggressiveness : aggressive
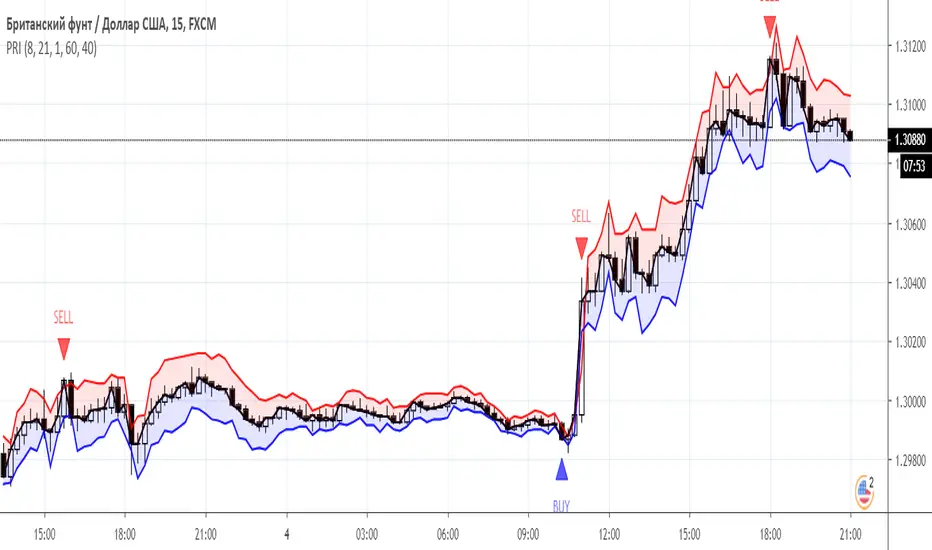
“Price reversal intraday (PRI)” indicator is designed for aggressive intraday trading on rebounds and reversals. It belongs to oscillators. The idea that formed the basis for the creation of “Price reversal intraday (PRI)” is to obtain a synergistic effect from the use of the best oscillatory techniques: modified Bollinger bands and the classic RSI oscillator.
The indicator, using advanced Bollinger technique, monitors the deviation of the current price from the equilibrium value, and then with the help of the RSI oscillator it determines the moment when this deviation reaches a critical point. As a result, a buy or sell signal is generated, which is displayed on the chart in order to facilitate the trading process as much as possible.
Structure of the indicator
Indicator consists of the following elements:
- red zone – indication of a sell zone. Entry into this zone is a signal to close long positions and search for entry points to sell asset;
- red line – extremely high positive deviation of current price from its equilibrium value;
- blue zone - indication of a buy zone. Entry into this zone is a signal to close short positions and search for entry points to buy asset;
- blue line – extremely high negative deviation of current price from its equilibrium value.
Parameters of the indicator
To configure the indicator, the following parameters are provided:
- RSI_period (default value is 8) - period for calculating the RSI oscillator.
- Ranger_period (default value - 21) - period for calculating the modified Bollinger bands.
- Ranger_width (default value - 1) - the parameter used to control the level of aggressiveness of the indicator and frequency of signals. The lower it is, the more signals the indicator will generate. Possible values from 0 to 3.
- ob (the default value is 60) - this parameter defines the overbought zone for the RSI indicator.
- os (the default value is 40) - this parameter defines the oversold zone for the RSI indicator.
Rules of trading
The main task of the trader using indicator is to monitor the location of the current market price relative to the extreme zones (blue/red). Entering the red zone is a signal for closing long positions and searching for sell entry points. Entering the blue zone is a signal for closing short positions and searching for buy entry points.
The appearance of a blue triangle with the inscription “BUY” on the chart is a signal to open buy positions, and a red triangle with the inscription “SELL” is a signal for sale.