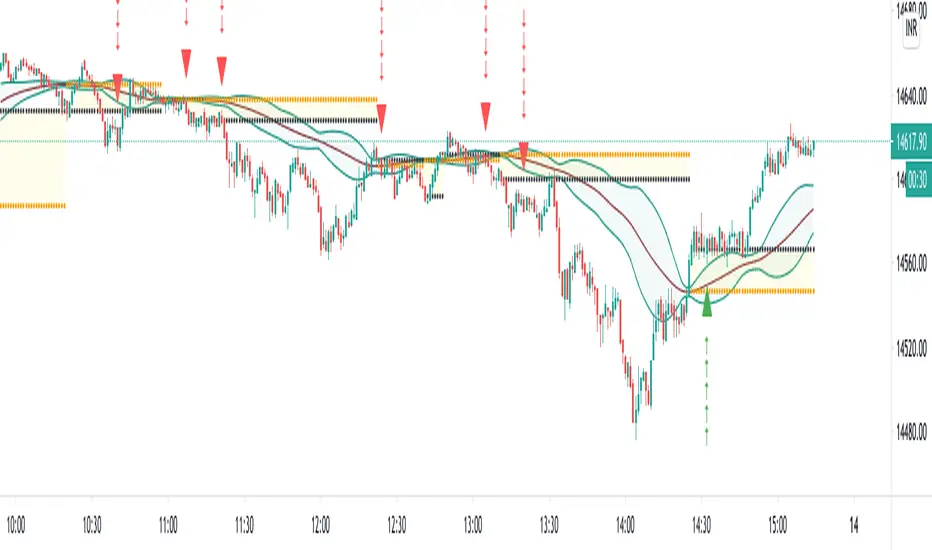
VHF Adaptive Linear Regression KAMAIntroduction
Heyo, in this indicator I decided to add VHF adaptivness, linear regression and smoothing to a KAMA in order to squeeze all out of it.
KAMA:
Developed by Perry Kaufman, Kaufman's Adaptive Moving Average (KAMA) is a moving average designed to account for market noise or volatility. KAMA will closely follow prices when the price swings are relatively small and the noise is low. KAMA will adjust when the price swings widen and follow prices from a greater distance. This trend-following indicator can be used to identify the overall trend, time turning points and filter price movements.
VHF:
Vertical Horizontal Filter (VHF) was created by Adam White to identify trending and ranging markets. VHF measures the level of trend activity, similar to ADX DI. Vertical Horizontal Filter does not, itself, generate trading signals, but determines whether signals are taken from trend or momentum indicators. Using this trend information, one is then able to derive an average cycle length.
Linear Regression Curve:
A line that best fits the prices specified over a user-defined time period.
This is very good to eliminate bad crosses of KAMA and the pric.
Usage
You can use this indicator on every timeframe I think. I mostly tested it on 1 min, 5 min and 15 min.
Signals
Enter Long -> crossover(close, kama) and crossover(kama, kama )
Enter Short -> crossunder(close, kama) and crossunder(kama, kama )
Thanks for checking this out!
--
Credits to
▪️@cheatcountry – Hann Window Smoohing
▪️@loxx – VHF and T3
▪️@LucF – Gradient
Kaufman's Adaptive Moving Average (KAMA)
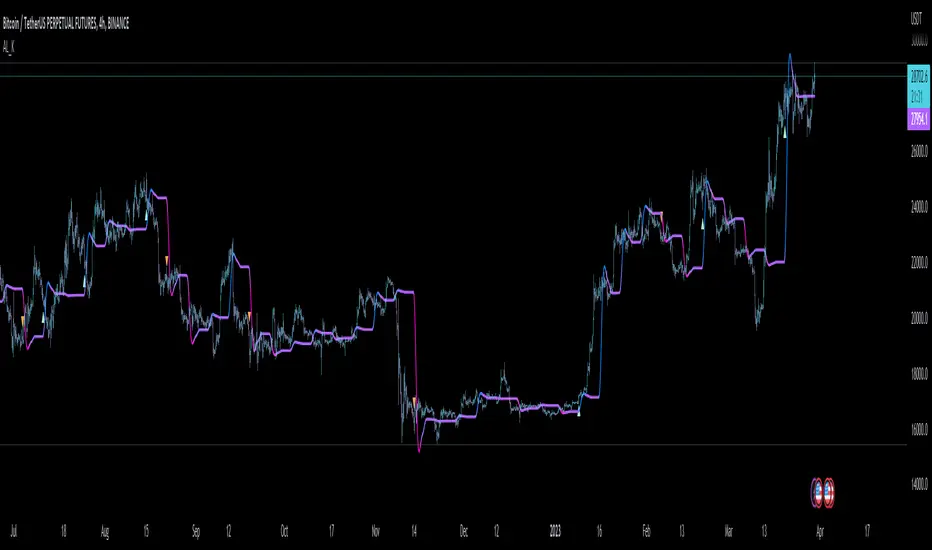
ER-Adaptive ATR Limit Channels w/ States [Loxx]As simple as it gets, channels based on high, low and ATR distances, Shows possible short term support / resistance or can be used as a take profit/stop-loss in some trading systems. It does this by comparing high/low values of price to multiplied by a multiple of ATR to determine when the trend changes. States are included to change the sensitivity to trend changes. 1 is very sensitive, 3 is least sensitive.
This uses Loxx's Expanded Source Types. You can read about them here:
What is ER Adaptive ATR?
Average True Range (ATR) is widely used indicator in many occasions for technical analysis . It is calculated as the RMA of true range. This version adds a "twist": it uses Perry Kaufman's Efficiency Ratio to calculate adaptive true range

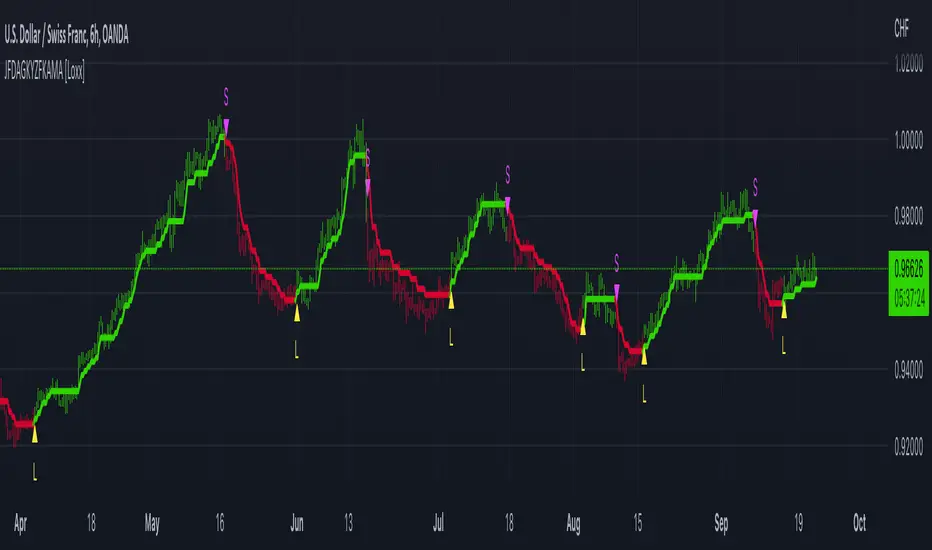
JFD-Adaptive, GKYZ-Filtered KAMA [Loxx]JFD-Adaptive, GKYZ-Filtered KAMA is a Kaufman Adaptive Moving Average with the option to make it Jurik Fractal Dimension Adaptive. This also includes a Garman-Klass-Yang-Zhang Historical Volatility Filter to reduce noise.
What is KAMA?
Developed by Perry Kaufman, Kaufman's Adaptive Moving Average ( KAMA ) is a moving average designed to account for market noise or volatility . KAMA will closely follow prices when the price swings are relatively small and the noise is low. KAMA will adjust when the price swings widen and follow prices from a greater distance. This trend-following indicator can be used to identify the overall trend, time turning points and filter price movements.
What is Jurik Fractal Dimension?
There is a weak and a strong way to measure the random quality of a time series.
The weak way is to use the random walk index ( RWI ). You can download it from the Omega web site. It makes the assumption that the market is moving randomly with an average distance D per move and proposes an amount the market should have changed over N bars of time. If the market has traveled less, then the action is considered random, otherwise it's considered trending.
The problem with this method is that taking the average distance is valid for a Normal (Gaussian) distribution of price activity. However, price action is rarely Normal, with large price jumps occuring much more frequently than a Normal distribution would expect. Consequently, big jumps throw the RWI way off, producing invalid results.
The strong way is to not make any assumption regarding the distribution of price changes and, instead, measure the fractal dimension of the time series. Fractal Dimension requires a lot of data to be accurate. If you are trading 30 minute bars, use a multi-chart where this indicator is running on 5 minute bars and you are trading on 30 minute bars.
What is Garman-Klass-Yang-Zhang Historical Volatility?
Yang and Zhang derived an extension to the Garman Klass historical volatility estimator that allows for opening jumps. It assumes Brownian motion with zero drift. This is currently the preferred version of open-high-low-close volatility estimator for zero drift and has an efficiency of 8 times the classic close-to-close estimator. Note that when the drift is nonzero, but instead relative large to the volatility , this estimator will tend to overestimate the volatility . The Garman-Klass-Yang-Zhang Historical Volatility calculation is as follows:
GKYZHV = sqrt((Z/n) * sum((log(open(k)/close( k-1 )))^2 + (0.5*(log(high(k)/low(k)))^2) - (2*log(2) - 1)*(log(close(k)/open(2:end)))^2))
Included
Alerts
Signals
Loxx's Expanded Source Types
Bar coloring
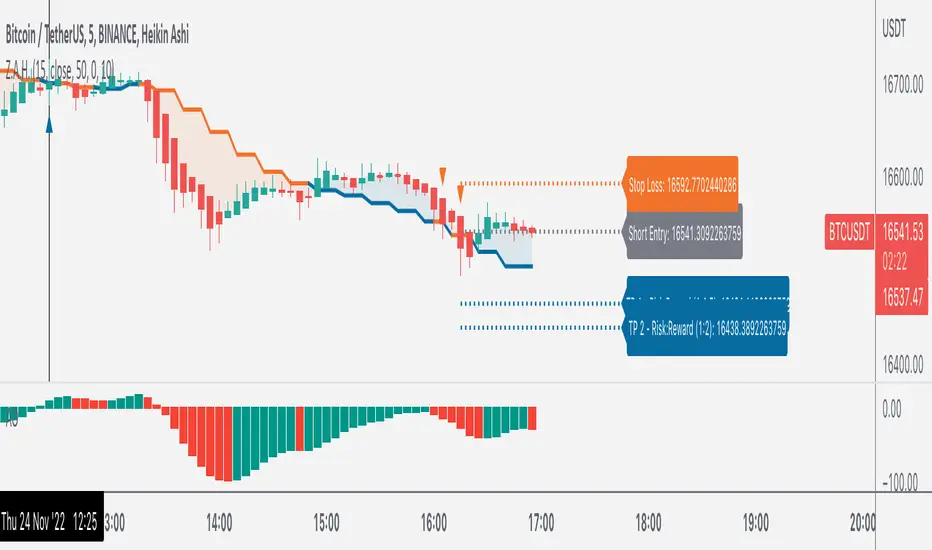
Z.A.H.It's a scalping script, which can be used using Heikin Ashi candle on 5min time frame (I personally use it for BINANCE:BTCUSDT and BINANCE:ETHUSDT scalping).
We've tried to include SL and target (1.5R and 2R) in this as well, and it works well but sometimes (please note SOMETIMES..SOMETIMES, it can be few..few pips here and there)
Idea is simple, you take the trade based on the signal given by the script and place your SL as per the script and then target 1.5R for 80% of your position and 20% for the remaining 20% of your position.
One extra thing which I've found useful is, you can use Awesome Oscillator (default setting) as well for placing SLs. If you use this method for placing SL, then just place your SL at the last green awesome oscillator candle for shorts and at the last red awesome oscillator candle for longs. From there target 1.5R and 2R.
Overall results are same for either, so you can use it as per your convenience. For any query, you can send me a DM on discord or twitter.
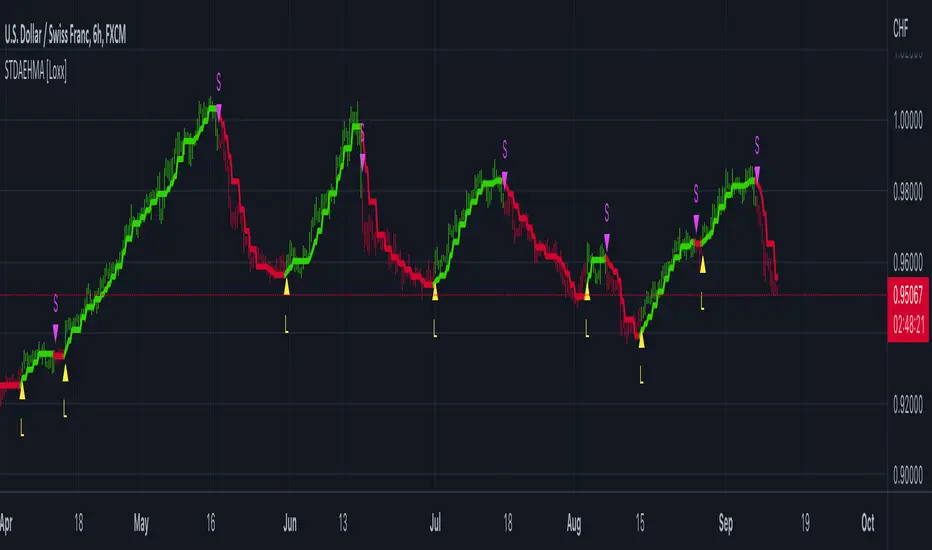
STD-Filtered, Adaptive Exponential Hull Moving Average [Loxx]STD-Filtered, Adaptive Exponential Hull Moving Average is a Kaufman Efficiency Ratio Adaptive Hull Moving Average that uses EMA instead of WMA for its computation. I've also added standard deviation stepping to further smooth the signal. Using EMA instead of WMA turns the Hull into what's called the AEHMA. You can read more about the EHMA here: eceweb1.rutgers.edu
What is the traditional Hull Moving Average?
The Hull Moving Average (HMA) attempts to minimize the lag of a traditional moving average while retaining the smoothness of the moving average line. Developed by Alan Hull in 2005, this indicator makes use of weighted moving averages to prioritize more recent values and greatly reduce lag. The resulting average is more responsive and well-suited for identifying entry points.
What is Kaufman's Efficiency Ratio?
The Efficiency Ratio (ER) was first presented by Perry Kaufman in his 1995 book ‘Smarter Trading‘. It is calculated by dividing the price change over a period by the absolute sum of the price movements that occurred to achieve that change. The resulting ratio ranges between 0 and 1 with higher values representing a more efficient or trending market.
The value of the ER ranges between 0 and 1. It has the value of 1 when prices move in the same direction for the full time over which the indicator is calculated, e.g. n bars period. It has a value of 0 when prices are unchanged over the n periods. When prices move in wide swings within the interval, the sum of the denominator becomes very large compared to the numerator and ER approaches zero.
Some uses for ER:
A qualifier for a trend following trade; a trend is considered “persistent” only when RE is above a certain value, e.g. 0.3 or 0.4 .
A filter to screen out choppy stocks/markets, where breakouts are frequently “fakeouts”.
In an adaptive trading system, helping to determine whether to apply a trend following algorithm or a mean reversion algorithm.
It is used in the calculation of Kaufman’s Adaptive Moving Average (KAMA).
How to calculate the Hull Adaptive Moving Average (HAMA)
Find Signal to Noise ratio (SNR)
Normalize SNR from 0 to 1
Calculate adaptive alphas
Apply EMAs
Included
Bar coloring
Signals
Alerts
Loxx's Expanded Source Types
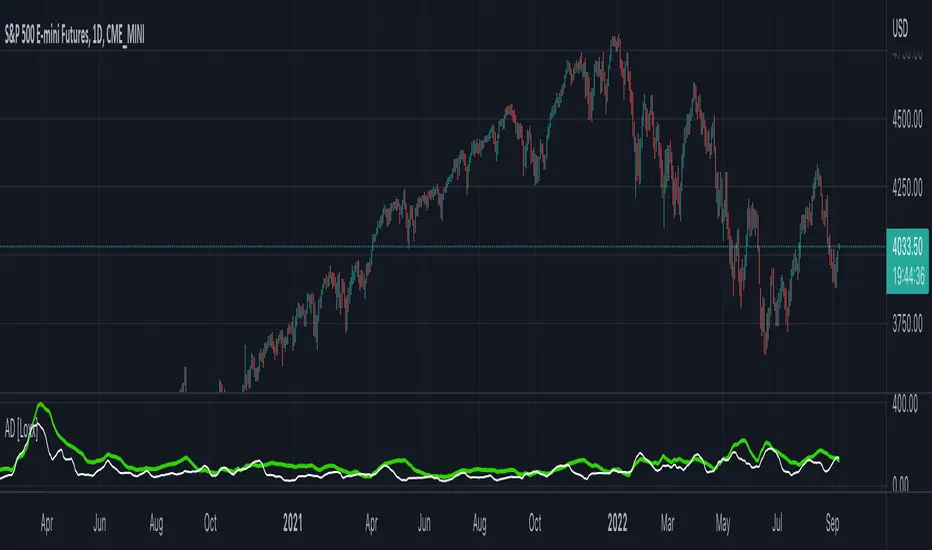
Adaptive Deviation [Loxx]Adaptive Deviation is an educational/conceptual indicator that is a new spin on the regular old standard deviation. By definition, the Standard Deviation (STD, also represented by the Greek letter sigma σ or the Latin letter s) is a measure that is used to quantify the amount of variation or dispersion of a set of data values. In technical analysis we usually use it to measure the level of current volatility.
Standard Deviation is based on Simple Moving Average calculation for mean value. This version of standard deviation uses the properties of EMA to calculate what can be called a new type of deviation, and since it is based on EMA, we can call it EMA deviation. And added to that, Perry Kaufman's efficiency ratio is used to make it adaptive (since all EMA type calculations are nearly perfect for adapting).
The difference when compared to standard is significant--not just because of EMA usage, but the efficiency ratio makes it a "bit more logical" in very volatile market conditions.
The green line is the Adaptive Deviation, the white line is regular Standard Deviation. This concept will be used in future indicators to further reduce noise and adapt to price volatility.
Included
Loxx's Expanded Source Types
Adaptive Rebound Line (ARL)The Adaptive Rebound Line (ARL) focuses on the rebound of price action according to the trend.
While it does not focus on showing the trend, it does help in anticipating price rebounds.
It achieves this by adapting quickly and by reducing lag.
It is recommended to use this with a trend-identifying indicator.
It was inspired by the Hull Moving Average and the KAMA.
Additional indicator show in the chart is Tide Finder Plus .

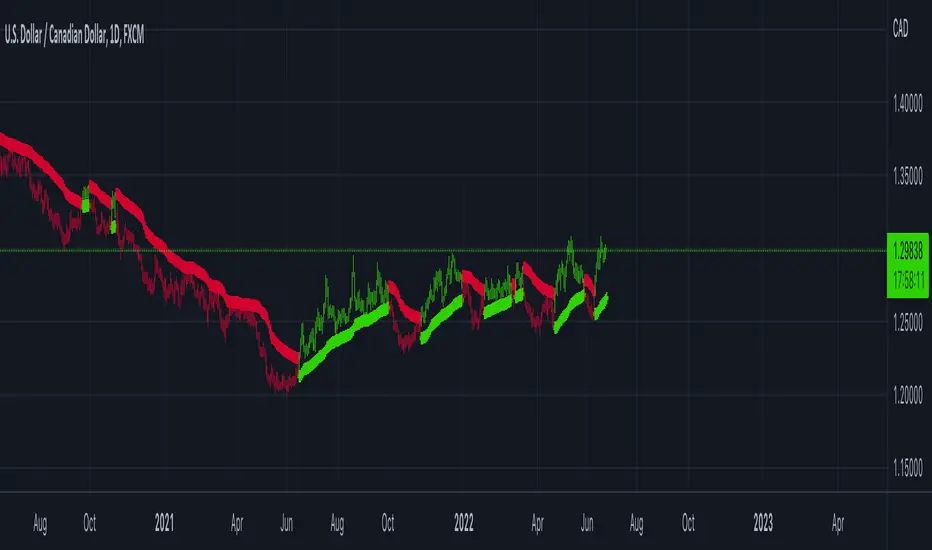
ER-Adaptive ATR [Loxx]Average True Range (ATR) is widely used indicator in many occasions for technical analysis. It is calculated as the RMA of true range. This version adds a "twist": it uses Perry Kaufman's Efficiency Ratio to calculate adaptive true range
You can use this indicator the same way you'd use the standard ATR.

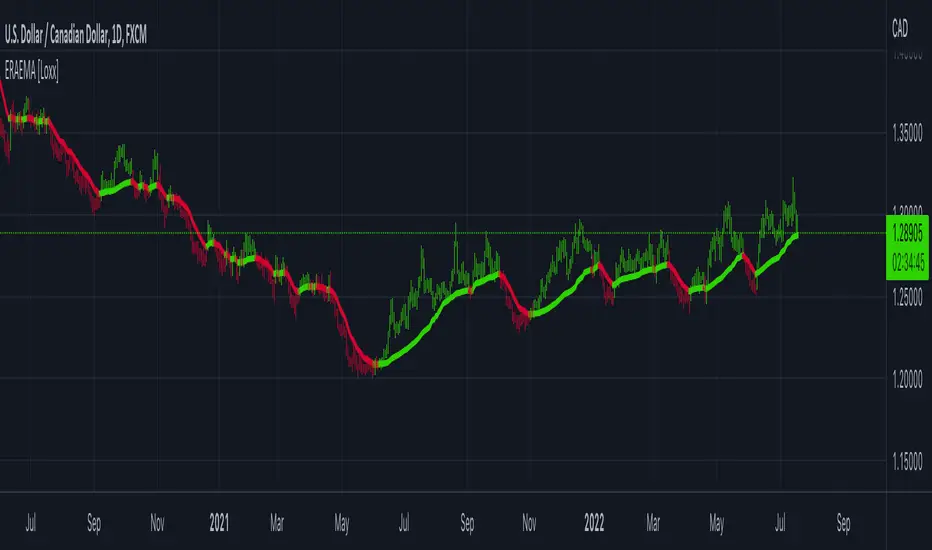
Efficiency-Ratio-Adaptive EMA [Loxx]Efficiency ratio was invented by Perry Kaufman as a measure of volatility and as a way of making some calculations adaptive. In his adaptive moving average he uses 3 periods for calculation which makes it a bit "cryptic" and, by all means, not so simple to use. This version is simplifying the whole thing without an intention to clone the KAMA indicator--but with the intention to use the efficiency ratio for adapting the average calculations and to use only two parameters for that:
period
price
Included:
Bar coloring
Adaptive Parabolic SAR (PSAR) [Loxx]Adaptive Parabolic SAR (PSAR) is an advanced Parabolic SAR with adaptive adjustments using either a Kaufman or an Ehlers smoothing algorithms.
What is the Parabolic SAR?
The parabolic SAR attempts to give traders an edge by highlighting the direction an asset is moving, as well as providing entry and exit points. In this article, we'll look at the basics of this indicator and show you how you can incorporate it into your trading strategy. We'll also look at some of the drawbacks of the indicator.
The parabolic SAR is a technical indicator used to determine the price direction of an asset, as well as draw attention to when the price direction is changing. Sometimes known as the "stop and reversal system," the parabolic SAR was developed by J. Welles Wilder Jr., creator of the relative strength index (RSI).1
On a chart, the indicator appears as a series of dots placed either above or below the price bars. A dot below the price is deemed to be a bullish signal. Conversely, a dot above the price is used to illustrate that the bears are in control and that the momentum is likely to remain downward. When the dots flip, it indicates that a potential change in price direction is under way. For example, if the dots are above the price, when they flip below the price, it could signal a further rise in price.
Additional Options
Toggle signals on/off
HiLo mode
Kaufman adaptive, Ehlers adaptive, or non adaptive
Filter by Pips
Minimum Change by Pips
Color bars
Enjoy!
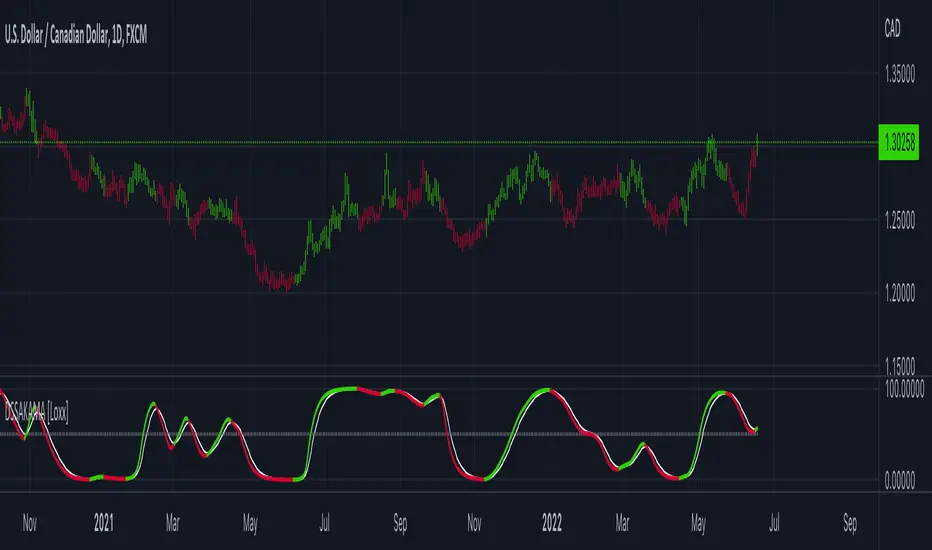
DSS of Advanced Kaufman AMA [Loxx]DSS of Advanced Kaufman AMA is a double smoothed stochastic oscillator using a Kaufman adaptive moving average with the option of using the Jurik Fractal Dimension Adaptive calculation. This helps smooth the stochastic oscillator thereby making it easier to identify reversals and trends.
What is the double smoothed stochastic?
The Double Smoothed Stochastic indicator was created by William Blau. It applies Exponential Moving Averages (EMAs) of two different periods to a standard Stochastic %K. The components that construct the Stochastic Oscillator are first smoothed with the two EMAs. Then, the smoothed components are plugged into the standard Stochastic formula to calculate the indicator.
What is KAMA?
Developed by Perry Kaufman, Kaufman's Adaptive Moving Average (KAMA) is a moving average designed to account for market noise or volatility . KAMA will closely follow prices when the price swings are relatively small and the noise is low. KAMA will adjust when the price swings widen and follow prices from a greater distance. This trend-following indicator can be used to identify the overall trend, time turning points and filter price movements.
What is the efficiency ratio?
In statistical terms, the Efficiency Ratio tells us the fractal efficiency of price changes. ER fluctuates between 1 and 0, but these extremes are the exception, not the norm. ER would be 1 if prices moved up 10 consecutive periods or down 10 consecutive periods. ER would be zero if price is unchanged over the 10 periods.
What is Jurik Fractal Dimension?
There is a weak and a strong way to measure the random quality of a time series.
The weak way is to use the random walk index ( RWI ). You can download it from the Omega web site. It makes the assumption that the market is moving randomly with an average distance D per move and proposes an amount the market should have changed over N bars of time. If the market has traveled less, then the action is considered random, otherwise it's considered trending.
The problem with this method is that taking the average distance is valid for a Normal (Gaussian) distribution of price activity. However, price action is rarely Normal, with large price jumps occuring much more frequently than a Normal distribution would expect. Consequently, big jumps throw the RWI way off, producing invalid results.
The strong way is to not make any assumption regarding the distribution of price changes and, instead, measure the fractal dimension of the time series. Fractal Dimension requires a lot of data to be accurate. If you are trading 30 minute bars, use a multi-chart where this indicator is running on 5 minute bars and you are trading on 30 minute bars.
Included
-Toggle bar colors on/offf
Parabolic SAR of KAMA [Loxx]Parabolic SAR of KAMA attempts to reduce noise and volatility from regular Parabolic SAR in order to derive more accurate trends. In addition, and to further reduce noise and enhance trend identification, PSAR of KAMA includes two calculations of efficiency ratio: 1) price change adjusted for the daily volatility; or, 2) Jurik Fractal Dimension Adaptive (explained below)
What is PSAR?
The parabolic SAR indicator, developed by J. Wells Wilder, is used by traders to determine trend direction and potential reversals in price. The indicator uses a trailing stop and reverse method called "SAR," or stop and reverse, to identify suitable exit and entry points. Traders also refer to the indicator as to the parabolic stop and reverse, parabolic SAR, or PSAR.
What is KAMA?
Developed by Perry Kaufman, Kaufman's Adaptive Moving Average (KAMA) is a moving average designed to account for market noise or volatility. KAMA will closely follow prices when the price swings are relatively small and the noise is low. KAMA will adjust when the price swings widen and follow prices from a greater distance. This trend-following indicator can be used to identify the overall trend, time turning points and filter price movements.
What is the efficiency ratio?
In statistical terms, the Efficiency Ratio tells us the fractal efficiency of price changes. ER fluctuates between 1 and 0, but these extremes are the exception, not the norm. ER would be 1 if prices moved up 10 consecutive periods or down 10 consecutive periods. ER would be zero if price is unchanged over the 10 periods.
What is Jurik Fractal Dimension?
There is a weak and a strong way to measure the random quality of a time series.
The weak way is to use the random walk index (RWI). You can download it from the Omega web site. It makes the assumption that the market is moving randomly with an average distance D per move and proposes an amount the market should have changed over N bars of time. If the market has traveled less, then the action is considered random, otherwise it's considered trending.
The problem with this method is that taking the average distance is valid for a Normal (Gaussian) distribution of price activity. However, price action is rarely Normal, with large price jumps occuring much more frequently than a Normal distribution would expect. Consequently, big jumps throw the RWI way off, producing invalid results.
The strong way is to not make any assumption regarding the distribution of price changes and, instead, measure the fractal dimension of the time series. Fractal Dimension requires a lot of data to be accurate. If you are trading 30 minute bars, use a multi-chart where this indicator is running on 5 minute bars and you are trading on 30 minute bars.
Conclusion from the combined efforts explained above:
-PSAR is a tool that identifies trends
-To reduce noise and identify trends during periods of low volatility, we calculate a PSAR on KAMA
-To enhance noise and reduction and trend identification, we attempt to derive an efficiency ratio that is less reliant on a Normal (Gaussian) distribution of price
Included:
-Customization of all variables
-Select from two different ER calculation styles
-Multiple timeframe enabled

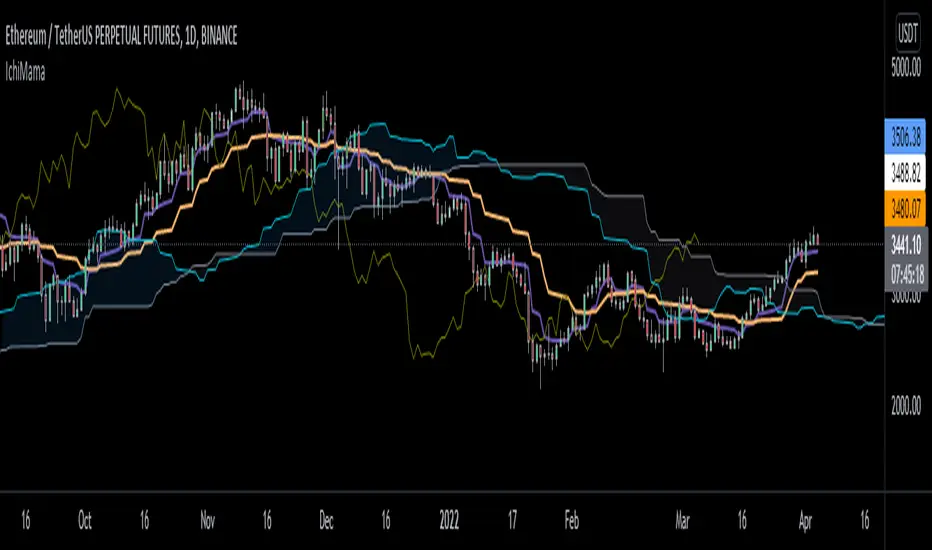
IchiMAMA (Experimental)Goichi Hosoda's "Ichimoku Kinkō Hyō" is a widely used Trend Following indicator and can be defined as a "system" rather than an indicator.
Published in the late 1960's, consisting of 5 lines.
TenkanSen (Conversion Line) = of the last 9 bars
KijunSen (Base Line) = of the last 26 bars
SenkouSpanA (Leading Span A) = Average of Tenkan&KijunSen shifted -> 26 bars
SenkouSpanB (Leading Span B) = of the last 52 bars
ChikouSpan (Lagging Span) = Price shifted <- 26 bars
On the other hand, Mesa Adaptive Moving Average developed by John Ehlers around early 2000's shows similarities with Hosoda's Tenkan and KijunSen using a different calculation method. For futher info: www.mesasoftware.com
I find MAMA superior to TenkanSen and KijunSen in terms of crossing signals.
Ichimoku:
Thus, decided to replace TenkanSen and KijunSen of regular Ichimoku with MAMA&FAMA of Ehlers and calculated SenkouSpanA accordingly. SenkouSpanB and ChikouSpan stays the same as per Ichimoku's logic. (Periods are 30 by default for cryptocurrencies. If stocks then 26)
IchiMAMA:
This is purely experimental and educational. Hope you'll like it :)
I'd like to thank @everget for MAMA&FAMA
and @KivancOzbilgic for Ichimoku Kinkō Hyō and Volume Based Colored Bars
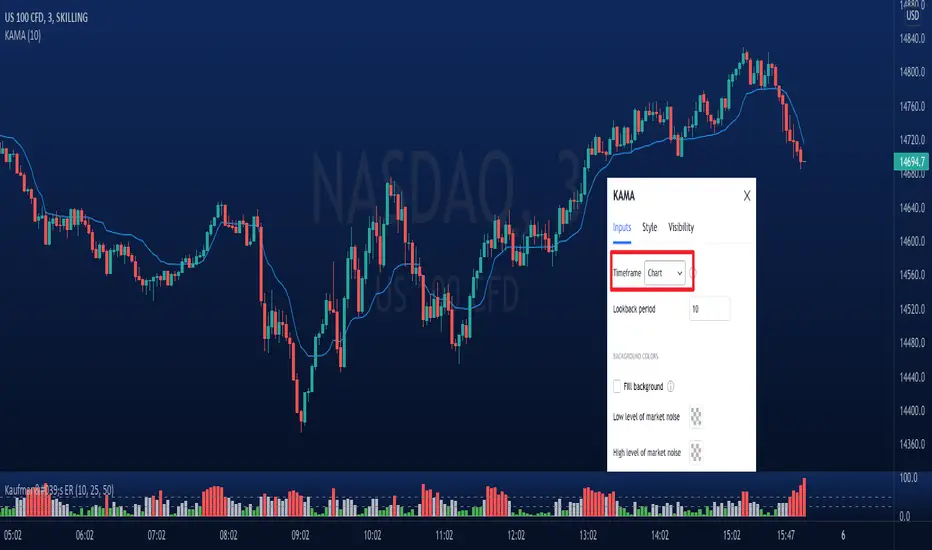
Kaufman's Adaptive Moving Average (KAMA) - Multi timeframeKaufman's Adaptive Moving Average (KAMA)
KAMA was developed by Perry Kaufman to give better directions of short term market trends.
Idea is similar to an EMA, but it makes adjustments to the smoothing factor by taking Market Noise into consideration. Levels of noise in KAMA is modelled using Kaufman's Efficiency Ratio .
The problem with traditional of moving averages (ie. SMA/EMA) is that they are very sensitive to sudden price movements.
Applications:
- Less prone to false signals compared to other types of moving averages. When price suddenly surges or tanks, KAMA will lag behind telling us that the move is rather abnormal.
- On the other hand, when volatility of price movements is low, KAMA will be close to the ranging candles with a slope approximate to zero. KAMA can be used for filtering out choppy markets.
Other features:
- Multi-timeframe.
- Can visualize levels of market noise with background color mode turned on.
JC MAs: SMA, WMA, EMA, DEMA, TEMA, ALMA, Hull, Kaufman, FractalThe best collection of moving averages anywhere. I know, because I searched, couldn't find the right collection, and so wrote it myself!
-------------------------------------------------------------------------------
Notable features that either aren't found anywhere else...or at least in one place:
-------------------------------------------------------------------------------
• The "Triple Exponential Moving Average", is actually that mathematically - rather than "three seperate EMA graphs", as is commonly found on Trading View.
• Includes exotic moving averages: Hull Moving Average (HMA), Kaufman's Adaptive Moving Average (KAMA), and Fractal Apaptive Moving Average (FrAMA).
• Each moving average has its own user-definable averaging length in DAYS, rather than an abstract "length". This is respected even for different graphing resolutions, and different chart views - even for the more exotic MAs.
• Days can be fractional.
• A master time resolution ("Timeframe") is also user-definable. And unlike most other moving average charts, this won't affect the internal "length" variable (specified days are still respected), it only changes the graphing resolution. You can also specify to use chart's resolution - which, as you know, is not very useful for moving averages - yet so many moving average scripts on Trading View don't let you specify otherwise.
• If every CPU cycle counts, you can set "days" to 0 to prevent a particular unneeded moving average from being calculated at all.
• Includes a custom moving average that is unique, if you're looking for a tiny edge in TA to beat everyone else looking at the same stuff: a customizable weighted blend of SMA, TEMA, HMA, KAMA, and FrMA. (Note: The weights for these blends don't have to add up to 100, they will self-level no matter what they add up to.)
• By default, the averages are color-coded according to rainbow order of light spectrum frequency, relative to approximate responsiveness to current price: Red (SMA) is the laziest, violet (FrAMA) is the most hyper, and green is in the middle.
-------------------------------------------------------------------------------
Contains the following moving averages, in order of responsiveness:
-------------------------------------------------------------------------------
• Simple Moving Average (SMA)
• Arnaud Legoux Moving Average (ALMA)
• Exponential Moving Average (EMA)
• Weighted Moving Average (WMA)
• Blend average of SMA and TEMA (JCBMA)
• Double Exponential Moving Average (DEMA)
• Triple Exponential Moving Average (TEMA)
• Hull Moving Average (HMA)
• Kaufman's Adaptive Moving Average (KAMA)
• Fractal Apaptive Moving Average (FrAMA)
Note: There are a few extreme edge cases where the graphs won't render, which are obvious. (Because they won't render.) In which case, all you need to do is choose a more sane master resolution ("Timeframe") relative to the timeframe of the chart. This is more about the limits of Trading View, than specific script bugs.
-------------------------------------------------------------------------------
Includes reworked code snippets
-------------------------------------------------------------------------------
• "Kaufman Moving Average Adaptive (KAMA)" by HPotter
• "FRAMA (Ehlers true modified calculation)" by nemozny
• Which in turn was based on "Fractal Adaptive Moving Average (real one)" by Shizaru

Ehlers Kaufman Adaptive Moving Average [CC]The Kaufman Adaptive Moving Average was created by Perry Kaufman and this is a variation of that original formula created by John Ehlers. I have included a side by side with an original script (blue line) done by @HPotter that shows that Ehlers version is slightly more reactive compared to the original version. I have included strong buy and sell signals in addition to normal ones and so darker colors are strong signals and lighter colors are normal ones. Buy when the line turns green and sell when it turns red.
Let me know if there are any other scripts you would like to see me publish!

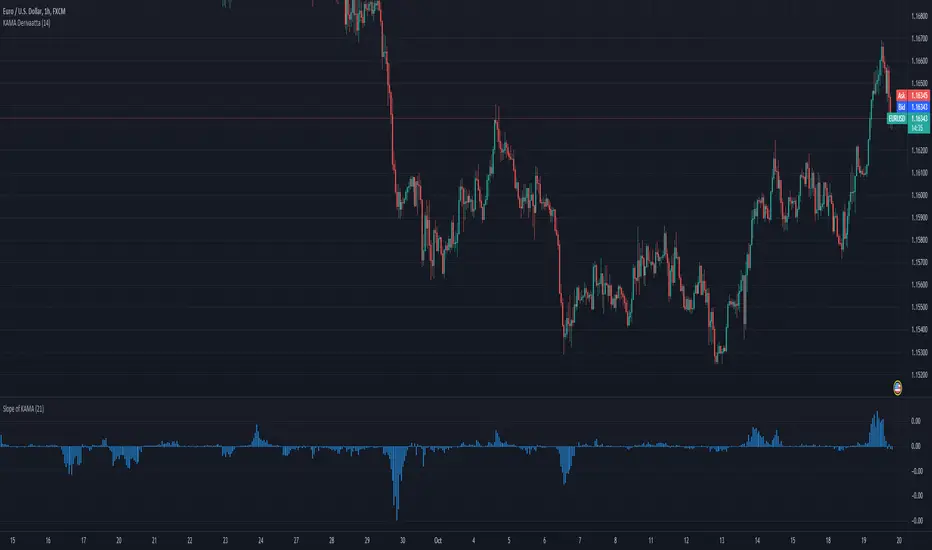
Slope of KAMAShows the slope of KAMA by comparing last bar KAMA value to current bar KAMA value. Very simple, yet very effective determining the trend or volatility of market. When slope is very small market can be in range, hence it can be used as volatility filter for trend traders.
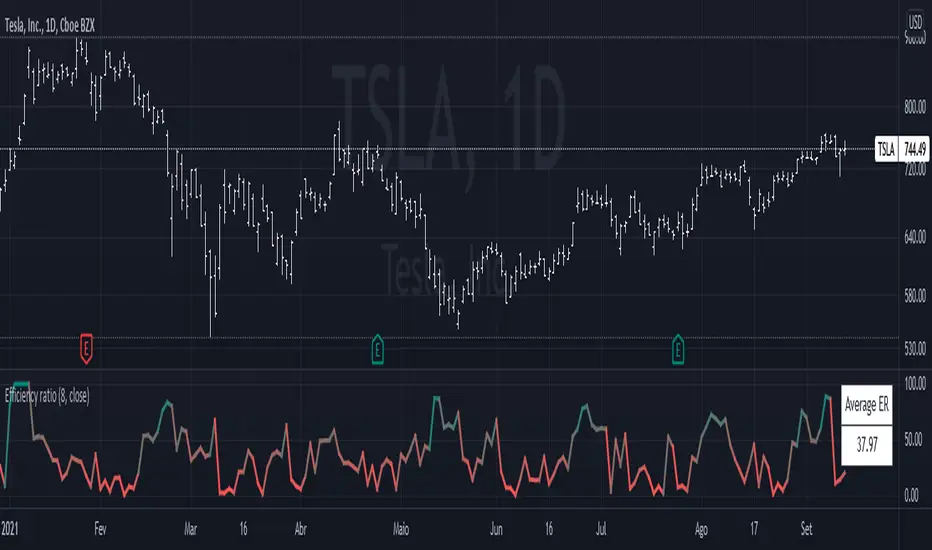
Efficiency RatioThe efficiency ratio (ER) is described by Perry Kaufman in his book, Trading Systems and Methods.
It works by measuring the momentum of the market, that is, the absolute change from the current price to a past price, and divides it by the volatility, which is the sum of the absolute changes of each bar. That makes this a bounded indicator, going from 0 to 100, like an oscillator. Higher values mean less noise, while lower values mean more.
Eg.: if the market moves from 10.0 to 15.0 in a directional manner, with every bar up, the ER is going to be at 100. However, if it moves up and down, and goes all over the place until finally reaching 15.0, the ER is going to be at around 20. It is very difficult for the ER to be at zero, because that would require 0 volatility, which is almost impossible to occur.
This indicator is useful when planning for trades. If you notice the ER being higher than average, you may choose to increase the position size, because that would mean that the market is directional and has less chance of a whipsaw.
[blackcat] L2 Perry Kaufman Adaptive MA (KAMA)Level: 2
Background
Kaufman’s Adaptive Moving Average (KAMA) was developed by American quantitative financial theorist Perry J. Kaufman in 1998. The technique began in 1972 but Kaufman officially presented it to the public much later through his book, “Trading Systems and Methods.” Unlike other moving averages, Kaufman’s Adaptive Moving Average accounts not only for price action but also for market volatility. KAMA is a moving average that takes into account market noise or volatility. KAMA will closely track prices when price fluctuations are relatively small and noise is low. KAMA will adapt to increasing price fluctuations and track prices from a greater distance. This trend following indicator can be used to identify the overall trend, time turning points and to filter price movements.
Function
You can use KAMA like any other trend-following indicator, such as a moving average. You can look for price crosses, directional changes and filtered signals. First, a cross above or below KAMA indicates directional changes in prices. As with any moving average, a simple crossover system will generate lots of signals and lots of whipsaws. Second, You can use the direction of KAMA to define the overall trend for a security. This may require a parameter adjustment to smooth the indicator further. You can change the fastline and slowline parameters to smooth KAMA and look for directional changes. The trend is down as long as KAMA is falling and forging lower lows. The trend is up as long as KAMA is rising and forging higher highs. Finally, You can combine signals and techniques. You can use a longer-term KAMA to define the bigger trend and a shorter-term KAMA for trading signals.
I have included in the indicator an input named "EnableSmooth" that allows you to determine if the KAMA line should be smoothed or not. A "True" as the input value smoothes the calculation. An "False" simply plots the raw KAMA line. When market volatility is low, Kaufman’s Adaptive Moving Average remains near the current market price, but when volatility increases, it will lag behind. What the KAMA indicator aims to do is filter out “market noise” – insignificant, temporary surges in price action. One of the primary weaknesses of traditional moving averages is that when used for trading signals, they tend to generate many false signals. The KAMA indicator seeks to lessen this tendency – generate fewer false signals – by not responding to short-term, insignificant price movements. Traders generally use the moving average indicator to identify market trends and reversals.
Key Signal
AMAValF --> KAMA Fast Line.
AMAValS --> KAMA Slow Line.
Remarks
This is a Level 2 free and open source indicator.
Feedbacks are appreciated.

Advance AMA with Sylvain BandsMany traders believe that the moving averages are favorite tools and analysts have spent decades trying to improve moving averages partiularly the simple moving average. One way to address the disadvantages of moving averages is to multiply the weighting factor by a volatility ratio which is called Adaptive moving averages.
This indicator uses an special adaptive moving averages which is developed by John Ehlers. The model adapts to price movement “based on the rate change of phase as measured by the Hilbert Transform Discriminator”. This method of adaptation features a fast and a slow moving average so that the composite moving average swiftly responds to price changes and holds the average value until the next bars close. In addition, the smoothed Volatility Bands were created by Sylvain Vervoort is included.

Adaptive Moving Average - Crossingshows and fills corssings of two KAMA. One with signal liength of 10, and the other 50.

Intraday VWAP weighted averaged KAMA BandsFor Intraday trading!
This indicator helps in figuring out the directivity as well as optimum entry criteria in an Intraday Trade
Most of the times in market,
it makes a good sense for any trader to have a particular bias, the indicator helps provide biases with the potential target bands
Explore it and come up with your own explanation! The indicator is self intuitive
Buy when Blue price tracker line appears
Sell when Orange price tracker line appears
Target the just next band line! or Pivot
Which timeframes it works best ?
It is designed for 1 minute
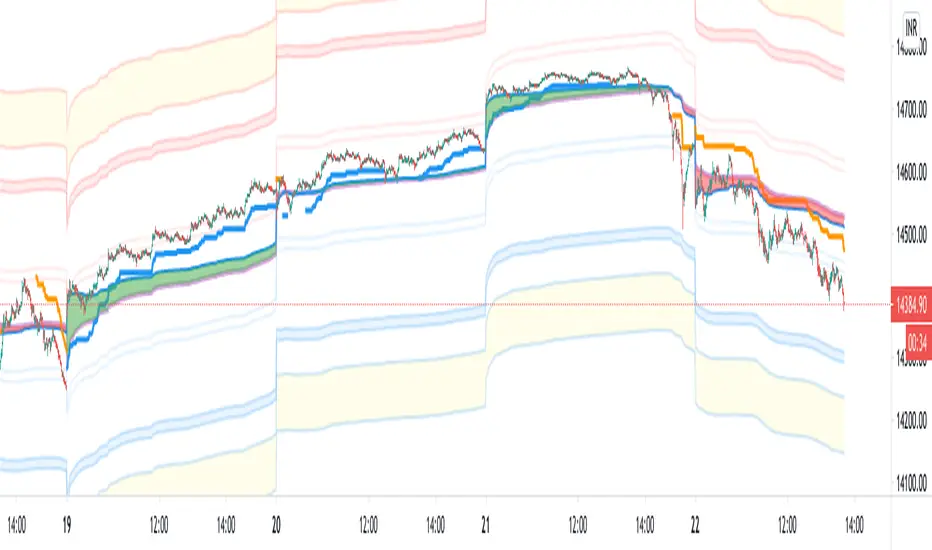
Volume weighted KAMA bands with SignalsOverview
KAMA : Kaufmann's Adaptive moving Average if used correctly can help us get good signals to start working on,
This indicator uses 4 different kamas and Vwap for Average weighting
The Average Weight is calulated by
AverageWeight =( VWAP+ Kama1+ Kama2 + Kama3 + Kama4)/5
After the Average Weights are calculated Standard Deviation Bands of 2sigma and a lookback period is Plotted around the Average Weights
Then with the help of a signal generator Rate of change signals are calculated and plotted as Arrows (green and red)
The script comes with Alerts for Long and Short Signals
The yellow boxes you see are the points of standard deviation compressions in the bands
How to use
Use it as a screener, for Long short signals by creating alerts around different securities as you like
Which Timeframe it works
It will work over any timeframe
How to get access
Just add the script to favorites and start using it on your charts (apply it by going to the favorites section when you click Fx icon for indicators)
Thanks to tradingview for providing such an awesome platform