[A618] Liquidity Levels Based OBV SR with KAMAWe all know OBV plays a very important role in figuring out price volume divergences and it can help anyone analyse the directivity force of the market and has a very good tradeoff if applied correctly
In this Experiment i have derived liquidity levels for OBV using volume jumps inside the market
A volume jump is classified as:
Good Volume Jump = 1.618 times the Average Volume (WMA or 2pole ButterWorth's Filter of Volume)
Great Volume Jump = 2 times the Average Volume (WMA or 2pole ButterWorth's Filter of Volume)
Extreme Volume Jump = 3 times the Average Volume (WMA or 2pole ButterWorth's Filter of Volume)
So the horizontal levels which you see on the indicator (colored in red/ blue / gray lines) are the derived Liquidity Levels for OBV in the Market, these are the levels where OBV is most likely to perform a movement or come back
Also I have applied KAMA indicator on top of OBV for better Directive guidance, as of my experiments KAMA seems to be most stable and consistence of all the other moving averages,
KAMA's Length inculde:
KAMA - 8
KAMA - 34
KAMA - 200
Hope this Script help you guys!
Thanks to Tradingview for providing such an awesome platform
##Note for Credits ::
The Ehlers 2 pole butterworth Filter function is derived from @cheatcountry script ()
Kaufman's Adaptive Moving Average (KAMA)

MA+MA+ is a multi time frame moving average indicator with more than a dozen different moving averages (like KAMA, VAMA, JMA, HMA and much more).
More moving averages will be added on every update, hence Follow me to get notified.
MA+ Supports automatic (AUTO in settings) time frame multiplier. For example, if you set 'Auto Resolution Multiplier' to 6, and your base chart is 5 minutes, the moving averages will plot at 5 * 6 = 30 minutes.
You can still use 'User Defined' to use your own time frame without using the multiplier.
Use higher time frame than the base chart time frame to avoid repainting.
Default multiplier for higher time frame is 2.
Supports Signals 1 (rising MA) or -1 (falling MA) to attach to another indicator.
Bars are not colored by default.
Just for this great community, You can request in the comments other moving averages that do not exists in MA+.

Tobacco ChannelThese bands use KAMA for the basis, build Keltner Channels that you might expect high probability reversals to occur from.
I named it Tobacco Channel because I found its idea in Cuban's Reversion Bands — Indicator by cubantobacco.

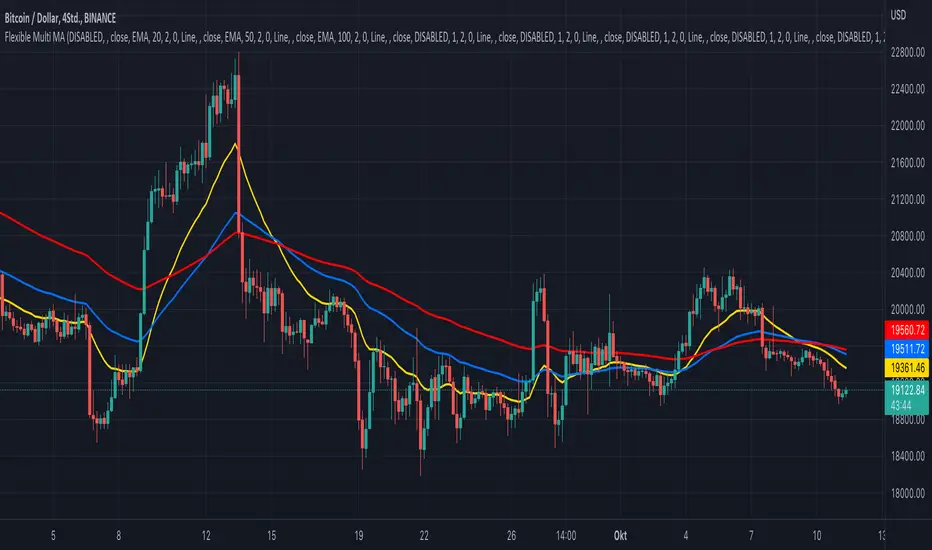
KINSKI Flexible Multi MA (EMA, SMA, RMA, WMA, VWMA, KAMA, HMA)This Multi Moving Average (MA) indicator is more flexible than any other indicator of this type offered so far. You can define up to 10 different Moving Average (MA) lines based on different calculation variants.
The following MA types can be configured.
- EMA: Exponentially Moving Average
- SMA: Small Moving Average
- RMA: Rolling Moving Average
- WMA: Weighted Moving Average
- VWMA: Volume Weighted Moving Average
- KAMA: Kaufman's Adaptive Moving Average
- HMA: Hull Moving Average
Which settings can be made?
- Selection for calculation formula ("Calculation Source"). The default value is "close".
- for each MA line the "Length" and the "Type" can be defined
- furthermore you can make layout adjustments via the "Style" menu
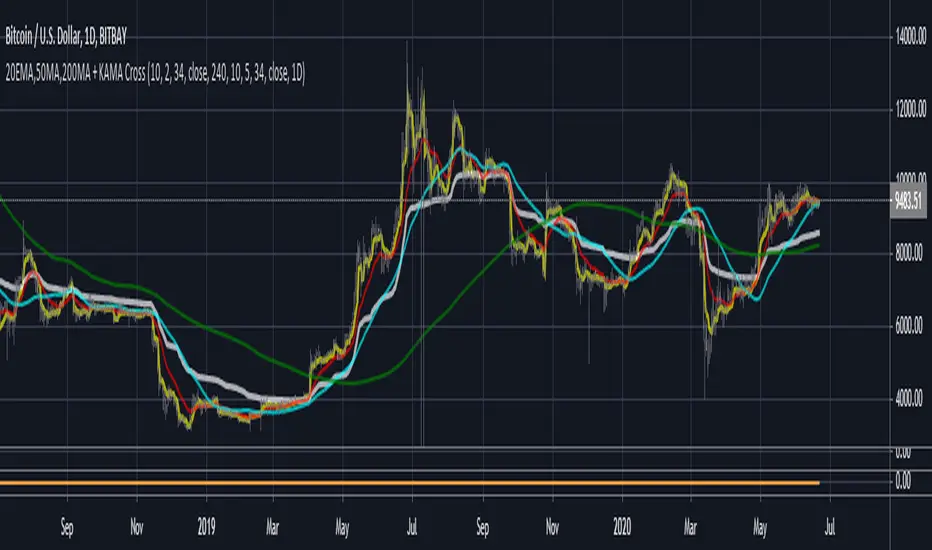
3MA'S + KAMA Trend (20EMA,50MA,200MA + KAMA Trend)This indicator, combines the traditional FOREX moving averages (20EMA, 50ma, 200ma) into a single indicator with
an adaptive moving average (AMA) taken from a user defined timeframe to show trend direction (by default, it plots
the daily 10/2/34 KAMA overlayed on any timeframe chart.
An AMA moves slowly when markets are sideways but swiftly during periods of volatility as a result it reacts much fast than
traditional options for moving average trends.
If the price is above the KAMA, trend is up. Below the KAMA, trend is down.
Moving Average Compendium===========
Moving Average Compendium (16 MA Types)
===========
A selection of the most popular, widely used, interesting and most powerful Moving Averages we can think of. We've compiled 16 MA's into this script, and allowed full access to the source code so you can use what you need, as you need it.
-----------
From very simple moving averages using built-in functions, all the way through to Fractal Adaptive Averages, we've tried to cover as much as we can think of! BUT, if you would like to make a suggestion or recommendation to be added to this compendium of MA's please let us know! Together we can get a complete list of many dozens of types of Moving Average.
Full List (so far)
---
SMA - Simple Moving Average
EMA - Exponential Moving Average
WMA - Weighted Moving Average
VWMA - Volume Weighted Moving Average
DEMA - Double Exponential Moving Average
TEMA - Triple Exponential Moving Average
SMMA - Smoothed Moving Average
HMA - Hull Moving Average
ZLEMA - Zero-Lag Exponential Moving Average
KAMA - Kaufman Adaptive Moving Average
JMA - Jurik Moving Average
SWMA - Sine-Weighted Moving Average
TriMA - Triangular Moving Average
MedMA - Moving Median Average
GeoMA - Geometric Mean Moving Average
FRAMA - Fractal Adaptive Moving Average
Line color changes from green (upward) to red (downward) - some of the MA types will "linger" without moving up or down and when they are in this state they should appear gray in color.
Thanks to all involved -
Good Luck and Happy Trading!

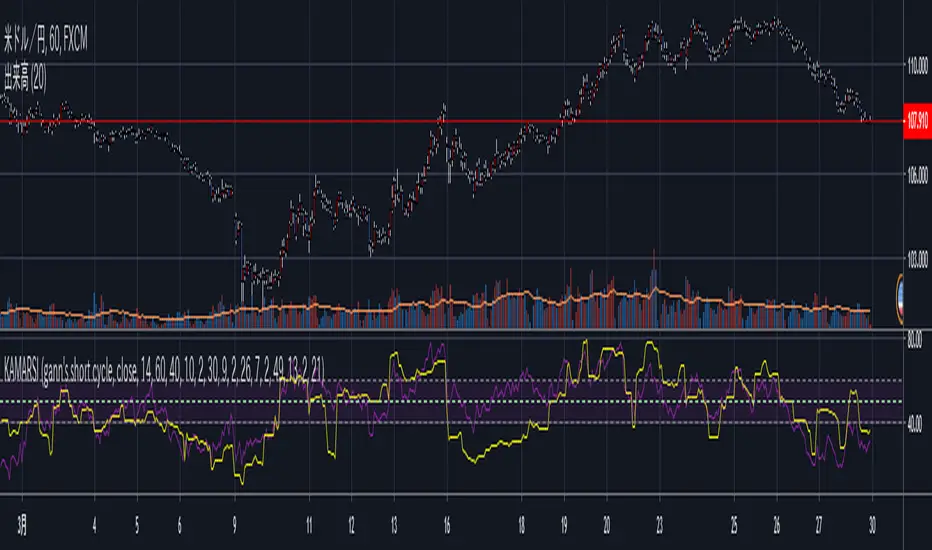
RSI based on Kaufman’s Adaptive Moving Average This is RSI based on Kaufman’s Adaptive Moving Average.
Drawing line flatter than normal RSI.
In My sense, it can easier find Divergence than normal RSI.
I use William Delbert Gann's short cycle of "multiples of 7" for the default setting.
Or, you can choose and customize a setting from my preset.
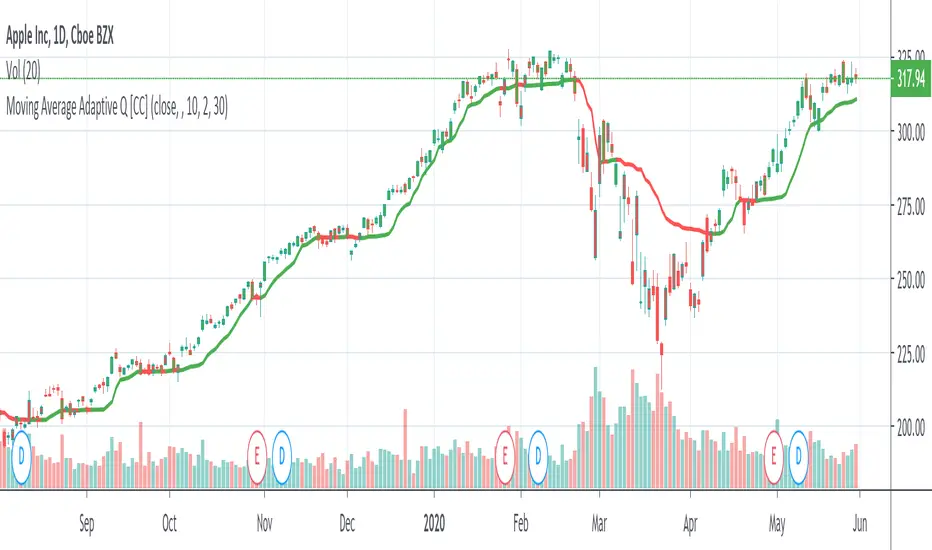
Moving Average Adaptive QThe Moving Average Adaptive Q (MAAQ) was authored by Perry Kaufman in the Stocks and Commodities Magazine 06/1995
This is similar to his Kaufman Adaptive Moving Average with a few changes. This is a pretty close moving average which I like quite a bit. Try it and let me know what you think.
Send me a message and let me know what other indicators you would like to see!
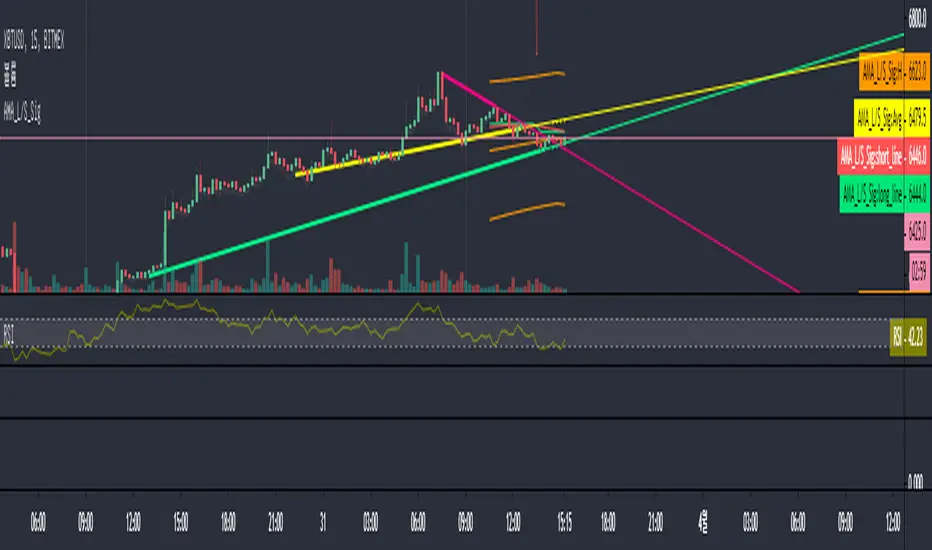
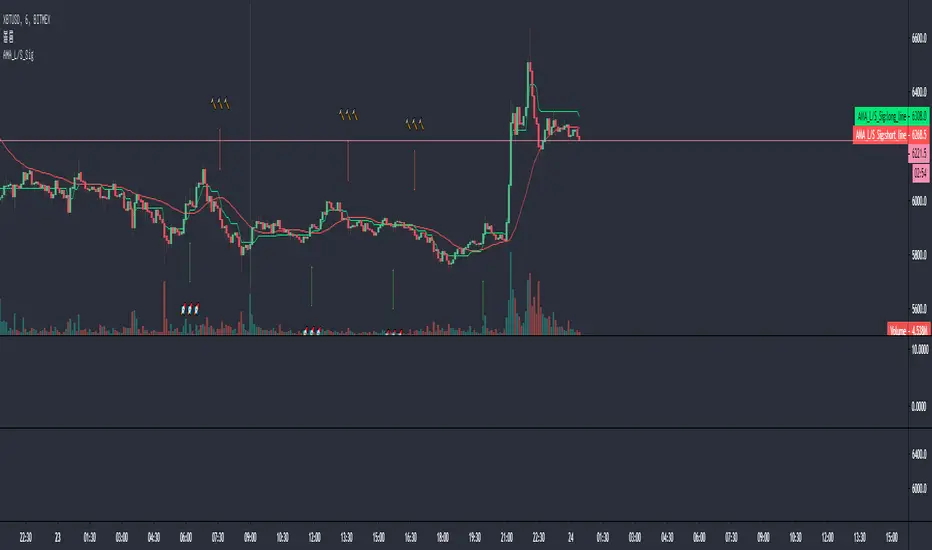
AMA_L/S_Sig- Fast EMA, Slow EMA Cross Strategy
- Use AMA for Slow
- Fast is expressed in some smoothing ways
- Hyper parameters not tuned
- For reference purposes
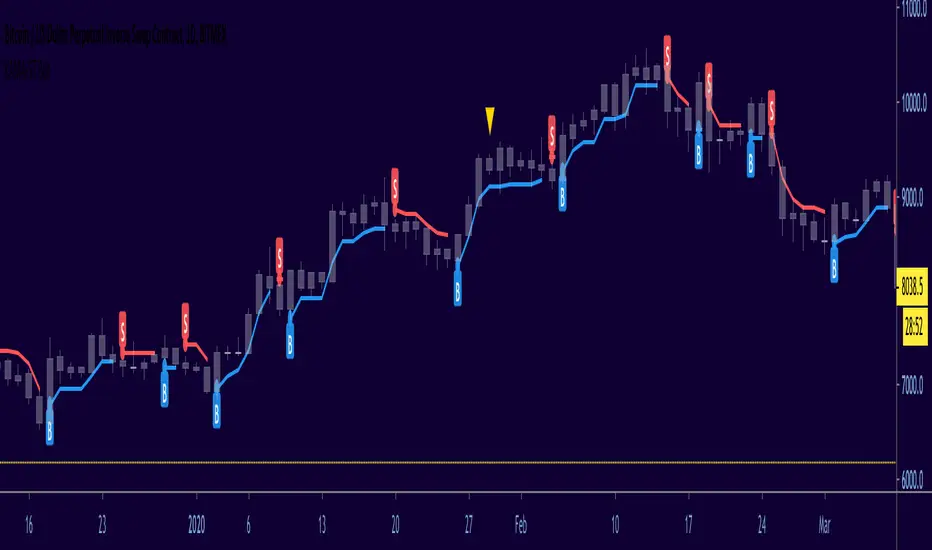
KAMA-ST BotExperimental supertrend model using KAMA (Kaufman Adaptive Moving Average) instead of RMA /SMA.
Good for scalping, NOT trend trading.
DO NOT USE THIS AS A STOPLOSS... you will get stopped!
Signals as what they are, no repaint, use other indicators as confirmation.
...have a play, good luck & stay safe!
Uber Baseline [UTS]Fixed Trend Visualization
The trend is assumed UP while candle closes are above baseline. The baseline is then colored green.
The trend is assumed DOWN while candle closes are below baseline. The baseline is painted red in this case.

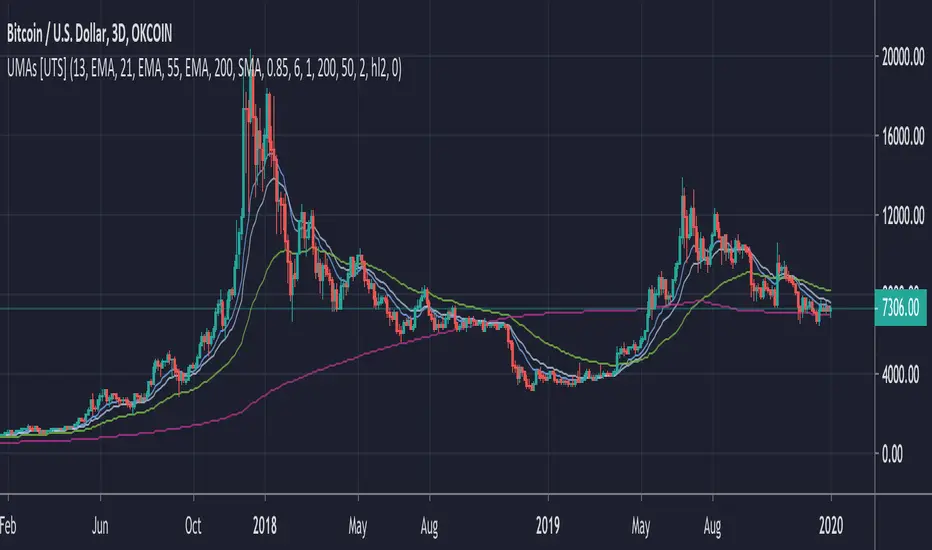
Uber Moving Averages [UTS]Uber Moving Averages are four highly customisable moving averages to complement your technical analysis.
The optional trend direction visualisation makes it a powerful tool for trend weighted analysis.
Moving Averages
16 different Moving Averages are at your disposal.
Trend Visualisation
If the predominant trend direction is DOWN the moving average is painted red. If the trend direction is UP the moving average is painted in green.
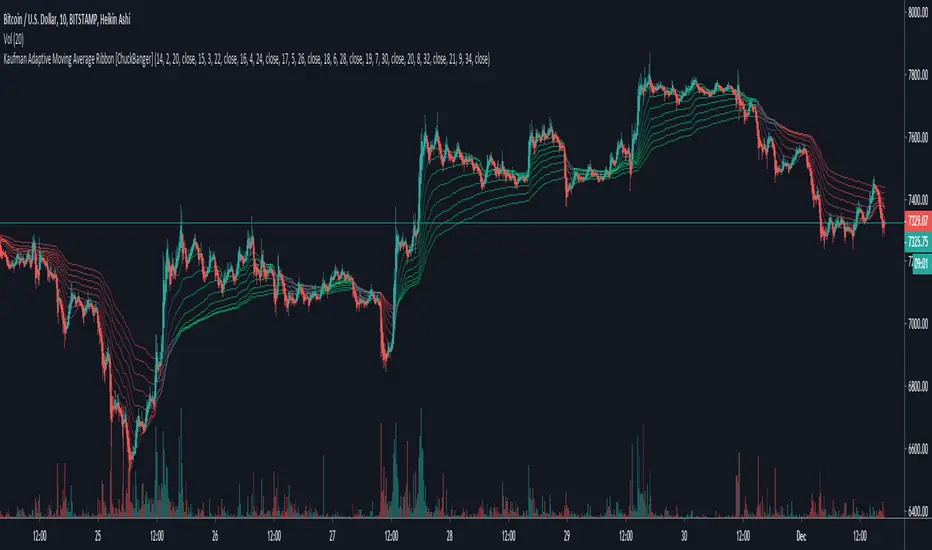
Kaufman Adaptive Moving Average Ribbon [ChuckBanger]Kaufman Adaptive Moving Average is one of the best moving averages in my opinion. So I made a ribbon script out of it. Good luck traders :)
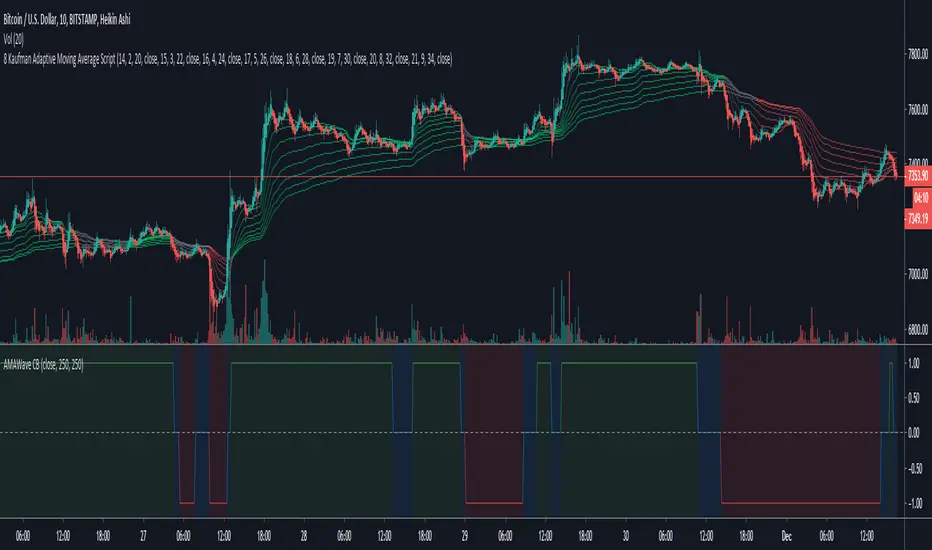
Kaufman AMA Binary Wave [ChuckBanger]This is Kaufman AMA Binary Wave with buy and sell zones. It’s pretty simple: when the line is over zero = buy zone, below zero = sell, at zero = neutral. You can experiment with the filter and length settings to suit your environment.
Ifish KAMA Kaufman’s Adaptive Moving Average (KAMA) was developed by American quantitative financial theorist, Perry J. Kaufman, in 1998. The technique began in 1972 but Kaufman officially presented it to the public much later, through his book, “Trading Systems and Methods.” Unlike other moving averages, Kaufman’s Adaptive Moving Average accounts not only for price action but also for Market Volatility.
When market volatility is low, Kaufman’s Adaptive Moving Average remains near the current market price, but when volatility increases, it will lag behind. What the KAMA indicator aims to do is filter out “market noise” – insignificant, temporary surges in price action. One of the primary weaknesses of traditional moving averages is that when used for trading signals, they tend to generate many false signals. The KAMA indicator seeks to lessen this tendency – generate fewer false signals – by not responding to short-term, insignificant price movements.
Traders generally use the moving average indicator to identify market trend and reversals.
When calculating Kaufman’s Adaptive Moving Average, the following standard settings are used:
10 – Number of periods for the Efficiency Ratio
2 – Number of periods for the fastest exponential moving average
30 – Number of periods for the slowest exponential moving average
One of the uses of Kaufman’s Adaptive Moving Average is to identify the general trend of current market price action. Basically, when the KAMA indicator line is moving lower, it indicates the existence of a downtrend. On the other hand, when the KAMA line is moving higher, it shows an uptrend. As compared to the regular MA.
the KAMA indicator is less likely to generate false signals that may cause a trader to incur losses.
Kaufman’s Adaptive Moving Average can also be used to spot the beginning of new trends and pinpoint trend reversal points. One way to do this is by plotting two KAMA lines on a chart – one with a more short-term moving average and another with a longer-term moving average. When a faster KAMA line crosses above a slower KAMA line, this indicates a change from a downtrend to an uptrend. The trader can take a long position and close the trade when the faster MA line crosses back to beneath the slower MA line. Trading signals can also be derived by the movement of market price in relation to Kaufman’s Adaptive Moving Average. If price crosses from below to above the KAMA line, that is a bullish (buy) signal. Conversely, price falling from above the KAMA line to below it is a bearish (sell) signal.
Kama will color flip automatically when cross happens.
green = bullish flip
red = bearish flip
Ma line by its self just great to find s/r levels.
the periods that I like to use as input, I prefer fib sequence numbers
ea: 3,13, 21, 34 etc.
For more info or trading concept check my profile.

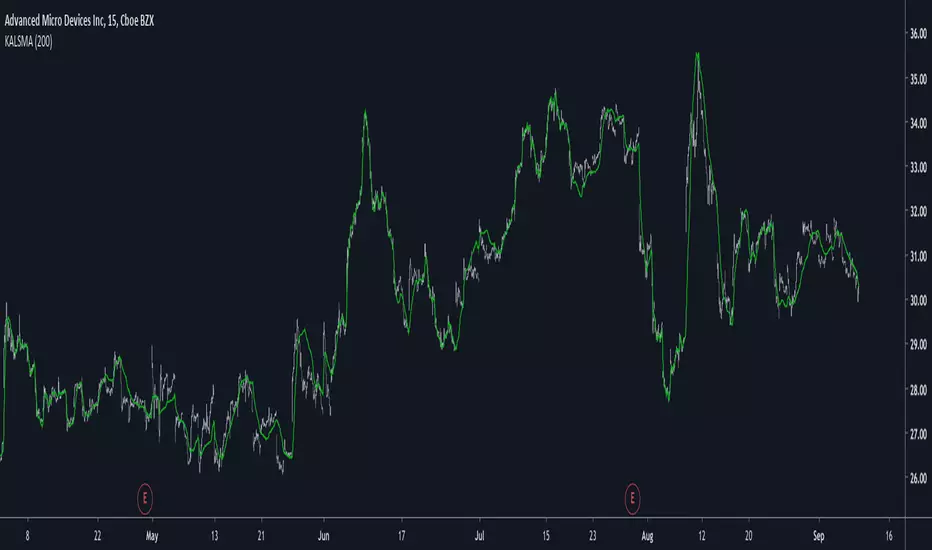
Kaufman Adaptive Least Squares Moving AverageIntroduction
It is possible to use a wide variety of filters for the estimation of a least squares moving average, one of the them being the Kaufman adaptive moving average (KAMA) which adapt to the market trend strength, by using KAMA in an lsma we therefore allow for an adaptive low lag filter which might provide a smarter way to remove noise while preserving reactivity.
The Indicator
The lsma aim to minimize the sum of the squared residuals, paired with KAMA we obtain a great adaptive solution for smoothing while conserving reactivity. Length control the period of the efficiency ratio used in KAMA, higher values of length allow for overall smoother results. The pre-filtering option allow for even smoother results by using KAMA as input instead of the raw price.
The proposed indicator without pre-filtering in green, a simple moving average in orange, and a lsma with all of them length = 200. The proposed filter allow for fast and precise crosses with the moving average while eliminating major whipsaws.
Same setup with the pre-filtering option, the result are overall smoother.
Conclusion
The provided code allow for the implementation of any filter instead of KAMA, try using your own filters. Thanks for reading :)
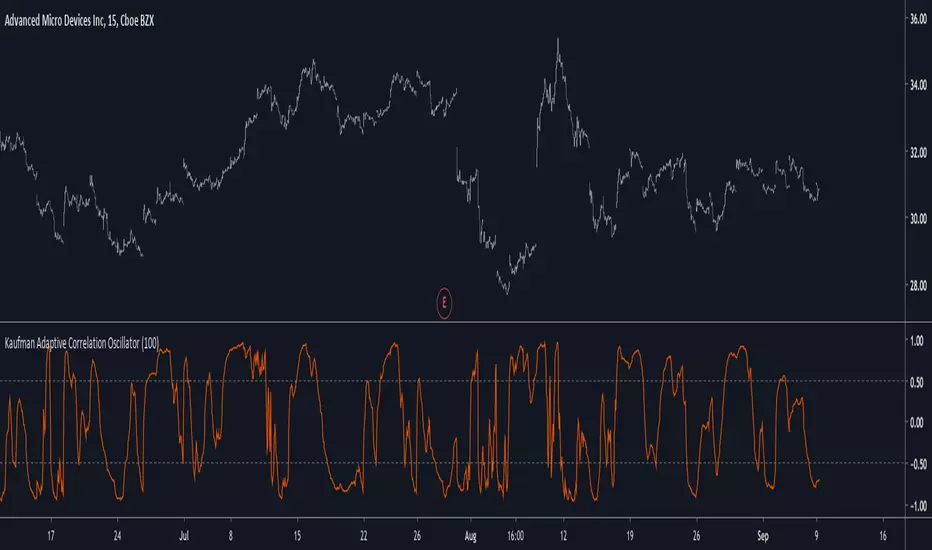
Kaufman Adaptive Correlation OscillatorIntroduction
The correlation oscillator is a technical indicator that measure the linear relationship between the market closing price and a simple increasing line, the indicator is in a (-1,1) range and rise when price is up-trending and fall when price is down-trending. Another characteristic of the indicator is its inherent smoothing which provide a noise free (to some extent) oscillator.
Such indicator use simple moving averages as well as estimates of the standard deviation for its calculation, but we can easily make it adaptive, this is why i propose this new technical indicator that create an adaptive correlation oscillator based on the Kaufman adaptive moving average.
The Indicator
The length parameter control the period window of the moving average, larger periods return smoother results while having a low kurtosis, which mean that values will remain around 1 or -1 a longer period of time. Pre-filtering apply a Kaufman adaptive moving average to the input, which allow for a smoother output.
No pre-filtering in orange, pre-filtering in yellow, period = 100 for both oscillators.
If you are not aware of the Kaufman adaptive moving average, such moving average return more reactive results when price is trending and smoother results when price is ranging, this also apply for the proposed indicator.
Conclusion
Classical correlation coefficients could use this approach, therefore the linear relationships between any variables could be measured. The fact that the indicator is adaptive add a certain potential, however such combination make the indicator have the drawback of kama + the correlation oscillator, which might appear at certain points.
Thanks for reading !
Adaptive ChannelThis indicator uses KAMA to adjust the length of a channel according to volatility.
A set up is generated when a candle closes below/above the mid point line; this is indicated via the background color.
Buy/sell on the break of the high/low of the signal candle.
Use the channel top/bottom as a stop (or a close above/below the mid pint line)

Powered Kaufman Adaptive Moving AverageIntroduction
The ability the Kaufman adaptive moving average (KAMA) has to be flat during ranging markets and close to the price during trending markets is what make this moving average one of the most useful in technical analysis. KAMA is calculated by using exponential averaging using the efficiency ratio (ER) as smoothing variable where 1 > ER > 0 . An increasing efficiency ratio indicate a trending market. Based on one of my latest indicator (see Kaufman Adaptive Bands) i propose this modified KAMA that allow to emphasis the abilities of KAMA by powering the efficiency ratio. I also added a new option that allow for even more adaptivity.
The Indicator
The indicator is a simple KAMA of period length that use a powered ER with exponent factor .
When factor = 1 the indicator is a simple KAMA, however when factor > 1 there can be more emphasis on the flattening effect of KAMA.
You can also restrain this effect by using 1 > factor > 0
Note that when the exponent is lower than 1 and greater than 0 you are basically applying a nth square root to the value, for example pow(2,0.5) = sqrt(2) because 1/0.5 = 2, in our case :
pow(ER,factor > 1) < ER and pow(ER,1 > factor > 0) > ER
Self Powered P-KAMA
When the self powered option is checked you are basically powering ER with the reciprocal of ER as exponent, however factor does no longer change anything. This can give interesting results since the exponent depend on the market trend strength.
In orange the self powered KAMA of period length = 50 and in blue a basic powered KAMA with a factor of 3 and a period of length = 50.
Conclusion
Applying basic math to indicators is always fun and easy to do, if you have adaptive moving averages using exponential averaging try powering your smoothing variable in order to see interesting results. I hope you like this indicator. Thanks for reading !

Options - Kaufman / LEAST SQUARES Moving AverageThis is a combo of multiple indicators :
1- three kama moving averages
2- one lsma moving average
3- a kama upper and lower band that you can set to use any of the three kama moving averages in the indicator as source
4- upper, lower and center bollinger bands price for last candle
The horizontal dot line is the bollinger and the horizontal arrowed lines are the bands for kama indicator.
The parameters are available for KAMA, LSMA and BB settings, the default settings are prefabricated for options trading.

Highly Optimized (Aroon, DMI, RWI)It is a highly optimized script for H4, D1. Backtests from (2016 - 2019, depending on the currency pair). Optimization still
going on.
Following alerts can be activated:
-
Buy-Signal (Baseline-Cross)!
Sell-Signal (Baseline-Cross)!
Buy Signal (Aroon)!
Sell Signal (Aroon)!
Buy Signal (DMI)!
Sell Signal (DMI)!
Buy Signal (RWI)!
Sell Signal (RWI)!
Can be used by the following pairs:
AUDCAD
AUDCHF
AUDJPY
AUDNZD
AUDSGD
AUDUSD
CADCHF
CADJPY
CHFJPY
CHFSGD
EURAUD
EURCAD
EURCHF
EURGBP
EURJPY
EURNZD
EURSGD
EURTRY
EURUSD
GBPAUD
GBPCAD
GBPCHF
GBPJPY
GBPNZD
GBPSGD
GBPUSD
NZDCAD
NZDCHF
NZDJPY
NZDUSD
SEKJPY
SGDJPY
USDCAD
USDCHF
USDCNH
USDJPY
USDSGD
USDTRY
XRPUSD
Price is 5€ per Month or 75€ lifetime. One week free for testing.

Kaufman Adaptive BandsIntroduction
Bands are quite efficient in technical analysis, they can provide support and resistance levels, provide breakouts points, trailing stop loss/take profits positions and can show the current market volatility to the user. Most of the time bands are made from a central tendency estimator like a moving average plus/minus a volatility indicator. Therefore bands can be made out of pretty much everything thus allowing for any kind of flavors.
So i propose a band indicator made from a Kaufman adaptive moving average using an estimate of the standard deviation.
Construction
The Kaufman moving average is an exponential averager using the efficiency ratio as smoothing variable, length control the period of kama and in order to provide more smoothness a power parameter has been introduced, higher values of power will return smoother results.
The volatility indicator is made from a biased estimation of the standard deviation by using the square root of the mean of the square minus the square of the mean method, except that we use kama instead of a mean.
The bands are made by adding/subtracting this volatility indicator with kama.
How To Use
The ability of the indicator to adapt to the current market state is what makes him a great tool for avoiding major exposition during ranging market, therefore the indicator will have a greater motion during trending market, or more simply the bands will move during trending markets while staying "flat" during ranging ones. Therefore the indicator might be more suited to breakouts, even if some cases will return what where turning points, this is particularly true during ranging markets.
Of course the efficiency ratio is not an "unbiased" trend metric indicator, it can consider high volatility markets as trending markets. Its one of his downsides.
High values of power will create smoother bands.
When using a low power parameter use an higher mult. In general using a low power value will make the bands move more freely as well as making them closer to each others.
Conclusion
At least the indicator is really nice to the eyes when using high power values, its ability to adapt to the market is a great addition to other more classical bands indicators, i also introduced a volatility estimator based on kama, some might have used the following estimation : kama(abs(price - kama)) which would have created a slower result. A trailing stop might be made from it if i see request about such addition.
If you are curious here are some more images of the indicator performing on different markets. Thanks for reading !
