Anchored Powered KAMA [LuxAlgo]The Anchored Powered KAMA tool is a new flavor of the famous Kaufman's Adaptive Moving Average (KAMA).
It adds 5 different anchoring periods, a power exponent to the original KAMA calculation to increase the degree of filtering during ranging trends, and standard deviation bands calculated against the KAMA itself.
🔶 USAGE
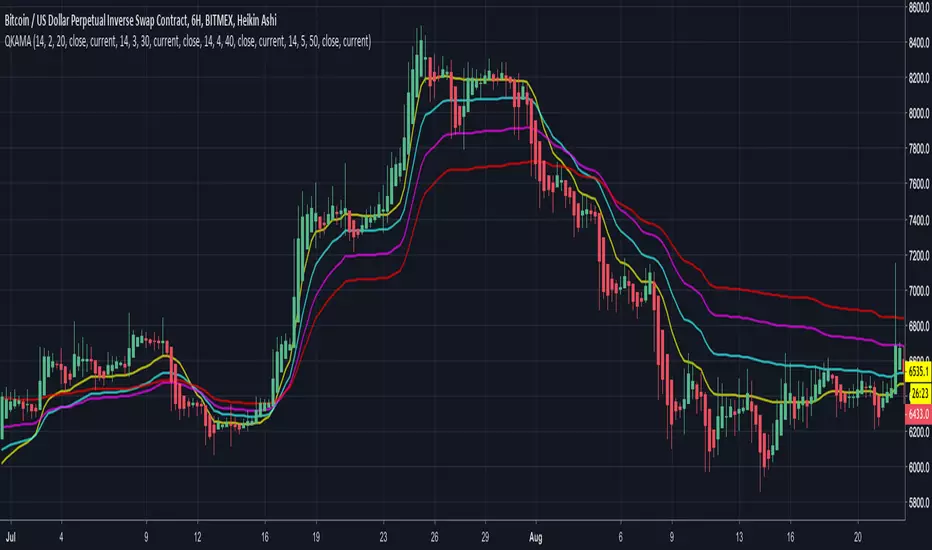
In the image above we can see the different parts of the tool, it displays the Anchored Powered KAMA surrounded by standard deviation bands at 2x (solid) and 1x (dashed) by default.
This tool provides a simple and easy way to determine if the current market is ranging or trending and where the market extremes are in the current period.
As a rule of thumb, traders may want to trade extremes in ranges and pullbacks in trends.
When the KAMA is flat, a range is in place, so traders may want to wait for the price to reach an extreme before opening a trade in the other direction.
Conversely, if the KAMA is moving up or down, a trend is in place and traders may want to wait for the price to pull back to the KAMA before opening a trade in the direction of the trend.
🔹 Anchor Period
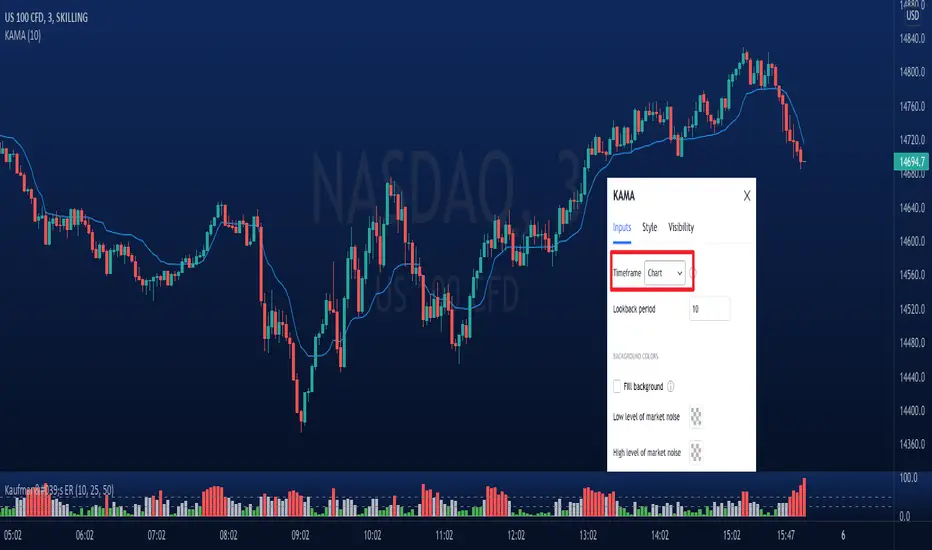
On the above chart, we can see different anchor periods on different chart timeframes.
This option is very useful for those traders who use multi-timeframe analysis, allowing them to see how the market behaves over different timeframes.
The valid values for this parameter are:
Hourly
Daily
Weekly
Monthly
Yearly
The tool has a built-in Auto feature for traders convenience, it automatically selects the optimal Anchor Period in function of the chart timeframe.
timeframes up to 2m: Hourly
timeframes up to 15m: Daily
timeframes up to 1H: Weekly
timeframes up to 4H: Monthly
larger timeframes: Yearly
🔹 Choosing the Right Anchor Period
In the chart above we can see the custom error message that the tool displays when the Auto feature is disabled and the Anchor Period is too large for the current chart timeframe.
Traders can select a smaller Anchor Period or a larger chart timeframe for the tool to display correctly.
🔶 DETAILS
The tool uses Welford's algorithm to calculate the KAMA's standard deviation, then plots the outer bands at the multiplier specified in the settings panel, and the inner bands at the multiplier specified minus 1.
🔹 Power Exponent
The graph above shows how different values of this parameter can affect the output.
To display the original KAMA a value of 1 must be set, by default this parameter is set to 2.
The higher the value, the better the tool's ability to detect ranges.
🔶 SETTINGS
Anchor Period: Select up to 5 different time periods from Hourly, Daily, Weekly, Monthly, and Yearly.
Source: Choose the source for all calculations.
Power Exponent: Fine-tune the KAMA calculation, a value of 1 will output the original KAMA, and is set to 2 by default.
Band Multiplier: Select the multiplier for the standard deviation bands.
Kaufman's Efficiency Ratio

Kaufman's Adaptive Moving Average (KAMA) - Multi timeframeKaufman's Adaptive Moving Average (KAMA)
KAMA was developed by Perry Kaufman to give better directions of short term market trends.
Idea is similar to an EMA, but it makes adjustments to the smoothing factor by taking Market Noise into consideration. Levels of noise in KAMA is modelled using Kaufman's Efficiency Ratio .
The problem with traditional of moving averages (ie. SMA/EMA) is that they are very sensitive to sudden price movements.
Applications:
- Less prone to false signals compared to other types of moving averages. When price suddenly surges or tanks, KAMA will lag behind telling us that the move is rather abnormal.
- On the other hand, when volatility of price movements is low, KAMA will be close to the ranging candles with a slope approximate to zero. KAMA can be used for filtering out choppy markets.
Other features:
- Multi-timeframe.
- Can visualize levels of market noise with background color mode turned on.
Kaufman's Efficiency Ratio IndicatorKaufman Efficiency Ratio ("ER")
This ratio was developed by a systematic trader by the name of Perry J. Kaufman.
Formula
The formula is:
= A divided by B ,
where:
A = Current closing price minus the closing price at the start of the lookback period
B = Sum of differences between closing prices (in absolute terms) of consecutive bars over the lookback period
Under default settings, closing price is used as source data, and the ER value is expressed in +ve/-ve signs (non-absolute), representing whether price had moved upward/downward over the period.
What this script does:
This script plots out ER and fills in the area beneath the curve with colors according to whether ER is classified as low/medium/high. There are two modes:
- Dynamic mode: low/medium/high is determined by ER value relative to it's mean +/- 'multiple' of standard deviation
- Static mode: low/medium/high is based on user defined thresholds
Applications:
- Can be used for identifying bullish moves in instances where price had already gone up steeply, but rests. If speculating that price will continually rise, then can enter during resting phase.
- Can be used to filter out choppy entry signals produced by existing trade strategies. If trying to enter during periods of consolidation, then ER should ideally be low. On the other hand, for mean reversion strategies, ER should be expected high.
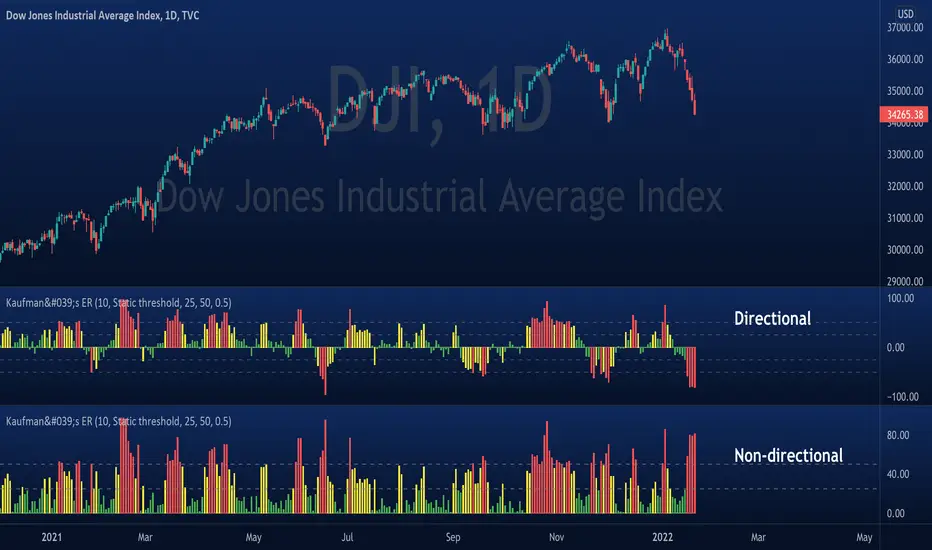
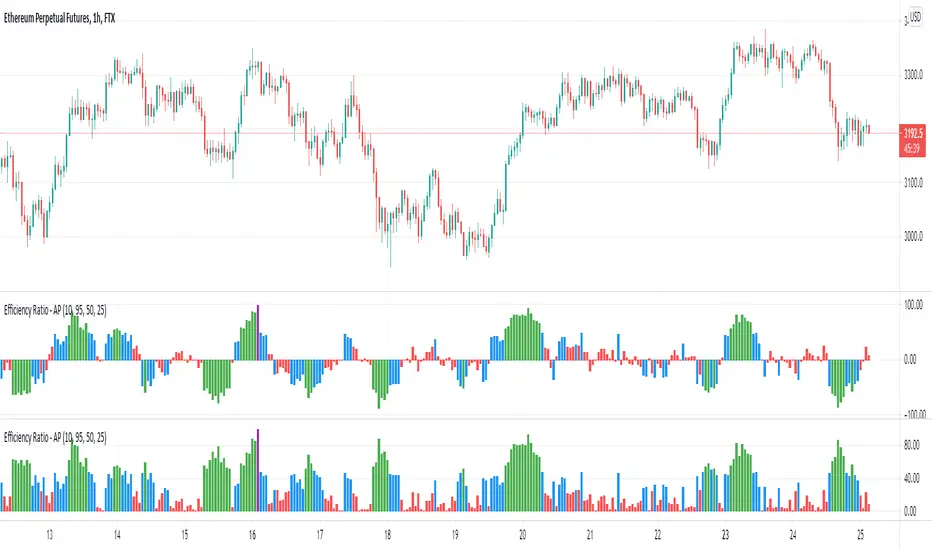
Efficiency Ratio (Market Noise) by Alejandro PThis is an indicator based on the Efficiency Ratio by Perry Kaufman. Like Price Density, which we have published previously, Perry Kaufman's Efficiency Ratio is a quantifiable method of measuring market noise.
This version of the indicator includes a feature to make the values of the indicator change based on thresholds to easier visualize different market conditions. Additionally there is a directional feature which factors in the direction of the price moves.
We can use the Efficiency Ratio to set rules and only trade particular systems when noise is at an appropriate level. For example, if noise is high then we would want to avoid trend following strategies and instead trade mean-reversion strategies, and vice-versa when the opposite is true.
The Efficiency Ratio can also be used to match assets to strategies. Some assets will be naturally more noisy than others and therefore we might have a principle where we only trade those noisy assets with our mean reversion strategies and the more quiet assets with trend following strategies.
Calculation:
Efficiency Ratio = Absolute net change in close price / absolute sum of the individual close price changes
The numerator looks at the absolute close change in price. It subtracts the starting close price in the period from the final close price in the period. The denominator compares the close price of one bar to the close price of the previous bar, this is performed for each of the successive bars in the whole period and then the value is summed. The absolute price is used because there are positive and negative values because each bar may close above or below the previous bar close.
The Efficiency Ratio provides an opposite interpretation of market noise compared to Price Density. With Price Density high values = high noise and low values = low noise. With the Efficiency Ratio high values = low noise and low values = high noise.
Comparing Price Density to Perry Kaufman's Efficiency Ratio:
Similarities
Both use the sum of the individual bar moves
- Price Density - High - Low
- Efficiency Ratio - Close to Close
Differences
Price Density uses the full price range (to determine the height of the box)
Efficiency Ratio uses the net close price change over the period
The interpretation of the values is the reverse for each
Full credits to the source of the above information and interpretation.
RedK Volume-Weighted Directional Efficiency Index (DXF)RedK Volume-Weighted Directional Efficiency Index (DXF) is a momentum indicator - that builds on Kaufman's Efficiency Ratio (ER) concept.
DXF utilizes a restricted +100/-100 oscillator to represent the "quality" of a trend, and does a good job in detecting the possibility of an upcoming trend change (in both direction and quality), improving our ability to make decisions on trade entries and exits.
Here's a quick background on Kaufman's Efficiency Ratio (ER)
------------------------------------------------------------------------------- Copied from internet sources -----------------------------
Developed by Perry Kaufman and introduced in his book “New Trading Systems and Methods”, the Efficiency Ratio reflects relative market speed to volatility. There are cases, when it is used as a filter, which helps a trader to avoid ”choppy” markets or trading ranges and to identify smoother trends.
ER is the result of dividing the net change in price movement during n-periods by the sum of all bar-to-bar price changes during the same n-periods. In case the market is trending smoother, then the ratio will be higher. In case the ratio shows readings in proximity to zero, this implies that market movement is inefficient and ”choppy”.
If the Efficiency Ratio shows a reading of +100, this means that the trading instrument is in a bull trend and trending with perfect efficiency.
If the Efficiency Ratio shows a reading of -100, this means that the trading instrument is in a bear trend and trending with perfect efficiency.
It is impossible for any instrument to have a perfect Efficiency ratio, because any movement against the major trend during the examined period of time would cause the ratio to drop.
If the Efficiency Ratio shows a reading above +30 (common setting for the "Significant Level"), this is indicative of a quality bull trend. If the ratio shows a reading below -30, this is indicative of a quality bear trend.
------------------------------------------------------------------------------- End of Copy -------------------------------------------------------------------------------------------------------
Kaufman also used the ER as basis for his famous Kaufman Adaptive Moving Average (KAMA).
Read more on ER & Kama here
How is DXF different from other ER-based indicators?
------------------------------------------------------------------
- Let's get the easy part out of the way: DXF has a "volume-weighting" option ✔
This option is OFF by default (to avoid errors with instruments with no volume data)
- once this option is applied, it provides the benefit of combining the volume effect into the calculation - those who appreciate the effect of volume on price action will hopefully find this option valuable
- The calculation of ER and how it can be "best utilized":
Let's examine the ER concept a bit closer: as a (math) concept, the (original) Efficiency Ratio (ER) takes the positive change of the price of an instrument during a certain period, and divide it by the sum of (absolute) price moves that were observed during that same period.
So, in the trader's language, we will be saying "out of a total of $20 moves (up and down) that MSFT did in the past 10 days, MSFT only made a net change of $5 up during that period" - so the "10-day ER" for MSFT in that case is 5/20 = 25% -- then we continue to observe that ongoing "10-day ER" and if it increases, we can expect that MSFT is going to establish a strong move (trend) up --- right?
the magic word here is to "observe the ongoing ER" - many of the ER based indicators just use the ER as calculated by Kaufman's original method. IMHO, these are just "point-in-time readings" - if we hope to get real insights from the ER, we need to take an average of that reading - for our "time window" we're interested in - and only then we can identify trends and patterns in the ER value as it changes during that windowss- DXF does that - and that allows a trader to say "the (weighted) 5-day average of the 10-day ER for MSFT is increasing, and that why i expect an up-trend" -- makes sense ? both the "Lookback" used to calculate the ER, and the Length of observed "window" for the Average ER are adjustable in DXF settings
Other Uses and Settings :
---------------------------------
- As a momentum indicator, DXF can predict an upcoming change of trend - cause that will reflect on the average ER value. There are few examples in the chart where the price move and ER trend *do not agree* - The trader can see these signs and take decisions accordingly
- DXF can help reveal best entries and exits: assume we are long-term bullish on MSFT, and we want to "buy the dip" - DXF can help reveal the time where price is recovering from extreme weakness - and that would be the ideal buy opportunities for us - exampled marked on the chart
- the Stepping & Smoothing options enable better visualization of the DXF plot. the "raw" DXF is still shown as a silver line.
- The "Significant Levels" option is available and is set to -20/+20 by default .. also adjustable in indicator settings.
- Please use DXF in combination with other trend and volume indicators, and with thorough chart / price action analysis and not in isolation to ensure you get proper signal confirmation for trades. In the chart above, you can see DXF combined with a moving average that can act as a filter and to confirm the price moves.
---------------------------------------------------
As usual, feedback & comments are welcome - if you find this work useful in your trading arsenal, please share a comment - i would be more than happy to learn about that. Good luck!

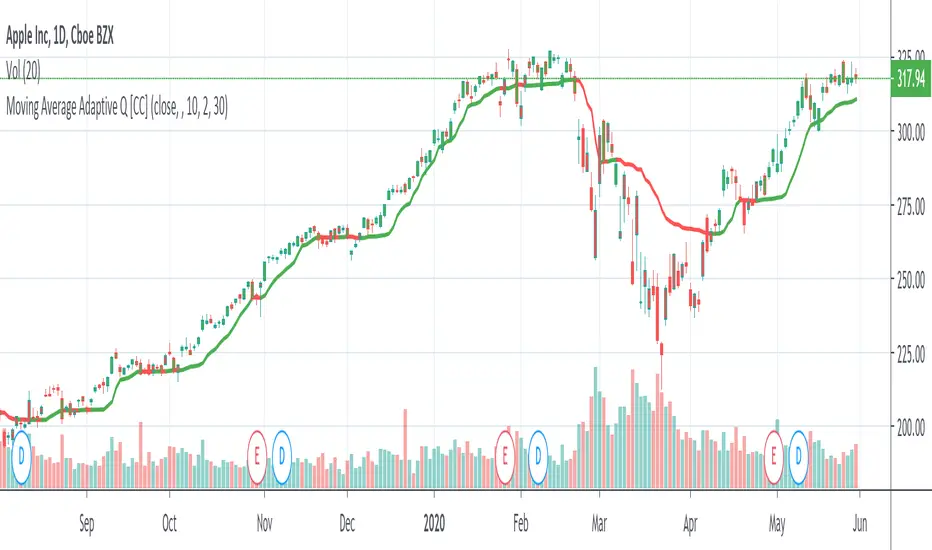
Moving Average Adaptive QThe Moving Average Adaptive Q (MAAQ) was authored by Perry Kaufman in the Stocks and Commodities Magazine 06/1995
This is similar to his Kaufman Adaptive Moving Average with a few changes. This is a pretty close moving average which I like quite a bit. Try it and let me know what you think.
Send me a message and let me know what other indicators you would like to see!
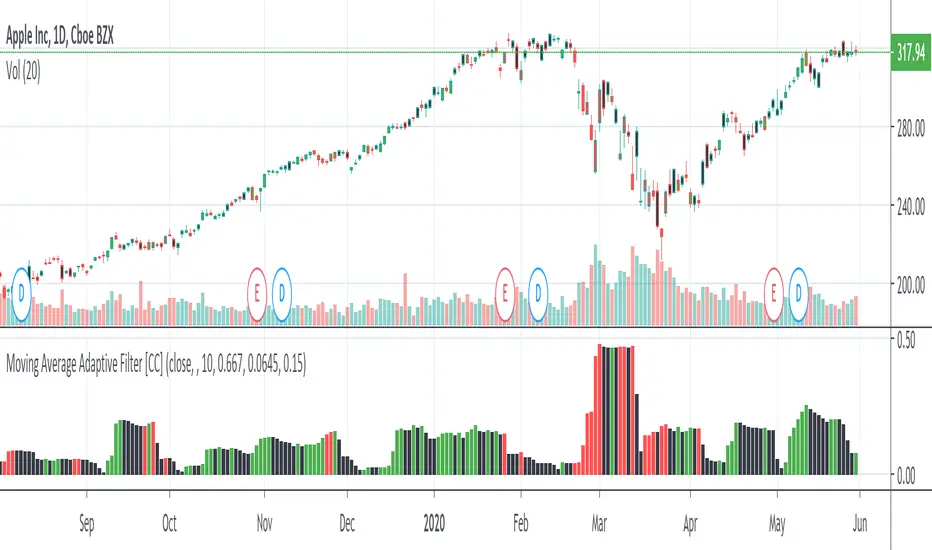
Moving Average Adaptive FilterThe Moving Avg Adaptive Filter (MAAF) was authored by Perry Kaufman in the Stocks and Commodities Magazine 03/1998
This is a volatility based indicator so when this indicator goes up, sell in the direction of how that stock is going. In other words go short when it is rising and the stock price is below the ema or go long when it is rising and the stock price is above the ema. Lower volatility means it is trading sideways or the current price action is about to reverse.
Send me a message and let me know what other indicators you would like to see!
Powered Kaufman Adaptive Moving AverageIntroduction
The ability the Kaufman adaptive moving average (KAMA) has to be flat during ranging markets and close to the price during trending markets is what make this moving average one of the most useful in technical analysis. KAMA is calculated by using exponential averaging using the efficiency ratio (ER) as smoothing variable where 1 > ER > 0 . An increasing efficiency ratio indicate a trending market. Based on one of my latest indicator (see Kaufman Adaptive Bands) i propose this modified KAMA that allow to emphasis the abilities of KAMA by powering the efficiency ratio. I also added a new option that allow for even more adaptivity.
The Indicator
The indicator is a simple KAMA of period length that use a powered ER with exponent factor .
When factor = 1 the indicator is a simple KAMA, however when factor > 1 there can be more emphasis on the flattening effect of KAMA.
You can also restrain this effect by using 1 > factor > 0
Note that when the exponent is lower than 1 and greater than 0 you are basically applying a nth square root to the value, for example pow(2,0.5) = sqrt(2) because 1/0.5 = 2, in our case :
pow(ER,factor > 1) < ER and pow(ER,1 > factor > 0) > ER
Self Powered P-KAMA
When the self powered option is checked you are basically powering ER with the reciprocal of ER as exponent, however factor does no longer change anything. This can give interesting results since the exponent depend on the market trend strength.
In orange the self powered KAMA of period length = 50 and in blue a basic powered KAMA with a factor of 3 and a period of length = 50.
Conclusion
Applying basic math to indicators is always fun and easy to do, if you have adaptive moving averages using exponential averaging try powering your smoothing variable in order to see interesting results. I hope you like this indicator. Thanks for reading !

Kaufman Adaptive Moving AverageKaufman Adaptive Moving Average script.
This indicator was originally developed by Perry J. Kaufman (`Smarter Trading: Improving Performance in Changing Markets`, 1995).

Quadruple Kaufman Adaptive Moving AverageFour Kaufman Adaptive Moving Averages in one script. Useful for identifying trends and setting points to add to positions / exit trades. KAMA's are great for keeping you in trending markets and avoiding sideways chops and ranges. Try them out by tweaking the fast/slow ma's and lengths to get the right set for your charts that removes the thinking about whether to be long or short and when to add to positions.
A suggested trading strategy is to tweak the ma's (often you'll want larger values) until they span the price action well on past trends. Then each time price action closes and crosses one of your KAMA lines is an opportunity to add to your position. Once all lines are cleared and you've loaded up your position, hopefully your average price of entry falls short of the highest KAMA line's value. Once this happens you don't need to get out the trade until such time as a price close crosses again that largest KAMA line. For eager profit takers, close positions once any KAMA line is crossed once you're successfully loaded up on a direction.
I use this script with a renko chart and values -> 26 length 6 fast ma 100 slow ma, 26 8 100, 26 10 100, 26 12 100 and it's good to see these moving averages, unlike regular moving averages, bend around choppy action that come when trends pause, keeping me successfully in winning trades. Give it a try.