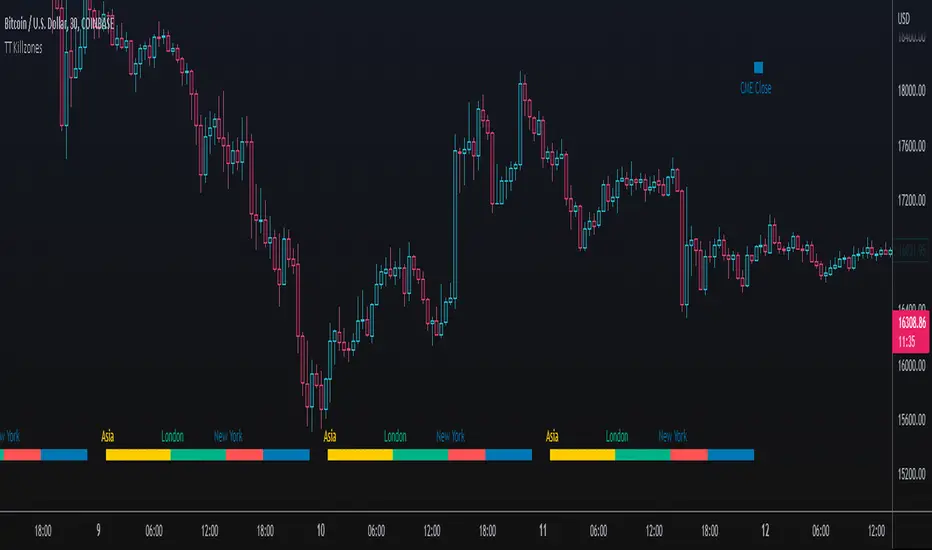
TT KillzonesThis indicator plots the 3 main trading zones : Asia, London, New York
Its is also possible to use a different color for the "High Trading Volume" timezone. It can be adjusted. Default is the overlapping time of London and New York Killzone
It also plots the CME open / close
This indocator can be used as example / copy for your own project!
Have fun!
Killzone
Mark SessionsDisplays trading sessions in a very flexible way.
The main intention of this indicator is to give a way to display market sessions with your own style preferences and expectations and achieve cleanness of your chart.
This indicator allows to show up to 6 sessions plus day session. Time range of the sessions are set in timezone you choose. Mostly all settings can be set in one place and be inherited by all sessions. And of course after settings inheritage you still have a way to make session setting exceptions without changing others.
You can adjust any borders of the session to show, background to show, adjust labels attachment target and their alignments, change the color of sessions, and line styles. All of those settings can turn session picture in any presentation you like.
Enjoy and I'm open to hear your advices

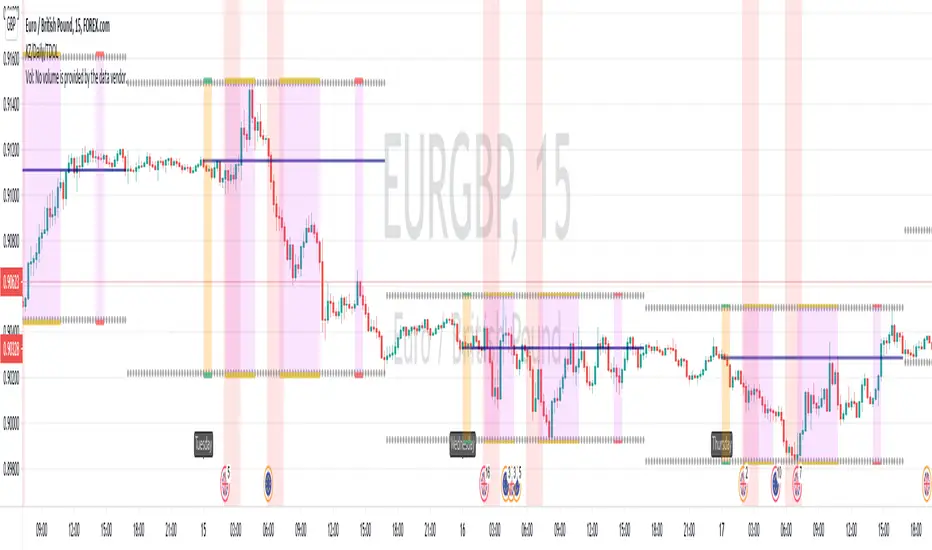
ICT Killzone [Forex Edition]This indicator show in different way the bank session teached by ICT in his channel (Asian Range, London Open, New York Open, London Close).
The user have the opportunity to change the visualization from a beacon to a box, and is possible to show the amount of pips of box range with the "info" check.
If something isn't clear comment below and I will answer as soon as possible.

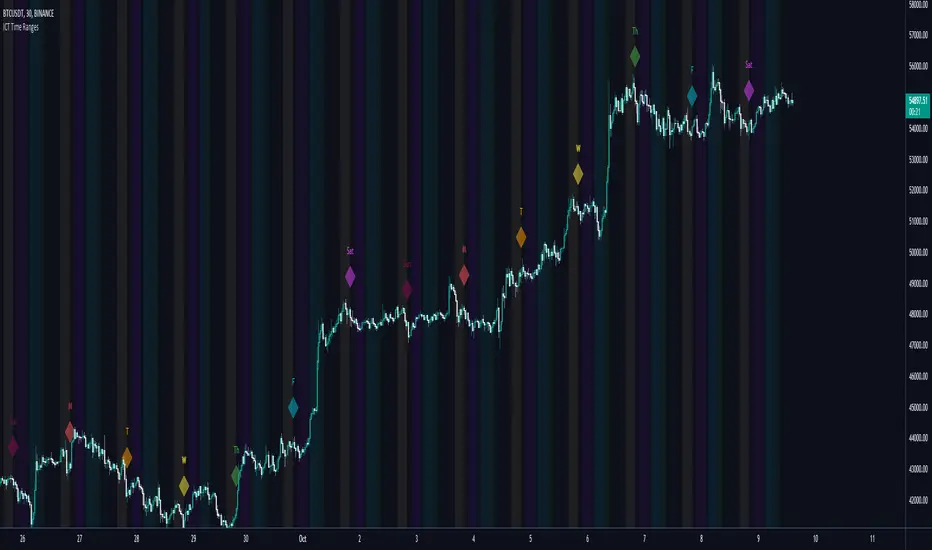
ICT Time RangesICT Time Ranges is a concept around the fact that price likes to show volatility spikes in certain times of the day.
Although there are many other scripts such as that revolve around this concept, the difference between this one and some of the others out there is the fact that this code specifically focuses on the ranges like New York, London, Asia, and ICTs concept behind having a "True Day Range". Also, prior scripts draw horizontal lines to delineate the High and Low of the Day. Although this is useful in some cases, I find it to clutter up the chart too much for my liking, so this script negates any of that and simply prints a box in the parameters given within the settings pop-up. This also allows you the fact of having a shape and letter(s) marker for when a new day starts at 0:00.
With this script, you can enable / disable times of the day for:
- London Session
- New York Session
- London Close Session
- Asia Session
- "IPDA" True Day
You can also change the times that these sessions will update to, along with the opacity and color that they print to mark out these times / ranges. The same can be said with the "Day of Week" markers, which can be color coded and show different shapes / formats to your liking.
I find that putting the Session boxes opacity to 7-8% and the day of week markers to 20% is best as this makes them visible enough to see while also keeping it easy on your eyes to analyze your charts.
Overall, this script was based around specific concepts I liked from other individuals' scripts such as @BryceWH and @AvniPiro , but that are tweaked to what I personally find as most beneficial. To see others scripts like this one, you can search for "ICT Killzones" in the public script library!
Sessions (Nephew_Sam_)Indicator combines the 3;
1. 3 Sessions - with an option to set your own times
2. 4 Killzones- with an option to set your own times
3. Daily Dividers
If you dont want any of the the above or want to decrease your killzones, just uncheck the relevant checkbox under settings - inputs/colors.
Note: Most of this code it taken from other open source scripts, therefore I will leave this as an open source code too.

KILLZONE/DAILY BY jahjahblessedThis is the Killzone Zone market open London kill Zone, New York Kill Zone and Kill Zone Close, it also includes the Days of the, for the Snipers taking your shot with time and price.
KZ SessionsThis shows killzone sessions for London NY, Asia sessions.
In addition to the opening hours of session, the pre-market and closing time periods are also marked with a grey color
Generally these are consided period of high activity and can experience more volatility in these periods
I also have enabled it to display the session times even on weekends. There is no session open at such times but heightened activity is noticed in these periods even on weekends.
If want to disable showing it on weekends, then remove ":1234567" from all the lines in code

ICT Killzone For Crypto Markets.Adjusted for Crypto 24/7 markets
Adjusted for UTC
i have hidden the asian open range and daily bars on my charts , you can choose to have them on
Less screen clutter
London Open 8:00 - 4:30 - Killzone 7:00 - 9:00
NewYork Open 9:30 - 4:00 Killzone 8:00 - 10:00
Shanghai open 9:15 Killzone 8:00 - 10:00
NOT MY ORIGINAL SCRIPT. JUST MODIFIED VERSION

How To Show Vertical LinesExample of various methods to show dashed or solid vertical lines on chart based on using either session or time.
Credit for line method goes to midtownsk8rguy ->
Credit for plot method goes to PineCoders -> www.pinecoders.com
Special thanks to LucF, midtownsk8rguy, and PineCoders for permission to use their work.
NOTICE: This is an example script and not meant to be used as an actual strategy. By using this script or any portion thereof, you acknowledge that you have read and understood that this is for research purposes only and I am not responsible for any financial losses you may incur by using this script!

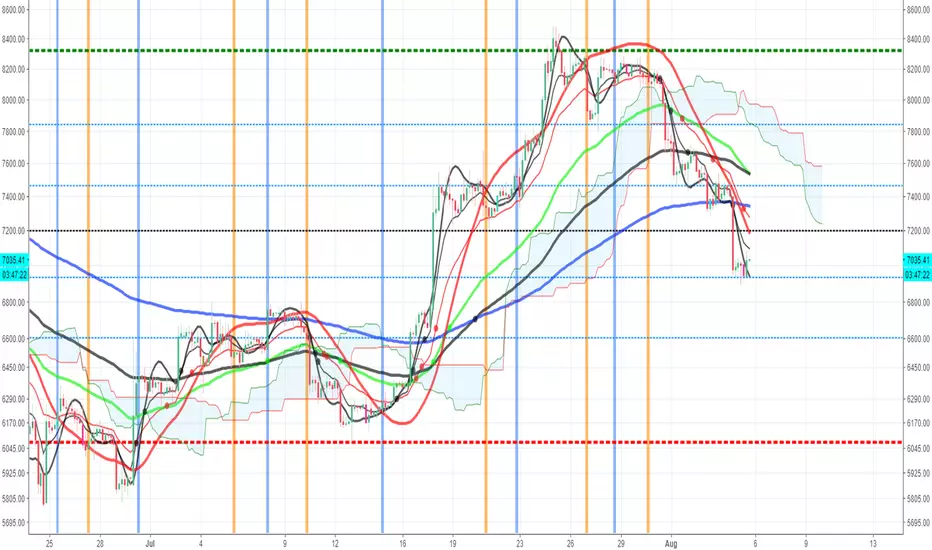
Trading ComboThis is a combo of many indicators including :
Ichimoku Cloud(With Buy and Sell Signals)
EMA
MA
HULL MA
Fibonacci Lines
Bitcoin Kill Zones(Turned off by Default)
MA Turning Points
Reversal(Pin) Bars and Upshaved and Downshaved Bars(Inside and Outside Bars Disabled By default)
Credits to for the source code:
Lazybear
ChrisMoody
100kiwi
Gesundheit
Bitcoin Kill Zones v2.1All I've changed in it from previous version is increased transparency. Makes it easier to observe now imo.

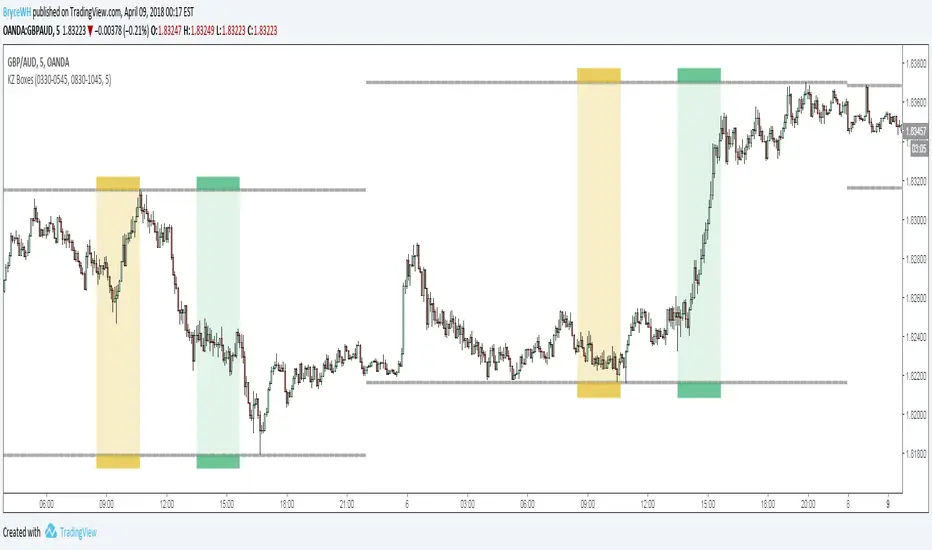
ICT Killzone Boxes
Plots London Open Killzone and New York Open Killzone as overlay boxes using current daily high / lows. Boxes verticle location will move as days range / high and low widens.
Middle fills can be turned on and off. Created this indicator because i didnt like highlighting the whole chart background as seen in other ICT Killzone indicators on tradingview and wanted something visually clearer.
If you want additional killzones such as london close / new york close, add the indicator to the chart twice.
Boxes height can be changed. Positive number puts the box outside current days high and low, negative number puts box inside current days high and low.
Adapted from Chris Moody's original indicator HLOC
Sorry for my ugly code. Presented as is - feel free to tweak / modify and change.
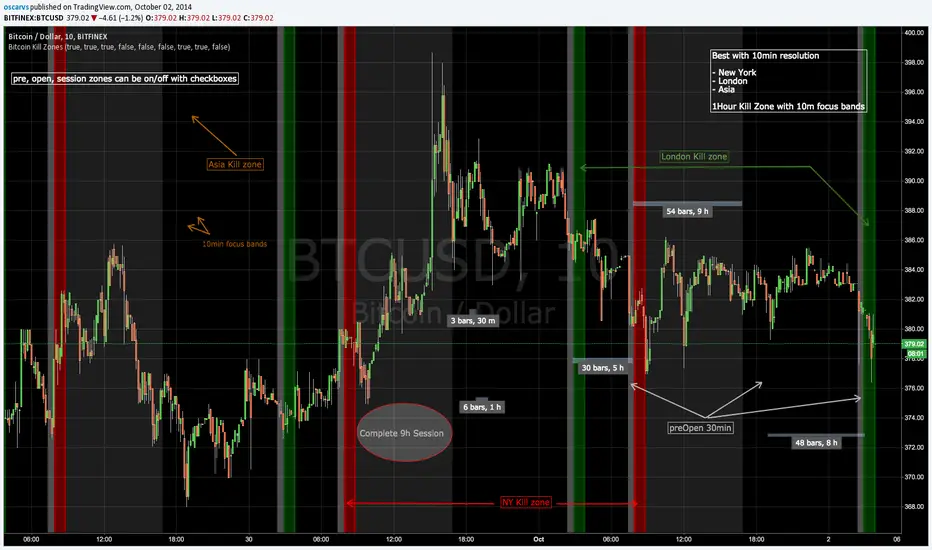
Bitcoin Kill ZonesGRAB THE LASTEST VERSION HERE:
*********************
This indicator shows when the candle is entering New York, London or Asia Kill Zone (open market).
gray: 30min before market opens.
red, green, orange: First 1 hour with 10min focus bands.
silver: complete 30min session market until close.
FIX NOTE:
Set this hours for Asia to fix the 1 hour difference:
2330-0000
0000-0010
0010-0050
0050-0100
0100-0900
* this is beta, in planning to mark dynamically ranges before/after open/close session and use some Fibs to have some ripple effect indicator
Updated code: github.com