Leavitt Convolution ProbabilityTechnical Analysis of Markets with Leavitt Market Projections and Associated Convolution Probability
The aim of this study is to present an innovative approach to market analysis based on the research "Leavitt Market Projections." This technical tool combines one indicator and a probability function to enhance the accuracy and speed of market forecasts.
Key Features
Advanced Indicators : the script includes the Convolution line and a probability oscillator, designed to anticipate market changes. These indicators provide timely signals and offer a clear view of price dynamics.
Convolution Probability Function : The Convolution Probability (CP) is a key element of the script. A significant increase in this probability often precedes a market decline, while a decrease in probability can signal a bullish move. The Convolution Probability Function:
At each bar, i, the linear regression routine finds the two parameters for the straight line: y=mix+bi.
Standard deviations can be calculated from the sequence of slopes, {mi}, and intercepts, {bi}.
Each standard deviation has a corresponding probability.
Their adjusted product is the Convolution Probability, CP. The construction of the Convolution Probability is straightforward. The adjusted product is the probability of one times 1− the probability of the other.
Customizable Settings : Users can define oversold and overbought levels, as well as set an offset for the linear regression calculation. These options allow for tailoring the script to individual trading strategies and market conditions.
Statistical Analysis : Each analyzed bar generates regression parameters that allow for the calculation of standard deviations and associated probabilities, providing an in-depth view of market dynamics.
The results from applying this technical tool show increased accuracy and speed in market forecasts. The combination of Convolution indicator and the probability function enables the identification of turning points and the anticipation of market changes.
Additional information:
Leavitt, in his study, considers the SPY chart.
When the Convolution Probability (CP) is high, it indicates that the probability P1 (related to the slope) is high, and conversely, when CP is low, P1 is low and P2 is high.
For the calculation of probability, an approximate formula of the Cumulative Distribution Function (CDF) has been used, which is given by: CDF(x)=21(1+erf(σ2x−μ)) where μ is the mean and σ is the standard deviation.
For the calculation of probability, the formula used in this script is: 0.5 * (1 + (math.sign(zSlope) * math.sqrt(1 - math.exp(-0.5 * zSlope * zSlope))))
Conclusions
This study presents the approach to market analysis based on the research "Leavitt Market Projections." The script combines Convolution indicator and a Probability function to provide more precise trading signals. The results demonstrate greater accuracy and speed in market forecasts, making this technical tool a valuable asset for market participants.
Leavitt

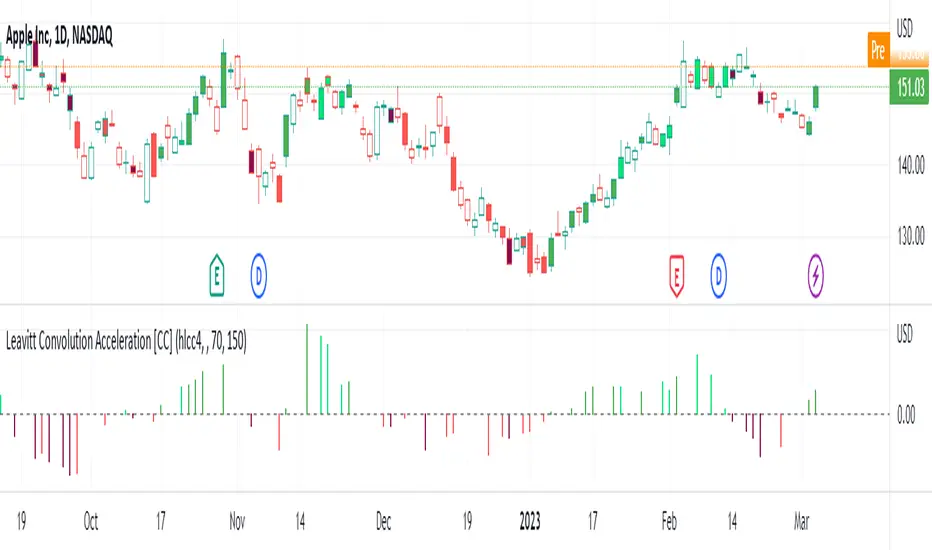
Leavitt Convolution Acceleration [CC]The Leavitt Convolution Slope indicator was created by Jay Leavitt (Stocks and Commodities Oct 2019, page 11), who is most well-known for creating the Volume-Weighted Average Price indicator. This indicator didn't have a good explanation or description so I custom-coded most of it. The way it works is it will give trend spikes in the direction of the underlying trend. If you don't see a spike then it means that the stock isn't trending at the moment. One possible avenue to explore with this indicator is judging the size of the trend spike before you open a position in that direction (or the opposite direction if you are shorting). I added a normalization function using code from a good friend @loxx that I recommend leaving on but feel free to experiment with it. I have color coded the lines to turn light green for a standard buy signal or dark green for a strong buy signal and light red for a standard sell signal, and dark red for a strong sell signal.
This is another indicator in a series that I'm publishing to fulfill a special request from @ashok1961 so let me know if you ever have any special requests for me.
Leavitt Convolution Slope [CC]The Leavitt Convolution Slope indicator was created by Jay Leavitt (Stocks and Commodities Oct 2019, page 11), who is most well known for creating the Volume-Weighted Average Price indicator. This indicator is very similar to the Leavitt Convolution indicator but the big difference is that it is getting the slope instead of predicting the next Convolution value. I changed quite a few things from the original source code so let me know if you like these changes. I added a normalization function using code from a good friend @loxx that I recommend to leave on but feel free to experiment with it. Last but not least, the unsure levels are essentially acting as a buy or sell threshold. I personally recommend to buy or sell for zero crossovers but another option would be to buy or sell for crossovers using the unsure levels. I have color coded the lines to turn light green for a normal buy signal or dark green for a strong buy signal and light red for a normal sell signal, and dark red for a strong sell signal.
This is another indicator in a series that I'm publishing to fulfill a special request from @ashok1961 so let me know if you ever have any special requests for me.

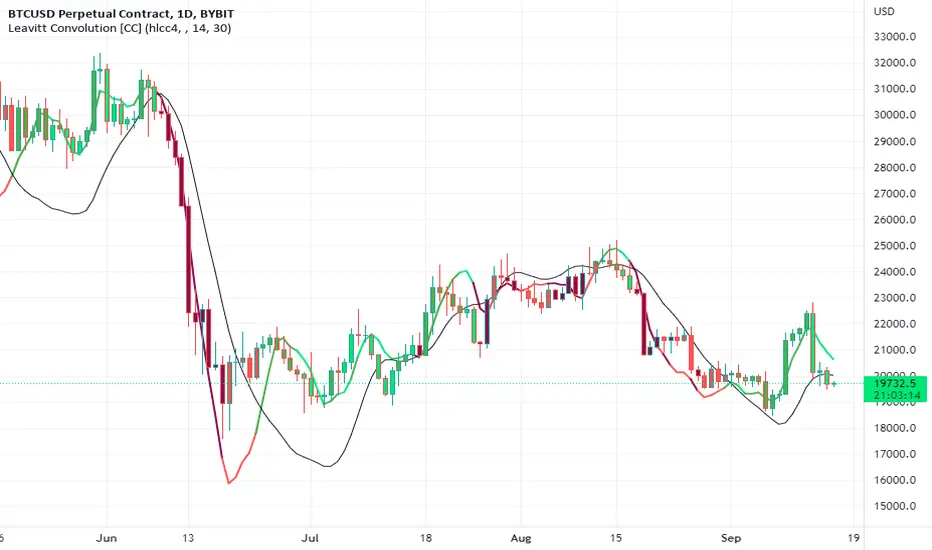
Leavitt Convolution [CC]The Leavitt Convolution indicator was created by Jay Leavitt (Stocks and Commodities Oct 2019, page 11), who is most well known for creating the Volume-Weighted Average Price indicator. This indicator is very similar to my Leavitt Projection script and I forgot to mention that both of these indicators are actually predictive moving averages. The Leavitt Convolution indicator doubles down on this idea by creating a prediction of the Leavitt Projection which is another prediction for the next bar. Obviously this means that it isn't always correct in its predictions but it does a very good job at predicting big trend changes before they happen. The recommended strategy for how to trade with these indicators is to plot a fast version and a slow version and go long when the fast version crosses over the slow version or to go short when the fast version crosses under the slow version. I have color coded the lines to turn light green for a normal buy signal or dark green for a strong buy signal and light red for a normal sell signal, and dark red for a strong sell signal.
This is another indicator in a series that I'm publishing to fulfill a special request from @ashok1961 so let me know if you ever have any special requests for me.
Leavitt Projection [CC]The Leavitt Projection indicator was created by Jay Leavitt (Stocks and Commodities Oct 2019, page 11), who is most well known for creating the Volume-Weighted Average Price indicator. This indicator is very simple but is also the building block of many other indicators, so I'm starting with the publication of this one. Since this is the first in a series I will be publishing, keep in mind that the concepts introduced in this script will be the same across the entire series. The recommended strategy for how to trade with these indicators is to plot a fast version and a slow version and go long when the fast version crosses over the slow version or to go short when the fast version crosses under the slow version. I have color coded the lines to turn light green for a normal buy signal or dark green for a strong buy signal and light red for a normal sell signal, and dark red for a strong sell signal.
I know many of you have wondered where I have been, and my personal life has become super hectic. I was recently hired full-time by TradingView, and my wife is pregnant with twins, and she is due in a few months. I will do my absolute best to get back to posting scripts regularly, but I will post a bunch today in the meantime to fulfill a special request from one of my loyal followers (@ashok1961).

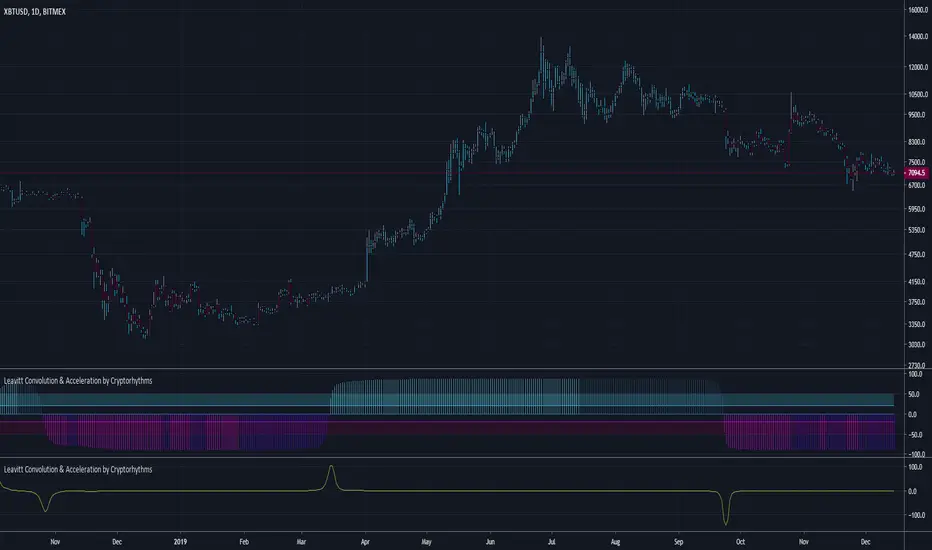
Leavitt Convolution & Acceleration by CryptorhythmsLeavitt Projection, Convolution, & Acceleration by Cryptorhythms
Intro
Bringing you another open source Gem this time from the January 2020 Issue of TASC.
Description
In the article in the Oct 2019 TASC issue titled "An interplanetary marriage" author Jay Leavitt describes the evolution process required in strategy design by introducing his Mars strategy. This grew out of concepts presented in his earlier TASC articles such as the stratosphere, moon rocket, and tech emini strategies. This dual indicator uses a linear regression of price data to help derive slope and acceleration information, in turn helping him to identify trends and trend turning points.
Additions
As usual a few useful extras are included such as a rudimentary signaling system, bar coloration by trade state, overbought/oversold areas to assist in algorithmic setups, and more!
👍 We hope you enjoyed this indicator and find it useful! We post free crypto analysis, strategies and indicators regularly. This is our 71st script on Tradingview!
💬Check my Signature for other information
Leavitt Convolutions Multicator - Jay Leavitt, Ph.D.Hot off the press, I present this next generation "Leavitt Convolutions Multicator" employing PSv4.0, originally formulated by Jay Leavitt, Ph.D. for TASC - January 2020 Traders Tips. Basically it's an all-in-one combination of three Leavitt indicators. This triplet indicator, being less than a 60 line implementation at initial release, is a heavily modified version of the original indicator using novel techniques, surpassing Leavitt's original intended design.
Utilizing the "Power of Pine", I included the maximum amount of features I could surmise in an ultra small yet powerful package. Configurations are displayed above in multiple scenarios that should be suitable for most traders.
Features List Includes:
Dark Background - Easily disabled in indicator Settings->Style for "Light" charts or with Pine commenting
AND much, much more... You have the source!
For those of you who are new to Pine Script, this script may also help you understand advanced programming techniques in Pine and how they may be utilized in a most effective manner. Most notably, the script shows how to potentially combine three indicators in one with Pine. This is commonly what my dense intricate code looks like behind the veil, and if you are wondering why there is no notes, that's because the notation is in the variable naming.
The comments section below is solely just for commenting and other remarks, ideas, compliments, etc... regarding only this indicator, not others. When available time provides itself, I will consider your inquiries, thoughts, and concepts presented below in the comments section, should you have any questions or comments regarding this indicator. When my indicators achieve more prevalent use by TV members, I may implement more ideas when they present themselves as worthy additions. As always, "Like" it if you simply just like it with a proper thumbs up, and also return to my scripts list occasionally for additional postings. Have a profitable future everyone!
