Liquidation Reversal Signals [AlgoAlpha]🟠 OVERVIEW
This tool detects potential liquidation-driven reversals by combining z-score analysis of up/down volume with the classic Supertrend. It watches for abnormal surges in directional volume (on a lower timeframe) and links them to trend flips on the main chart. When both align within a short window, it flags a probable reversal caused by forced liquidations. The goal is to help traders identify exhaustion points where aggressive liquidation moves may mark the end of a trend leg.
🟠 CONCEPTS
The logic revolves around Z-score normalization of up and down volume to locate statistical extremes. When up-volume z-scores exceed a threshold during a bearish Supertrend, it implies trapped shorts being squeezed; the opposite applies for long liquidations. The script tracks these liquidation spikes and monitors whether a Supertrend regime change follows soon after. If confirmed within the allowed timeout, a colored signal marks the event.
In essence:
Z-score outliers = potential forced liquidations.
Supertrend = structural regime context.
Combined = statistically confirmed reversal signals, not random flips.
This pairing reduces false positives by ensuring that both volatility structure and order-flow extremes agree before flagging a reversal.
🟠 FEATURES
Z-score detection for liquidation spikes with adjustable lookback and threshold.
Confirmation logic linking liquidations to Supertrend flips.
Alerts for liquidation spikes and confirmed reversal starts.
On-chart “No Volume” warning to avoid misreads on illiquid assets.
🟠 USAGE
Setup : Add the script to your main chart. Choose a lower timeframe (default 15m) to capture more granular liquidation flows. Adjust Z-Score Length to control how far back the script measures normal behavior and Threshold to decide what counts as extreme. Keep Timeout Bars low (e.g. 20–50) for faster reversals, or higher for slower markets.
Read the chart :
• Circles appear below bars when long liquidations occur; above bars for short liquidations.
• A Supertrend flip with a recent liquidation spike will display an arrow and color shift.
• Fills between candles and trend lines show which side dominates: green for bullish reversal, red for bearish.
• Candle color fades based on the magnitude of liquidation pressure.
Settings that matter :
• Z-Score Length : Longer smooths noise but delays signal; shorter reacts faster.
• Z-Score Threshold : Higher means only extreme liquidations trigger; lower finds smaller squeezes.
• Timeout Bars : Defines how long after a liquidation the Supertrend flip remains valid.
• Lower Timeframe : Determines the precision of volume readings; too low may increase noise.
Liquidity

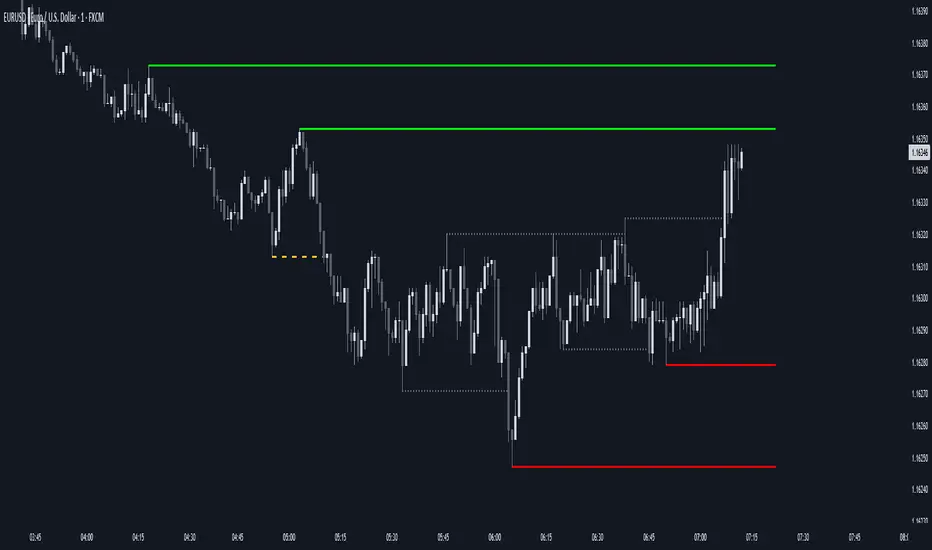
Quantura - Liquidity Sweep & Run LevelsIntroduction
“Quantura – Liquidity Sweep & Run Levels” is a structural price-action indicator designed to automatically detect swing-based liquidity zones and visualize potential sweep and run events. It helps traders identify areas where liquidity has likely been taken (sweep) or released (run), improving precision in market structure analysis and timing of entries or exits.
Originality & Value
This tool translates institutional liquidity concepts into an automated visual framework. Instead of simply marking highs and lows, it dynamically monitors swing points, tracks their breaches, and identifies subsequent reactions. The indicator is built to highlight the liquidity dynamics that often precede reversals or continuations.
Its originality lies in:
Automatic identification and tracking of swing highs and lows.
Real-time detection of broken levels and liquidity sweeps.
Distinction between “Run” and “Sweep” modes for different market behaviors.
Persistent historical visualization of liquidity levels using clean line structures.
Configurable signal markers for bullish and bearish sweep confirmations.
Functionality & Core Logic
Detects swing highs and lows using a user-defined Swing Length parameter.
Stores and updates all swing levels dynamically with arrays for efficient memory handling.
Draws horizontal lines from each detected swing point to visualize potential liquidity zones.
Monitors when price breaks a swing level and marks that event as “broken.”
Generates signals when the market either sweeps above/below or runs away from those levels, depending on the chosen mode.
Provides optional visual signal markers (“▲” for bullish sweeps, “▼” for bearish sweeps).
Parameters & Customization
Mode: Choose between “Sweep” (detects liquidity grabs) or “Run” (detects breakout continuations).
Swing Length: Sets the sensitivity for detecting swing highs/lows. A higher value focuses on larger structures, while smaller values detect micro liquidity points.
Bullish Color / Bearish Color: Customize color themes for sweep/run lines and signal markers.
Signals: Enables or disables visual up/down markers for confirmed events.
Visualization & Display
Horizontal lines represent potential liquidity levels (unbroken swing highs/lows).
Once broken, lines automatically stop extending, marking the moment liquidity is taken.
Depending on the selected mode:
“Sweep” mode identifies false breaks or stop-hunt behavior.
“Run” mode highlights breakouts that continue the trend.
Colored arrows indicate the direction and type of liquidity reaction.
Clean, non-intrusive visualization suitable for overlaying on price charts.
Use Cases
Detect liquidity sweeps before major reversals.
Identify breakout continuations after liquidity runs.
Combine with Supply/Demand or FVG indicators for multi-layered confirmation.
Validate liquidity bias in algorithmic or discretionary strategies.
Analyze market manipulation patterns and institutional stop-hunting behavior.
Limitations & Recommendations
This indicator identifies structural behavior but does not guarantee trade direction or profitability.
Works best on liquid markets with clear swing structures (e.g., crypto, forex, indices).
Signal interpretation should be combined with confluence tools such as volume, order flow, or structure-based filters.
Excessively small swing settings may cause over-signaling in volatile markets.
Markets & Timeframes
Optimized for all major asset classes — including crypto, Forex, indices, and equities — and for intraday to higher-timeframe structural analysis (5-minute up to daily charts).
Author & Access
Developed 100% by Quantura. Published as a Open-source script indicator. Access is free.
Compliance Note
This description fully complies with TradingView’s Script Publishing Rules and House Rules . It avoids performance claims, provides transparency on methodology, and clearly describes indicator behavior and limitations.

Quantura - Quantified Price Action StrategyIntroduction
“Quantura – Quantified Price Action Strategy” is an invite-only Pine Script strategy designed to combine multiple price action concepts into a single trading framework. It integrates supply and demand zones, liquidity sweeps and runs, fair value gaps (FVGs), RSI filters, and EMA trend confirmation. The strategy also provides a visual overlay with dynamic trend-colored candles for easier chart interpretation. It is intended for multi-market use across cryptocurrencies, Forex, equities, and indices.
Originality & Value
The strategy is original in how it unifies several institutional-style price action elements and validates trades only when they align. This reduces noise compared to using single indicators in isolation. Its unique value lies in the combination of:
Supply & Demand detection: Dynamic boxes identified through pivots, ATR, and volume sensitivity.
Liquidity sweeps and runs: Detects when swing highs/lows are broken and retested, distinguishing between liquidity grabs (sweeps) and directional runs.
RSI filter: Can be set to normal or aggressive, confirming momentum before trades.
Fair Value Gaps (FVGs): Optional detection and filtering of price inefficiencies.
EMA filter: Aligns trades with the broader market trend.
Trend candle visualization: Candles dynamically colored bullish, bearish, or neutral, based on strategy positions.
This layered confluence approach ensures that entries are not taken on a single condition but require agreement across several dimensions of market structure, momentum, and order flow.
Functionality & Indicators
Supply & Demand Zones: Zones are created when pivots, ATR sensitivity, and volume thresholds overlap.
Liquidity: Swing highs and lows are tracked, with options for sweep (fakeout/reversal) or run (continuation) detection.
RSI: Confirms long signals when oversold and shorts when overbought, with configurable aggressiveness.
FVG filter: Adds validation by requiring price interaction with inefficiency zones.
EMA filter: Ensures longs are above EMA and shorts below EMA.
Signals & Visualization: Trade entries are marked on the chart, while candles change color to reflect trade direction and status.
Parameters & Customization
Supply & Demand: Sensitivity (swing range, volume multiplier, ATR multiplier) and display options.
Liquidity filter: Mode (Run or Sweep), display, and swing length.
RSI: Enable/disable, length, and style (normal or aggressive).
Fair Value Gaps: Sensitivity via ATR factor, optional volume filter, and display toggles.
EMA: Length, enable/disable, and visualization.
Risk management: Up to three configurable take-profit levels, stop-loss, break-even logic, and capital-based position sizing.
Visualization: Custom candle coloring and optional overlay for better clarity.
Default Properties (Strategy Settings)
Initial Capital: 10,000 USD
Position Size: 100% of equity per trade (backtest default)
Commission: 0.1%
Slippage: 1
Pyramiding: 0 (only one position at a time)
Note: The default of 100% equity per trade is used for testing purposes only and would not be sustainable in real trading. A typical allocation in practice would be between 1–5% of account equity per trade, sometimes up to 10%.
Backtesting & Performance
Backtests on XPTUSD over 2.5 years with the default settings produced:
164 trades
67.68% win rate
Profit factor: 1.7
Maximum drawdown: 27.81%
These results show how the confluence of supply/demand, liquidity, and RSI filters can produce robust setups. However, past performance does not guarantee future results. While the trade count (164) is sufficient for statistical analysis, results may vary across markets and timeframes.
Risk Management
Three configurable take-profit levels with percentage allocation.
Initial stop-loss based on user-defined percentage.
Dynamic stop-loss that adjusts with market movement.
Break-even logic that shifts stops to entry after predefined gains.
Position sizing based on risk percentage of equity.
This framework allows both conservative and aggressive configurations, depending on user preference.
Limitations & Market Conditions
Works best in volatile and liquid markets such as crypto, metals, indices, and FX.
May produce false signals in low-volume or sideways environments.
Unexpected news or macro events can override technical conditions.
Default position sizing of 100% equity is highly aggressive and should be reduced before any practical use.
Usage Guide
Add “Quantura – Quantified Price Action Strategy” to your chart.
Select Supply & Demand, Liquidity, RSI, EMA, and FVG settings according to your market and timeframe.
Configure risk management: take-profits, stop-loss, and risk-per-trade percentage.
Use the Strategy Tester to analyze statistics, equity curve, and performance under different conditions.
Optimize parameters before applying the strategy to different markets.
Author & Access
Developed 100% by Quantura. Published as an Invite-Only script.
Important
This description complies with TradingView’s publishing rules. It clarifies originality, explains the underlying logic, discloses default properties, and presents backtest results with realistic disclaimers.

Momentum Pulse Strategy v1How does this strategy work
1. It analyses current market condition based on moving averages and determines Bullish or Bearish market condition
2. Once we confirm the current market condition, we look for a specific type of candle that has taken the liquidity which is the C1 candle marked on chart
3. Next we look for failure of that liquidity and a candle that engulfs it which confirms the trade and automatically shows the entry,sl and take profits
4. We always enter on the next candle after confirmation which is confirmed by an arrow
Guide
Alerts for Bullish/Bearish market conditions, C1 and confirmation candle available
Master alert for All the conditions also available. On and off also available for all the alert types
All the visuals are customisable in settings
Customisable take profit levels
Entry is the Gold line. SL is the red line and green lines are the Tps
Backtest the trades given by the indicator and to know the max drawdown based on the asset and timeframe
For any other info contact me on tradingview

Liquidity Regime OscillatorThe Liquidity Signal Line is a macro-driven confirmation tool designed to capture the underlying global liquidity regime in a single, smoothed oscillator. It measures the combined directional flow of monetary and financial conditions using high-impact macro data: Federal Reserve assets (WALCL), Treasury General Account (TGA), and the Overnight Reverse Repo facility (RRP) – adjusted by key market proxies such as the U.S. Dollar Index, credit spreads (HYG/LQD), and equity risk appetite (SPHB/SPHQ). These components are normalized, weighted, and then double-smoothed into a stable signal that translates complex liquidity dynamics into a simple 0–100 scale.
Liquidity expansion provides fuel for risk assets, while contraction drains leverage and risk appetite. The Signal Line acts as a confirmation overlay for trend and allocation strategies, showing whether systemic liquidity is broadly supportive or restrictive. Readings above 50 indicate an expansionary environment (risk-on bias), below 50 a contractionary one (risk-off bias). Because the calculation uses higher-timeframe macro data, it can be displayed on any chart to give traders a consistent, regime-aware signal that bridges macro policy and technical execution.

Smart Money Flow Index (SMFI) - Advanced SMC [PhenLabs]📊Smart Money Flow Index (SMFI)
Version: PineScript™v6
📌Description
The Smart Money Flow Index (SMFI) is an advanced Smart Money Concepts implementation that tracks institutional trading behavior through multi-dimensional analysis. This comprehensive indicator combines volume-validated Order Block detection, Fair Value Gap identification with auto-mitigation tracking, dynamic Liquidity Zone mapping, and Break of Structure/Change of Character detection into a unified system.
Unlike basic SMC indicators, SMFI employs a proprietary scoring algorithm that weighs five critical factors: Order Block strength (validated by volume), Fair Value Gap size and recency, proximity to Liquidity Zones, market structure alignment (BOS/CHoCH), and multi-timeframe confluence. This produces a Smart Money Score (0-100) where readings above 70 represent optimal institutional setup conditions.
🚀Points of Innovation
Volume-Validated Order Block Detection – Only displays Order Blocks when formation candle exceeds customizable volume multiplier (default 1.5x average), filtering weak zones and highlighting true institutional accumulation/distribution
Auto-Mitigation Tracking System – Fair Value Gaps and Order Blocks automatically update status when price mitigates them, with visual distinction between active and filled zones preventing trades on dead levels
Proprietary Smart Money Score Algorithm – Combines weighted factors (OB strength 25%, FVG proximity 20%, Liquidity 20%, Structure 20%, MTF 15%) into single 0-100 confidence rating updating in real-time
ATR-Based Adaptive Calculations – All distance measurements use 14-period Average True Range ensuring consistent function across any instrument, timeframe, or volatility regime without manual recalibration
Dynamic Age Filtering – Automatically removes liquidity levels and FVGs older than configurable thresholds preventing chart clutter while maintaining relevant levels
Multi-Timeframe Confluence Integration – Analyzes higher timeframe bias with customizable multipliers (2-10x) and incorporates HTF trend direction into Smart Money Score for institutional alignment
🔧Core Components
Order Block Engine – Detects institutional supply/demand zones using characteristic patterns (down-move-then-strong-up for bullish, up-move-then-strong-down for bearish) with minimum volume threshold validation, tracks mitigation when price closes through zones
Fair Value Gap Scanner – Identifies price imbalances where current candle's low/high leaves gap with two-candle-prior high/low, filters by minimum size percentage, monitors 50% fill for mitigation status
Liquidity Zone Mapper – Uses pivot high/low detection with configurable lookback to mark swing points where stop losses cluster, extends horizontal lines to visualize sweep targets, manages lifecycle through age-based removal
Market Structure Analyzer – Tracks pivot progression to identify trend through higher-highs/higher-lows (bullish) or lower-highs/lower-lows (bearish), detects Break of Structure and Change of Character for trend/reversal confirmation
Scoring Calculation Engine – Evaluates proximity to nearest Order Blocks using ATR-normalized distance, assesses FVG recency and distance, calculates liquidity proximity with age weighting, combines structure bias and MTF trend into smoothed final score
🔥Key Features
Customizable Display Limits – Control maximum Order Blocks (1-10), Liquidity Zones (1-10), and FVG age (10-200 bars) to maintain clean charts focused on most relevant institutional levels
Gradient Strength Visualization – All zones render with transparency-adjustable coloring where stronger/newer zones appear more solid and weaker/older zones fade progressively providing instant visual hierarchy
Educational Label System – Optional labels identify each zone type (Bullish OB, Bearish OB, Bullish FVG, Bearish FVG, BOS) with color-coded text helping traders learn SMC concepts through practical application
Real-Time Smart Money Score Dashboard – Top-right table displays current score (0-100) with color coding (green >70, yellow 30-70, red <30) plus trend arrow for at-a-glance confidence assessment
Comprehensive Alert Suite – Configurable notifications for Order Block formation, Fair Value Gap detection, Break of Structure events, Change of Character signals, and high Smart Money Score readings (>70)
Buy/Sell Signal Integration – Automatically plots triangle markers when Smart Money Score exceeds 70 with aligned market structure and fresh Order Block detection providing clear entry signals
🎨Visualization
Order Block Boxes – Shaded rectangles extend from formation bar spanning high-to-low of institutional candle, bullish zones in green, bearish in red, with customizable transparency (80-98%)
Fair Value Gap Zones – Rectangular areas marking imbalances, active FVGs display in bright colors with adjustable transparency, mitigated FVGs switch to gray preventing trades on filled zones
Liquidity Level Lines – Dashed horizontal lines extend from pivot creation points, swing highs in bearish color (short targets above), swing lows in bullish color (long targets below), opacity decreases with age
Structure Labels – "BOS" labels appear above/below price when Break of Structure confirmed, colored by direction (green bullish, red bearish), positioned at 1% beyond highs/lows for visibility
Educational Info Panel – Bottom-right table explains key terminology (OB, FVG, BOS, CHoCH) and score interpretation (>70 high probability) with semi-transparent background for readability
📖Usage Guidelines
General Settings
Show Order Blocks – Default: On, toggles visibility of institutional supply/demand zones, disable when focusing solely on FVGs or Liquidity
Show Fair Value Gaps – Default: On, controls FVG zone display including active and mitigated imbalances
Show Liquidity Zones – Default: On, manages liquidity line visibility, disable on lower timeframes to reduce clutter
Show Market Structure – Default: On, toggles BOS/CHoCH label display
Show Smart Money Score – Default: On, controls score dashboard visibility
Order Block Settings
OB Lookback Period – Default: 20, Range: 5-100, controls bars scanned for Order Block patterns, lower values detect recent activity, higher values find older blocks
Min Volume Multiplier – Default: 1.5, Range: 1.0-5.0, sets minimum volume threshold as multiple of 20-period average, higher values (2.0+) filter for strongest institutional candles
Max Order Blocks to Display – Default: 3, Range: 1-10, limits simultaneous Order Blocks shown, lower settings (1-3) maintain focus on most recent zones
Fair Value Gap Settings
Min FVG Size (%) – Default: 0.3, Range: 0.1-2.0, defines minimum gap size as percentage of close price, lower values detect micro-imbalances, higher values focus on significant gaps
Max FVG Age (bars) – Default: 50, Range: 10-200, removes FVGs older than specified bars, lower settings (10-30) for scalping, higher (100-200) for swing trading
Show FVG Mitigation – Default: On, displays filled FVGs in gray providing visual history, disable to show only active untouched imbalances
Liquidity Zone Settings
Liquidity Lookback – Default: 50, Range: 20-200, sets pivot detection period for swing highs/lows, lower values (20-50) mark shorter-term liquidity, higher (100-200) identify major swings
Max Liquidity Age (bars) – Default: 100, Range: 20-500, removes liquidity lines older than specified bars, adjust based on timeframe
Liquidity Sensitivity – Default: 0.5, Range: 0.1-1.0, controls pivot detection sensitivity, lower values mark only major swings, higher values identify minor swings
Max Liquidity Zones to Display – Default: 3, Range: 1-10, limits total liquidity levels shown maintaining chart clarity
Market Structure Settings
Pivot Length – Default: 5, Range: 3-15, defines bars to left/right for pivot validation, lower values (3-5) create sensitive structure breaks, higher (10-15) filter for major shifts
Min Structure Move (%) – Default: 1.0, Range: 0.1-5.0, sets minimum percentage move required between pivots to confirm structure change
Multi-Timeframe Settings
Enable MTF Analysis – Default: On, activates higher timeframe trend analysis incorporation into Smart Money Score
Higher Timeframe Multiplier – Default: 4, Range: 2-10, multiplies current timeframe to determine analysis timeframe (4x on 15min = 1hour)
Visual Settings
Bullish Color – Default: Green (#089981), sets color for bullish Order Blocks, FVGs, and structure elements
Bearish Color – Default: Red (#f23645), defines color for bearish elements
Neutral Color – Default: Gray (#787b86), controls color of mitigated zones and neutral elements
Show Educational Labels – Default: On, displays text labels on zones identifying type (OB, FVG, BOS), disable once familiar with patterns
Order Block Transparency – Default: 92, Range: 80-98, controls Order Block box transparency
FVG Transparency – Default: 92, Range: 80-98, sets Fair Value Gap zone transparency independently from Order Blocks
Alert Settings
Alert on Order Block Formation – Default: On, triggers notification when new volume-validated Order Block detected
Alert on FVG Formation – Default: On, sends alert when Fair Value Gap appears enabling quick response to imbalances
Alert on Break of Structure – Default: On, notifies when BOS or CHoCH confirmed
Alert on High Smart Money Score – Default: On, alerts when Smart Money Score crosses above 70 threshold indicating high-probability setup
✅Best Use Cases
Order Block Retest Entries – After Break of Structure, wait for price retrace into fresh bullish Order Block with Smart Money Score >70, enter long on zone reaction targeting next liquidity level
Fair Value Gap Retracement Trading – When price creates FVG during strong move then retraces, enter as price approaches unfilled gap expecting institutional orders to continue trend
Liquidity Sweep Reversals – Monitor price approaching swing high/low liquidity zones against prevailing Smart Money Score trend, after stop hunt sweep watch for rejection into premium Order Block/FVG
Multi-Timeframe Confluence Setups – Identify alignment when current timeframe Order Block coincides with higher timeframe FVG plus MTF analysis showing matching trend bias
Break of Structure Continuations – After BOS confirms trend direction, trade pullbacks to nearest Order Block or FVG in direction of structure break using Smart Money Score >70 as entry filter
Change of Character Reversal Plays – When CHoCH detected indicating potential reversal, look for Smart Money Score pivot with opposing Order Block formation then enter on structure confirmation
⚠️Limitations
Lagging Pivot Calculations – Pivot-based features (Liquidity Zones, Market Structure) require bars to right of pivot for confirmation, meaning these elements identify levels retrospectively with delay equal to lookback period
Whipsaw in Ranging Markets – During choppy conditions, Order Blocks fail frequently and structure breaks produce false signals as Smart Money Score fluctuates without clear institutional bias, best used in trending markets
Volume Data Dependency – Order Block volume validation requires accurate volume data which may be incomplete on Forex pairs or limited in crypto exchange feeds
Subjectivity in Scoring Weights – Proprietary 25-20-20-20-15 weighting reflects general institutional behavior but may not optimize for specific instruments or market regimes, user cannot adjust factor weights
Visual Complexity on Lower Timeframes – Sub-hour timeframes generate excessive zones creating cluttered charts, requires aggressive display limit reduction and higher minimum thresholds
No Fundamental Integration – Indicator analyzes purely technical price action and volume without incorporating economic events, news catalysts, or fundamental shifts that override technical levels
💡What Makes This Unique
Unified SMC Ecosystem – Unlike indicators displaying Order Blocks OR FVGs OR Liquidity separately, SMFI combines all three institutional concepts plus market structure into single cohesive system
Proprietary Confidence Scoring – Rather than manual setup assessment, automated Smart Money Score quantifies probability by weighting five institutional dimensions into actionable 0-100 rating
Volume-Filtered Quality – Eliminates weak Order Blocks forming without institutional volume confirmation, ensuring displayed zones represent genuine accumulation/distribution
Adaptive Lifecycle Management – Automatically updates mitigation status and removes aged zones preventing trades on dead levels through continuous validity and age monitoring
Educational Integration – Built-in tooltips, labeled zones, and reference panel make indicator functional for both learning Smart Money Concepts and executing strategies
🔬How It Works
Order Block Detection – Scans for patterns where strong directional move follows counter-move creating last down-candle before rally (bullish OB) or last up-candle before sell-off (bearish OB), validates formations only when candle exhibits volume exceeding configurable multiple (default 1.5x) of 20-bar average volume
Fair Value Gap Identification – Compares current candle’s high/low against two-candles-prior low/high to detect price imbalances, calculates gap size as percentage of close and filters micro-gaps below minimum threshold (default 0.3%), monitors whether subsequent price fills 50% triggering mitigation status
Liquidity Zone Mapping – Employs pivot detection using configurable lookback (default 50 bars) to identify swing highs/lows where retail stops cluster, extends horizontal reference lines from pivot creation and applies age-based filtering to remove stale zones
Market Structure Analysis – Tracks pivot progression using structure-specific lookback (default 5 bars) to determine trend, confirms uptrend when new pivot high exceeds previous by minimum move percentage, detects Break of Structure when price breaks recent pivot level, flags Change of Character for potential reversals
Multi-Timeframe Confluence – When enabled, requests security data from higher timeframe (current TF × HTF multiplier, default 4x), compares HTF close against HTF 20-period MA to determine bias, contributes ±50 points to score ensuring alignment with institutional positioning on superior timeframe
Smart Money Score Calculation – Evaluates Order Block component via ATR-normalized distance producing max 100-point contribution weighted at 25%, assesses FVG factor through age penalty and distance at 20% weight, calculates Liquidity proximity at 20%, incorporates structure bias (±50-100 points) at 20%, adds MTF component at 15%, applies 3-period smoothing to reduce volatility
Visual Rendering and Lifecycle – Draws Order Block boxes, Fair Value Gap rectangles with color coding (green/red active, gray mitigated), extends liquidity dashed lines with fade-by-age opacity, plots BOS labels, displays Smart Money Score dashboard, continuously updates checking mitigation conditions and removing elements exceeding age/display limits
💡Note:
The Smart Money Flow Index combines multiple Smart Money Concepts into unified institutional order flow analysis. For optimal results, use the Smart Money Score as confluence filter rather than standalone entry signal – scores above 70 indicate high-probability setups but should be combined with risk management, higher timeframe bias, and market regime understanding.

R Dominant Range [CRT] by Sergi SernaR Dominant Range identifies the most influential R range located to the left of the current price action. It highlights the dominant zone that still impacts market behavior, helping traders understand which range is controlling the current structure.

Liquidity Heatmap Concepts [sma] Overview
Liquidity Heatmap Concepts is a sophisticated visualization tool that maps potential liquidation zones for leveraged positions across multiple timeframes. It calculates and displays where high-volume liquidations might occur at various leverage levels (25x, 50x, 100x, 150x), helping traders identify potential support/resistance zones created by cascading liquidations. Additionally, it includes a quarterly volume profile to show historical price distribution and Point of Control levels.
### Volume-Based Trigger System
Lines are only drawn when volume exceeds a threshold:
1. Calculates 14-period simple moving average of volume
2. Applies configurable multiplier (default 1.2x) to determine significance
3. Only plots liquidation levels when current volume > (Volume SMA × Multiplier)
4. This filters out low-volume noise and focuses on meaningful zones
### Visual Intensity System
The indicator uses a gradient coloring system based on relative volume:
- **Peak Volume (White)**: When current bar has maximum volume in the dataset
- Line width: 3 pixels
- Brightest color intensity
- **Above Average Volume**: Volume exceeds average but isn't peak
- Line width: 2 pixels
- Medium color intensity
- **Standard Volume**: Exceeds threshold but below average
- Line width: 1 pixel
- Base color intensity
### Line Extension & Management
- Lines extend horizontally to the right until price crosses them
- Automatic cleanup removes lines after maximum count (default 500)
- Lines persist until invalidated by price action crossing the level
- Oldest lines are removed first when limit is reached
### Quarterly Volume Profile
An optional fixed-range volume profile that:
1. **Automatic Quarter Detection**: Identifies Q1 (Jan-Mar), Q2 (Apr-Jun), Q3 (Jul-Sep), Q4 (Oct-Dec)
2. **Price Distribution Analysis**: Divides the quarter's price range into configurable rows (default 20)
3. **Volume Aggregation**: Accumulates volume at each price level throughout the quarter
4. **POC Identification**: Highlights the price level with highest volume (Point of Control)
5. **Value Area**: Shows the price range containing 70% (configurable) of total volume
6. **Profile Drawing**: At the start of each new quarter, draws the previous quarter's profile as horizontal bars
The volume profile can be positioned on either left or right side of the quarter range with adjustable width.
## Key Features
- **Multi-Leverage Display**: Toggle between 25x, 50x, 100x, and 150x leverage levels independently
- **Dual Side Tracking**: Separate visualization for long and short liquidation zones
- **Volume-Weighted Importance**: Visual intensity correlates with volume significance
- **Gradient Coloring**: Color intensity reflects relative volume magnitude
- **Smart Line Management**: Automatic cleanup prevents chart clutter
- **Historical Context**: Quarterly volume profile shows where price spent most time
- **Fully Customizable**: All colors, thresholds, and display options are adjustable
- **HD Mode**: Uses absolute volume for more precise visualization
## Parameters
### Leverage Selection
- **25x, 50x, 100x, 150x Toggles**: Enable/disable specific leverage levels
- Each level can be controlled independently
### Volume Configuration
- **Minimum Volume Multiplier** (default 1.2): Threshold above volume SMA to trigger lines
- Higher values = fewer but more significant levels
- Lower values = more levels but increased noise
### Advanced Settings
- **Maximum Lines** (default 500, range 50-500): Memory management limit
- Controls how many historical liquidation lines are maintained
### Quarterly Volume Profile
- **Show Previous Q Volume Profile** (default on): Toggle profile visibility
- **Number of Rows** (default 20, range 10-50): Price distribution granularity
- **Profile Width** (default 30%): Visual width as percentage of quarter range
- **Value Area** (default 70%): Percentage of volume for value area calculation
- **Position** (Left/Right): Profile placement relative to quarter
- **Show Values** (default off): Display POC volume label
- **Colors**: Customizable base and POC colors
### Color Customization
- **Long Colors**: Individual colors for each leverage level (25x, 50x, 100x, 150x)
- **Short Colors**: Separate color scheme for short liquidation zones
- **VP Colors**: Base color and POC highlight color for volume profile
## Interpretation
### Liquidation Clusters
- **Dense Line Areas**: Multiple overlapping liquidation levels suggest strong magnetic zones
- **High-Volume Lines**: Brighter/thicker lines indicate more significant potential liquidations
- **Line Breaks**: Price crossing multiple liquidation lines may trigger cascade effects
### Trading Applications
- **Support/Resistance**: Liquidation clusters often act as temporary support/resistance
- **Stop Hunt Zones**: Areas where price may spike to trigger liquidations before reversing
- **Momentum Acceleration**: Breaking through dense clusters can indicate strong directional moves
- **Risk Management**: Avoid placing stops directly at obvious liquidation levels
### Volume Profile Usage
- **POC (Point of Control)**: Price level with highest volume - often acts as strong support/resistance
- **Value Area**: Where most trading activity occurred - indicates fair value range
- **Profile Shape**:
- Balanced profile (bell curve) = ranging market
- Skewed profile = trending market with acceptance at extremes
- **Profile Gaps**: Low volume areas suggest price may move quickly through these zones
### Combined Analysis
- Liquidation lines near quarterly POC create extra-strong zones
- Price returning to value area from outside often finds support/resistance
- Liquidation clusters at value area edges suggest potential reversal points
## Technical Implementation
This indicator features:
- **Custom Type Structures**: Uses type definitions for organized data storage
- `BarData`: Stores OHLCV and index information
- `LiquidityBin`: Manages arrays of line objects for each leverage level
- `VolumeProfileData`: Handles profile boxes, labels, and range data
- **Dynamic Line Objects**: Creates, updates, and deletes line primitives programmatically
- **Array-Based History**: Maintains volume history for gradient calculations
- **Intelligent Cleanup**: Automatic memory management prevents performance degradation
- **Mathematical Precision**: Leverage-based liquidation formulas ensure accurate price levels
- **Quarterly Aggregation**: Efficient volume accumulation with automatic period detection
- **Box Drawing System**: Dynamic profile visualization using box primitives
## Originality Statement
This indicator presents a unique approach to liquidity visualization:
- Implements leverage-specific liquidation price calculations based on mathematical formulas
- Uses volume-weighted gradient coloring system that adapts to relative volume significance
- Combines real-time liquidation mapping with historical volume profile analysis
- Features intelligent line lifecycle management with automatic extension and cleanup
- Integrates quarterly volume profile with configurable value area and POC detection
- Employs multi-layer visual hierarchy (line width + color intensity) for information density
- Uses custom data structures to efficiently manage hundreds of line objects simultaneously
The combination of mathematical liquidation pricing, volume-based filtering, gradient visualization, and quarterly volume distribution creates a comprehensive liquidity analysis tool.
## Best Practices
- Use on liquid markets (major cryptocurrencies, forex pairs) for best accuracy
- Lower timeframes (1m-15m) for day trading and scalping
- Higher timeframes (1h-4h) for swing trading context
- Combine with volume profile to identify high-probability reversal zones
- Watch for price reactions when approaching dense liquidation clusters
- Increase volume multiplier in choppy markets to reduce noise
- Reduce maximum lines on lower timeframes to maintain performance
- Use quarterly volume profile to understand longer-term fair value
## Important Notes
- Liquidation prices are estimates based on leverage ratios
- Actual exchange liquidation prices may vary due to:
- Maintenance margin requirements
- Mark price vs last price calculations
- Individual exchange liquidation engines
- Insurance fund mechanisms
- This tool shows potential zones, not guaranteed liquidation prices
- Volume profile resets each quarter automatically
---
Works on all timeframes and asset classes. Designed for crypto/forex leverage markets. For educational purposes only. Not financial advice.
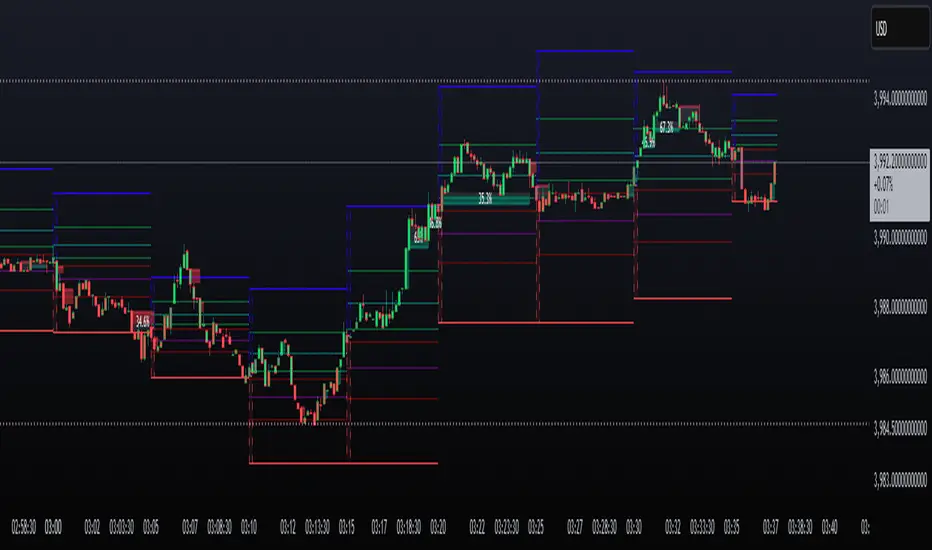
Dynamic Liquidity HeatMap Profile [BigBeluga]🔵 OVERVIEW
The Dynamic Liquidity HeatMap Profile is a smart-flow liquidity tracker that maps where stop-loss clusters and resting limit orders are likely positioned.
Instead of traditional volume profiles based only on executed transactions, this tool projects probable liquidity pools — areas where traders are trapped or positioned and where smart money may hunt stops or fill orders.
It dynamically scans recent price swings, builds liquidity zones above and below price, and visualizes them as a heat map + histogram — highlighting areas with the greatest liquidity attraction.
Orange highlights the highest-concentration liquidity (POC), making potential sweep targets obvious.
🔵 CONCEPTS
Liquidity pools form above swing highs (buy stops) and below swing lows (sell stops).
Market makers & large players often push price into these zones to trigger stops and capture liquidity.
The indicator uses recent volatility + volume expansion to estimate where these pools exist.
Horizontal heat bars show depth and intensity of probable liquidity.
Profile side histogram displays buy-side vs sell-side liquidity distribution.
🔵 FEATURES
Dynamic Liquidity Detection — finds potential stop-loss clusters from recent swing behavior.
Dual-Side Heatmap — split liquidity view above (short stops) and below (long stops) current price.
Volume-Weighted Levels — higher volatility & volume = deeper liquidity expectation.
Real-Time Heat Coloring
• Lime = liquidity below price (potential buy-side fuel)
• Blue = liquidity above price (potential sell-side fuel)
• Orange = peak liquidity (POC)
Liquidity Profile Histogram — plotted at right side, layered by strength.
Auto-Cleaning Engine — removes invalidated liquidity after breaks.
Adjustable lookback window and bin resolution .
🔵 HOW TO USE
Look for price moving toward dense liquidity zones — high probability of wick raids or sweeps.
Orange POC often acts as magnet — strong target zone for smart money.
Combine with SFP / BOS logic to time reversals after liquidity hunts.
In trend, price repeatedly sweeps opposite-side liquidity before continuation.
Use liquidity walls as bias filters — heavy liquidity above often precedes downward move, and vice-versa.
Great for scalping sessions, indices, FX, BTC, ETH.
🔵 CONCLUSION
The Dynamic Liquidity HeatMap Profile gives traders a tactical edge by revealing where the market’s hidden liquidity resides.
It highlights where shorts and longs are positioned, identifies likely sweep zones, and marks the most attractive liquidity magnet (POC).
Use it to anticipate stop hunts, avoid getting trapped, and align with smart-money flow instead of fighting it.

Killzone Session High/Low Levels [SmartFoxy]Killzone Session High/Low Levels
The Killzone Session High/Low Levels indicator by SmartFoxy provides a complete intraday framework for understanding session-based liquidity, market structure rotation, and breakout behavior across global trading sessions.
It automatically plots the High/Low ranges for each selected session, highlights session killzones, and tracks breakout events with optional alerts.
This tool is designed for traders who rely on session dynamics (Asia, Frankfurt, London, New York) to identify liquidity targets, sweep zones, key ranges, and continuation/reversal opportunities.
________________________________________
How It Works
The indicator detects the active trading sessions for each day and builds structural High/Low ranges for them:
• Asia Session Range (High/Low);
• Frankfurt Session Range;
• London Session Range;
• New York Session Range;
• Optional custom session (NY Open, or any killzone).
For each session, the script can display:
• Session box or column;
• High/Low levels;
• Labels for every range (H/L);
• True session boundaries using user-defined timezone;
• Auto-extended levels up to the latest candle;
• Break levels after a breakout;
• Conditional removal or recoloring after a level is breached.
This gives traders a clean visual map of session liquidity and how price interacts with it throughout the day.
________________________________________
Key Features
1. Multiple Global Sessions •➤ Asia, Frankfurt, London, New York, plus one custom session for advanced killzone mapping.
2. Session High/Low Liquidity Levels •➤ Automatic plotting of every session’s High and Low, with optional labels and price markers.
3. Session Boxes or Columns •➤ Two display modes allow traders to visualize the session either as a filled box or a clear vertical column.
4. Breakout Logic & Temporary Levels .
When price breaks a session High/Low:
• Levels can be extended for a selected number of bars
• Or removed instantly after a breakout
• Or recolored to highlight the sweep event
This enables clean identification of liquidity grabs, breakouts, and continuation setups.
5. Alerts for Session Breakouts .
Set alerts when price breaks:
• Any session level
• Only levels formed on the current day
Perfect for traders who want real-time notifications of sweeps or key structure breaks.
6. Full Customization
You can configure:
• Session times;
• Timezone;
• Colors;
• Labels;
• Line styles and widths;
• Breakout behavior;
• Killzone range handling.
Everything is adjustable to match any trading style.
________________________________________
How to Use
1. Enable the sessions you want to track •➤ Asia, Frankfurt, London, New York, or custom.
2. Choose display mode
Box mode for visual range blocks;
Column mode for clean vertical alignment.
3. Enable High/Low Levels .
These act as liquidity magnets and key rejection zones.
4. Turn on Breakout Levels (optional)
Useful for spotting sweeps and continuation setups.
5. Turn on Alerts if you want notifications when price breaks levels.
6. Use session levels as liquidity reference points .
They work exceptionally well with smart money concepts (SMC), ICT, and intraday structure analysis.
________________________________________
Why This Indicator Is Useful
Shows exactly where liquidity is placed each session;
Highlights market structure transitions as sessions hand over control;
Helps identify stop hunts, sweeps, reversals, and continuation patterns;
Provides real-time alerts for structural breaks;
Organizes the chart and reduces noise;
Works with any intraday timeframe and any market.
This makes it valuable for scalpers, day traders, and SMC/ICT-style analysts.
________________________________________
Summary
Killzone Session High/Low Levels delivers a complete, highly customizable intraday mapping system based on global trading sessions.
It clarifies the session structure, reveals liquidity targets, and empowers traders to make confident trading decisions using clean, objective market data.

MTF Liquidity Levels Pro (D/W/M) [SmartFoxy]✅ SCRIPT DESCRIPTION (Premium MTF High-Low Levels)
Overview
This indicator automatically plots key High/Low levels across three major timeframes:
Daily (D) , Weekly (W) , and Monthly (M) .
It includes:
• Current period highs/lows (DH/DL, WH/WL, MH/ML);
• Previous period highs/lows (PDH/PDL, PWH/PWL, PMH/PML);
• Open levels (Day Open, Day True Open, Week Open, Month Open);
• Visual elements such as separators, period boxes, labels, and price markers;
• A fully customizable breakout alert system .
The indicator is designed for precise market structure analysis with a focus on liquidity, MTF mechanics, and clean price action.
________________________________________
How It Works
The script tracks historical High/Low levels on each timeframe and displays:
✅ Current High/Low Levels :
Daily;
Weekly;
Monthly.
✅ Previous High/Low levels from the previous day, week, and month:
PDH / PDL;
PWH / PWL;
PMH / PML.
You can select how many previous levels to display (1, 2, 3…).
✅ Open Levels:
Day Open;
Week Open;
Month Open.
Includes optional True Day Open with time offset.
✅ Visual Period Boxes highlighting each session (Day Box, Week Box, Month Box) to help identify intraday and intraperiod structure.
✅ Vertical Separators for the start of each day, week, and month.
✅ Customizable Labels & Price Markers with positions, sizes, and optional price display.
________________________________________
Alerts
A flexible alert module is built in:
✅ Breakout of Any Previous Level (D/W/M) •➤ Triggers when price breaks any previous High/Low:
PDH/PDL;
PWH/PWL;
PMH/PML.
✅ Breakout of Previous Level 1 (D/W/M) •➤ Triggers only for the closest previous levels:
PDH1/PDL1;
PWH1/PWL1;
PMH1/PML1.
✅ Custom Breakout •➤ Choose a specific level:
PDH / PDL;
PWH / PWL;
PMH / PML.
and select which level number (1, 2, 3…) the alert should track.
________________________________________
How to Use
Select which timeframes (D/W/M) to display.
Choose how many previous levels to plot.
Enable Open, Boxes, Separators, or Labels as needed.
Enable True Day Open with offset if required.
Activate Alerts and choose the breakout logic:
• All previous levels;
• Only the nearest level;
• Custom level selection.
Create an alert in TradingView using “Any alert() function call”.
________________________________________
Why This Indicator Is Useful
✅ Instantly reveals key High/Low liquidity zones across multiple timeframes
✅ Helps synchronize market structure across D/W/M levels
✅ Useful for identifying impulses, breakouts, reversals, and liquidity runs
✅ Highlights levels price frequently revisits
✅ Eliminates the need for additional MTF tools
✅ Alerts automate breakout detection for both intraday and swing traders
Suitable for all markets : Forex, Crypto, Indices, Stocks, Futures.

US/SPY- Financial Regime Index Swing Strategy Credits: concept inspired by EdgeTools Bloomberg Financial Conditions Index (Proxy)
Improvements: eight component basket, inverse volatility weights, winsorization option( statistical technique used to limit the influence of outliers in a dataset by replacing extreme values with less extreme ones, rather than removing them entirely), slope and price gates, exit guards, table and gradients.
Summary in one paragraph
A macro regime swing strategy for index ETFs, futures, FX majors, and large cap equities on daily calculation with optional lower time execution. It acts only when a composite Financial Conditions proxy plus slope and an optional price filter align. Originality comes from an eight component macro basket with inverse volatility weights and winsorized return z scores that produce a portable yardstick.
Scope and intent
Markets: SPY and peers, ES futures, ACWI, liquid FX majors, BTC, large cap equities.
Timeframes: calculation daily by default, trade on any chart.
Default demo: SPY on Daily.
Purpose: convert broad financial conditions into clear swing bias and exits.
Originality and usefulness
Unique fusion: return z scores for eight liquid proxies with inverse volatility weighting and optional winsorization, then slope and price gates.
Failure mode addressed: false starts in chop and early shorts during easy liquidity.
Testability: all knobs are inputs and the table shows components and weights.
Portable yardstick: z scores center at zero so thresholds transfer across symbols.
Method overview in plain language
Base measures
Return basis: natural log return over a configurable window, standardized to a z score. Winsorization optional to cap extremes.
Components
EQ US and EQ GLB measure equity tone.
CREDIT uses LQD over HYG. Higher credit quality outperformance is risk off so sign is flipped after z score.
RATES2Y uses two year yield, sign flipped.
SLOPE uses ten minus two year yield spread.
USD uses DXY, sign flipped.
VOL uses VIX, sign flipped.
LIQ uses BIL over SPY, sign flipped.
Each component is smoothed by the composite EMA.
Fusion rule
Weighted sum where weights are equal or inverse volatility with exponent gamma, normalized to percent so they sum to one.
Signal rule
Long when composite crosses up the long threshold and its slope is positive and price is above the SMA filter, or when composite is above the configured always long floor.
Short when composite crosses down the short threshold and its slope is negative and price is below the SMA filter.
Long exit on cross down of the long exit line or on a fresh short signal.
Short exit on cross up of the short exit line or on a fresh long signal, or when composite falls below the force short exit guard.
What you will see on the chart
Markers on suggestion bars: L for long, S for short, LX and SX for exits.
Reference lines at zero and soft regime bands at plus one and minus one.
Optional background gradient by regime intensity.
Compact table with component z, weight percent, and composite readout.
Table fields and quick reading guide
Component: EQ US, EQ GLB, CREDIT, RATES2Y, SLOPE, USD, VOL, LIQ.
Z: current standardized value, green for positive risk tone where applicable.
Weight: contribution percent after normalization.
Composite: current index value.
Reading tip: a broadly green Z column with slope positive often precedes better long context.
Inputs with guidance
Setup
Calc timeframe: default Daily. Leave blank to inherit chart.
Lookback: 50 to 1500. Larger length stabilizes regimes and delays turns.
EMA smoothing: 1 to 200. Higher smooths noise and delays signals.
Normalization
Winsorize z at ±3: caps extremes to reduce one off shocks.
Return window for equities: 5 to 260. Shorter reacts faster.
Weighting
Weight lookback: 20 to 520.
Weight mode: Equal or InvVol.
InvVol exponent gamma: 0.1 to 3. Higher compresses noisy components more.
Signals
Trade side: Long Short or Both.
Entry threshold long and short: portable z thresholds.
Exit line long and short: soft exits that give back less.
Slope lookback bars: 1 to 20.
Always long floor bfci ≥ X: macro easy mode keep long.
Force short exit when bfci < Y: macro stress guard.
Confirm
Use price trend filter and Price SMA length.
View
Glow line and Show component table.
Symbols
SPY ACWI HYG LQD VIX DXY US02Y US10Y BIL are defaults and can be changed.
Realism and responsible publication
No performance claims. Past is not future.
Shapes can move intrabar and settle on close.
Execution is on standard candles only.
Honest limitations and failure modes
Major economic releases and illiquid sessions can break assumptions.
Very quiet regimes reduce contrast. Use longer windows or higher thresholds.
Component proxies are ETFs and indexes and cannot match a proprietary FCI exactly.
Strategy notice
Orders are simulated on standard candles. All security calls use lookahead off. Nonstandard chart types are not supported for strategies.
Entries and exits
Long rule: bfci cross above long threshold with positive slope and optional price filter OR bfci above the always long floor.
Short rule: bfci cross below short threshold with negative slope and optional price filter.
Exit rules: long exit on bfci cross below long exit or on a short signal. Short exit on bfci cross above short exit or on a long signal or on force close guard.
Position sizing
Percent of equity by default. Keep target risk per trade low. One percent is a sensible starting point. For this example we used 3% of the total capital
Commisions
We used a 0.05% comission and 5 tick slippage
Legal
Education and research only. Not investment advice. Test in simulation first. Use realistic costs.

True Previous Day/Week High & LowTrue Previous Day/Week High & Low
What makes this indicator unique:
Unlike most previous day high/low indicators that only track SESSION data (e.g., 6:00 PM - 5:00 PM for futures), this indicator calculates the TRUE calendar day high and low from MIDNIGHT TO MIDNIGHT (00:00 - 23:59) in New York time.
Why this matters:
- Session-based indicators miss crucial price action that occurs during overnight hours
- True midnight-to-midnight calculation gives you the ACTUAL daily range
- Essential for traders who need accurate previous day levels for support/resistance
- Works perfectly on 24-hour markets like futures (NQ, ES, YM, etc.)
Features:
✓ True calendar day high/low (00:00-23:59 NY time)
✓ Previous week high/low
✓ Customizable line colors, widths, and styles (solid, dashed, dotted)
✓ Optional labels with adjustable size, color, and spacing
✓ Values displayed on price scale
✓ Toggle individual levels on/off
✓ Optimized for 1-minute charts but works on all timeframes
Perfect for:
- Futures traders (NQ, ES, YM, RTY)
- Day traders using previous day levels as key support/resistance
- Swing traders tracking weekly ranges
- Anyone who needs accurate 24-hour high/low levels
Settings are clean and intuitive - just add to your chart and customize the appearance to match your setup!

NFCI National Financial Conditions IndexChicago Fed National Financial Conditions Index (NFCI)
This indicator plots the Chicago Fed’s National Financial Conditions Index (NFCI).
The NFCI updates weekly, and its latest value is displayed across all chart intervals.
The NFCI measures how tight or loose overall U.S. financial conditions are. It combines over 100 weekly indicators from the money, bond, and equity markets—along with credit and leverage data—into a single composite index.
The NFCI has three key subcomponents, each of which can be independently selected within the indicator:
Risk: Captures volatility, credit spreads, and overall market stress.
Credit: Tracks how easy or difficult it is to borrow across households and businesses.
Leverage: Reflects the level of debt and balance-sheet strength in the financial system.
When the NFCI rises, financial conditions are tightening — liquidity is contracting, borrowing costs are climbing, and investors tend to reduce risk.
When the NFCI falls, conditions are loosening — liquidity expands, credit flows more freely, and markets generally become more risk-seeking.
Traders often use the NFCI as a macro backdrop for risk appetite: rising values signal growing stress and defensive positioning, while falling values indicate improving liquidity and a more supportive market environment.

AEON | Liquidity HunterA visual tool for identifying high-probability liquidity zones across multiple timeframes and sessions.
Overview
Liquidity Hunter is a multi-timeframe, all market tool designed to help traders visualise areas where price may be drawn in search of resting liquidity. These liquidity zones often align with swing highs and lows, session extremes, or significant higher-time-frame reference points.
Rather than producing entry or exit signals, this indicator aims to support market behaviour analysis and contextual awareness.
Core Functions
The indicator identifies potential liquidity areas using four optional methods:
1. Current Time Frame Analysis – Automatically locates swing highs and lows based on a customisable setting for sensitivity and lookback depth.
2. Higher Time Frame Analysis – Uses the same logic as above, but projects liquidity zones from a selected higher time frame (HTF).
3. Session Highs & Lows – Highlights the Asian, London, New York, or user-defined session extremes where liquidity commonly pools.
4. Time-Based Highs & Lows – Marks the final bar of any higher time frame (for example, the last H4 or D1 candle) to show potential liquidity reference points.
Each method can be enabled or disabled independently and visually customised, allowing traders to tailor the display to their preferred style and time frame.
How to Use
When applied, the indicator plots horizontal levels representing potential liquidity pools. These levels persist until price engages with or mitigates them, at which point users can opt to modify their visual style or delete them as preferred.
Adjusting the sensitivity of the current and higher time frame levels may reflect the market's likelihood of treating them as targets or reversal points.
Many traders combine these levels with concepts such as market structure shifts, displacement, or fair-value gaps to build a narrative around price behaviour.
Disclaimer
This indicator is provided for educational and informational purposes only. It does not constitute financial advice or a trade signal. Past performance or visual confluence does not guarantee future results.
---
About the Author
Created by a passionate developer focused on algorithmic and quantitative concepts.
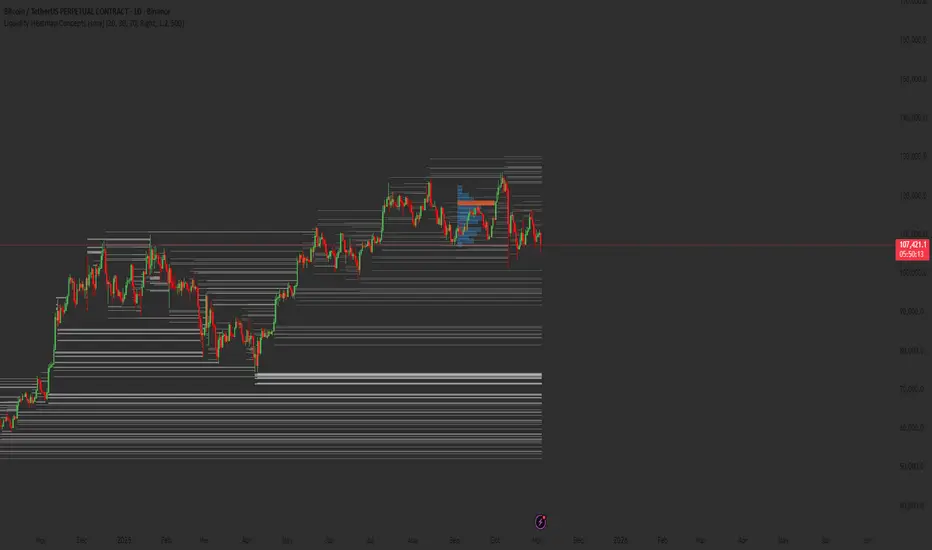
Stealth Liquidation Heatmap V6.4Stealth Liquidation Heatmap v6.4
Overview
A chart-native liquidity map that infers potential liquidity zones directly from price action on a selected higher timeframe (HTF). No external liquidation feeds are used. Boxes are time-anchored to HTF candles, extend to the right on lower timeframes, and turn gray once swept.
How it works (high level)
The core engine is multi-oscillator: an EMA-differential (MACD-style) momentum line with its smoothing line, assisted by auxiliary volatility/momentum filters. Triggers are evaluated on confirmed HTF closes to avoid intra-bar noise.
When aligned momentum conditions occur on the Signal TF:
• a bullish zone anchors slightly below the HTF candle’s low,
• a bearish zone anchors slightly above the HTF candle’s high.
Boxes use xloc=bar_time (anchored to the HTF candle’s timestamp) so levels line up cleanly on lower-timeframe charts. Box height is user-selectable (High–Low, Body |C–O|, or custom % of price). Right-extension length is measured in bars of the current chart timeframe.
Sweep logic & visuals
A zone is marked “swept” (turns gray) when a selected mode is met:
• Any touch inside the box, or
• Wick touching the outer edge (default), or
• Close beyond the edge.
Options include arm delay, freeze after sweep, show/hide swept zones, and age-based fading for clarity.
Presets
• Aggressive — momentum-only with higher sensitivity (more zones).
• Normal — momentum-only with balanced sensitivity (additional smoothing/thresholding to reduce noise).
• Conservative — momentum-only with stricter filtering (fewer zones).
How to use
Best viewed on 5–15m charts with a 4h or 1D Signal TF. Treat zones as areas where liquidity may cluster or be swept; combine with your own TA and risk management. Height/sweep/extension/fade controls help tailor visuals to instrument volatility.
Screenshot example:
Notes & limitations
This tool does not access real liquidation/OI feeds; it infers liquidity behavior algorithmically from price-based momentum structure. Because evaluations are anchored to HTF closes, new triggers finalize after the source HTF bar closes. Right-extension is measured in bars of the current chart timeframe. Visual/educational use only; not financial advice.

Liquidity Grab + RSI Divergence═══════════════════════════════════════════════════════════════
LIQUIDITY GRAB + RSI DIVERGENCE INDICATOR
═══════════════════════════════════════════════════════════════
📌 OVERVIEW
This indicator identifies high-probability reversals by combining:
• Liquidity sweeps (stop hunts)
• RSI divergence confirmation
• Filters false breakouts automatically
═══════════════════════════════════════════════════════════════
🟢 BUY SIGNAL (Green Triangle Up)
REQUIRES BOTH CONDITIONS:
1. Liquidity Grab Below Previous Low
• Price breaks BELOW recent low
• Candle CLOSES ABOVE that low
• Traps sellers who shorted the breakdown
2. Bullish RSI Divergence
• Price: Lower Low (LL)
• RSI: Higher Low (HL)
• Shows weakening downward momentum
➜ Result: Potential bullish reversal
═══════════════════════════════════════════════════════════════
🔴 SELL SIGNAL (Red Triangle Down)
REQUIRES BOTH CONDITIONS:
1. Liquidity Grab Above Previous High
• Price breaks ABOVE recent high
• Candle CLOSES BELOW that high
• Traps buyers who bought the breakout
2. Bearish RSI Divergence
• Price: Higher High (HH)
• RSI: Lower High (LH)
• Shows weakening upward momentum
➜ Result: Potential bearish reversal
═══════════════════════════════════════════════════════════════
📊 VISUAL INDICATORS
Main Signals:
🔺 Large Green Triangle = BUY (Liq Grab + Bullish Div)
🔻 Large Red Triangle = SELL (Liq Grab + Bearish Div)
Reference Levels:
━ Red Line = Previous High Level
━ Green Line = Previous Low Level
Additional Markers (Optional):
○ Small Green Circle = Liquidity grab low only
○ Small Red Circle = Liquidity grab high only
✕ Small Blue Cross = Bullish divergence only
✕ Small Orange Cross = Bearish divergence only
═══════════════════════════════════════════════════════════════
⚙️ SETTINGS
1. Lookback Period (Default: 20)
• Range: 5-100
• Sets how far back to identify previous highs/lows
• Higher = fewer but stronger levels
• Lower = more frequent but weaker levels
2. RSI Length (Default: 14)
• Range: 5-50
• Standard RSI calculation period
• 14 is industry standard
3. RSI Divergence Lookback (Default: 5)
• Range: 3-20
• Controls pivot point sensitivity
• Higher = fewer divergence signals
• Lower = more divergence signals
4. Show Labels (Default: ON)
• Toggle BUY/SELL text labels
• Disable for cleaner chart view
═══════════════════════════════════════════════════════════════
💡 HOW TO USE
Step 1: WAIT FOR CONFIRMATION
• Only trade LARGE TRIANGLE signals
• Ignore small circles/crosses alone
Step 2: CHECK TIMEFRAME
• Best on: 15min, 1H, 4H, Daily
• Avoid: 1min, 5min (too noisy)
Step 3: CONFIRM CONTEXT
• Check overall market trend
• Identify key support/resistance
• Look for confluence with price action
Step 4: ENTRY & RISK MANAGEMENT
• Enter on signal candle close or pullback
• Stop loss below/above the liquidity grab wick
• Target: Previous swing high/low or key levels
• Risk/Reward: Minimum 1:2 ratio
Step 5: SET ALERTS
• Create alert for "BUY Signal"
• Create alert for "SELL Signal"
• Never miss opportunities
═══════════════════════════════════════════════════════════════
✅ BEST PRACTICES
DO:
✓ Use on multiple timeframes for confluence
✓ Combine with support/resistance zones
✓ Wait for both conditions (liq grab + divergence)
✓ Practice on demo account first
✓ Use proper position sizing
DON'T:
✗ Trade every small circle/cross
✗ Use on very low timeframes (<15min)
✗ Ignore overall market context
✗ Trade without stop loss
✗ Risk more than 1-2% per trade
═══════════════════════════════════════════════════════════════
⚠️ IMPORTANT NOTES
• This is a CONFIRMATION tool, not a holy grail
• No indicator is 100% accurate
• Combine with your trading strategy
• Backtest on your preferred instruments
• Adjust parameters for your trading style
• Higher timeframes = more reliable signals
• Always use risk management
═══════════════════════════════════════════════════════════════
🔔 ALERTS INCLUDED
Two alert conditions are built-in:
1. "BUY Signal" - Liquidity Grab + Bullish RSI Divergence
2. "SELL Signal" - Liquidity Grab + Bearish RSI Divergence
═══════════════════════════════════════════════════════════════
📈 RECOMMENDED SETTINGS BY TIMEFRAME
5-15 Min Charts:
• Lookback: 10-15
• RSI Length: 14
• RSI Div Lookback: 3-5
1H-4H Charts:
• Lookback: 20-30
• RSI Length: 14
• RSI Div Lookback: 5-7
Daily Charts:
• Lookback: 30-50
• RSI Length: 14
• RSI Div Lookback: 7-10
═══════════════════════════════════════════════════════════════
Good luck and trade safe! 🚀

Liquidity ToolkitKey Points:
Liquidity Toolkit is your liquidity companion for monitoring and anticipating price action.
Liquidity Toolkit combined the power of the Liquidity Status indicator with the potency of Price Triggers.
Liquidity Status indicates if the current current liquidity environment is bullish or bearish.
Price triggers highlight price levels where supports, resistances, and trend-changes are likely to occur.
Together, they create a comprehensive and actionable view of the market.
Summary
The Liquidity Toolkit (TK) is designed as a one-stop-shop indicator by combining novel liquidity metrics with traditional and impactful price measurements. In combination, TK grants unparalleled views of the market through effective yet simple displays.
The TK indicator contains two separate by synergistic algorithms: the Liquidity Status algorithm, which measures liquidity to determine if outlooks are bearish or bullish; and the Price Triggers algorithm which analyzes price-action to determine points of support and resistances.
Example 1 :
Example 2 :
Example 3 :
Details
Liquidity Status
Liquidity Status (LS) measures liquidity and produces either `Bullish` or `Bearish` indications depending on the current liquidity status.
Bullish indications indicate that the overall flow of liquidity is supportive of bullish price and bearish indications indicate that the overall flow of liquidity is supportive of bearish price action.
LS is displayed in two ways:
Candle-Coloring: if candles are green, liquidity status is bullish and if candles are red, liquidity status is bearish.
Text Display: Bearish and/or Bullish is displayed via text as well.
Price Triggers
Price Triggers (PT) measure price action and report their findings on several timeframes:
1-Minute
5-Minute
60-Minute
1-Day
1-Week
TK graphs the PTs based on the chart interval – only the higher PTs are display (i.e.: On the 1-Hour chart, the 5-, and 1-Min PTs will not be displayed).
Example 4
In additional to showing price-levels of support and resistance, Price Triggers also display the relative strength of these supports and resistances by displaying the Trigger Strengths. These represent areas of influence.
Opportunities often arise when PTs squeeze each other, often forcing spot to make a large move – as can be seen below:
Example 5
Frequently Asked Questions
How can I get access to the Liquidity Toolkit?
Please see the Author’s Instructions section at the top of the page for more details and information.
How can I get additional information on the indicators used?
Please see the Author’s Instructions section at the top of the page for more details and information.
I added the Liquidity Toolkit but I do not see all of the PT lines – where are they?
Depending on the chart interval, not all PT lines will be displayed. Those lower than the chart’s timeframe are hidden for clarity.
I added Liquidity Toolkit but the chart’s candles are not being filled by LS.
The chart will try to color over LS’ candles if you do not disable them. To disable, go to the Chart Settings then to Symbol and de-select Body, Borders and Wick.

Previous Period High/Low LevelsThis indicator plots the previous day, week, and month high and low levels to highlight key liquidity levels.
Perfect for traders using market structure, liquidity, or SMC concepts.
Features:
Auto-plots PDH/PDL, PWH/PWL, and PMH/PML
Adjustable line styles, widths, and label sizes
Toggle price display on or off
Accurate UTC offset handling

Hidden BreakerHidden Breaker
DESCRIPTION
The Hidden Breaker identifies Order Blocks and tracks their transformation when they interact with Fair Value Gaps. It displays both standard Order Blocks and those modified by FVG (Breaker Blocks) across multiple timeframes within a single chart view.
METHODOLOGY ORIGIN
This indicator is based on concepts from the MoneyTaur trading methodology, which focuses on identifying Order Blocks hidden behind Fair Value Gaps from the multi-timeframe perspective.
WHAT MAKES THIS UNIQUE
- Box Management System: User-controlled box allocation through dynamic filters, ensuring all detected blocks remain visible within Pine Script's 500 box limit. Users can manage which blocks to display through price range and filter adjustments.
- Creates unified columnar visualization
- Processes 70+ timeframes (incl custom)
- Tracks each block's complete lifecycle
KEY FEATURES
Order Blocks (OB): Detects engulfing candle patterns between candle bodies with customizable deviation tolerance.
Breaker Blocks (BB): Order Blocks (candle body) that crossed Fair Value Gaps by 100% without being touched by wicks.
Partial Breaker Blocks (PBB): Candle bodies that didn't fit 100% within an FVG or were partially mitigated by wicks. Min BB size in % after passing FVG is adjustable within filter.
Multi-Timeframe Analysis: Processes 70+ timeframes without repainting
Visual Organization: Displays blocks in columns by timeframe for easy comparison. Spacing is adjustable within menu.
FVG Counter: Shows interaction count (1-5) for each block
Statistics Table: Real-time monitoring of detected blocks
Price Range Filter: Manages Pine Script's 500 box limit effectively
HOW IT WORKS
The indicator uses a three-stage detection process:
Stage 1 - Order Block Detection:
Identifies engulfing patterns where one candle body fully engulfs the body of the previous opposite candle. The system allows for small price deviations. The detected zone spans from the open to close of the engulfed candle.
Stage 2 - FVG Interaction:
Monitors for Fair Value Gaps that occur when the candle's low is above the high from two candles ago (bullish gap) or when the high is below the low from two candles ago (bearish gap). When such a gap overlaps an existing Order Block, the system evaluates:
Checks whether the OB’s body is fully contained within the FVG range (passed 100% through it without wick contact) — shown as 1H | 1, where 1H is the timeframe and 1 the FVG count.
The percentage of the OB body retained within the FVG after zone adjustment is filter-controlled.
Directional bias is inherited from the FVG.
Blocks with multiple FVG interactions (counted 1–5+) allow filtering of BBs based on their FVG overlap frequency.
Stage 3 - Single or Multi-Timeframe Processing:
Collects data from multiple timeframes simultaneously, processes it without repainting, and displays horizontal boxes with timeframe labels arranged in vertical columns, where each timeframe occupies its own designated horizontal space for clear visual separation.
DETECTION CRITERIA
Order Block: Engulfing with body-to-body alignment within adjustable deviation tolerance
Breaker Block: OB that intersects with subsequent FVG. When filter is set to 100%, shows only BBs where the body fully passed through FVG without wick touches.
Partial Breaker Block (PBB): An Order Block partially intersected by an FVG or partially mitigated by a subsequent candle, narrowing the original Breaker Block range.
FVG validation: Gap between candles 1 and 3
VISUAL GUIDE
Green: Bullish Order Blocks
Red: Bearish Order Blocks
Blue: Bullish Breaker Blocks
Orange: Bearish Breaker Blocks
Teal: Bullish Partial Breaker Blocks
Purple: Bearish Partial Breaker Blocks
Numbers: FVG interaction count (1-5)
Percentages: Remaining unmitigated area
SETTINGS
Block Type Selection: Choose to display OB only, BB/PBB only
Deviation (%): Tolerance for engulfing pattern detection
Min Engulfing Impulse (%): Minimum required price movement for valid engulfing
FVG Filter: Set minimum FVG count required (1-5)
Min BB Size after FVG (%): Minimum remaining size of an BB after passing an FVG
Hide if Mitigated More Than (%): Visibility threshold for partially mitigated blocks
Price Range Filter (%): Limit Block detection to specific price ranges from current price
Price Range Axis (%): Offset reference point for price range
Timeframe Groups: Select from 6 predefined groups or custom timeframes
Max Bars to Scan: Historical lookback period (100-10000)
Replay Mode: used for historical backtesting and visual analysis for higher TF data.
TIMEFRAME GROUPS
Group 1: Minutes & Short Hours (5m-4H)
Group 2: Extended Hours (5H-23H)
Group 3: Days (1D-19D)
Group 4: Weeks (1W-12W)
Group 5: Months (1M-12M)
Group 6: 19 Custom timeframes
USAGE NOTES
Select appropriate timeframe groups for your analysis style
Adjust deviation and impulse settings based on market volatility
Use FVG filter to focus on blocks with multiple gap interactions
Monitor the statistics table to ensure box count stays under 500. If approaching limit, narrow the price range filter
Each box shows its description aligned vertically by timeframe
TECHNICAL SPECIFICATIONS
Pine Script Version 6
Default scan range: 5000 historical bars
Maximum 500 boxes per chart (Pine Script limitation)
Non-repainting calculations
Compatible with all markets and timeframes
Optimized memory management for multi-timeframe processing
TERMS AND CONDITIONS
This indicator and its documentation do not constitute financial or investment advice.
Users should make independent trading decisions and accept full responsibility for their outcomes.
Use of this tool implies that you understand the risks of financial markets and agree that the author is not liable for any loss or damage arising from its use.
This indicator is designed solely as a visualisation tool to assist with chart analysis.
It does not teach, promote, or automate any specific trading strategy, concept, or methodology.
All visual elements — such as OBs, BBs, PBBs, FVGs, and related interactions — are intended to support manual study and backtesting, not to generate trading signals.
Past performance does not guarantee future results. By using this tool, users agree to these terms.
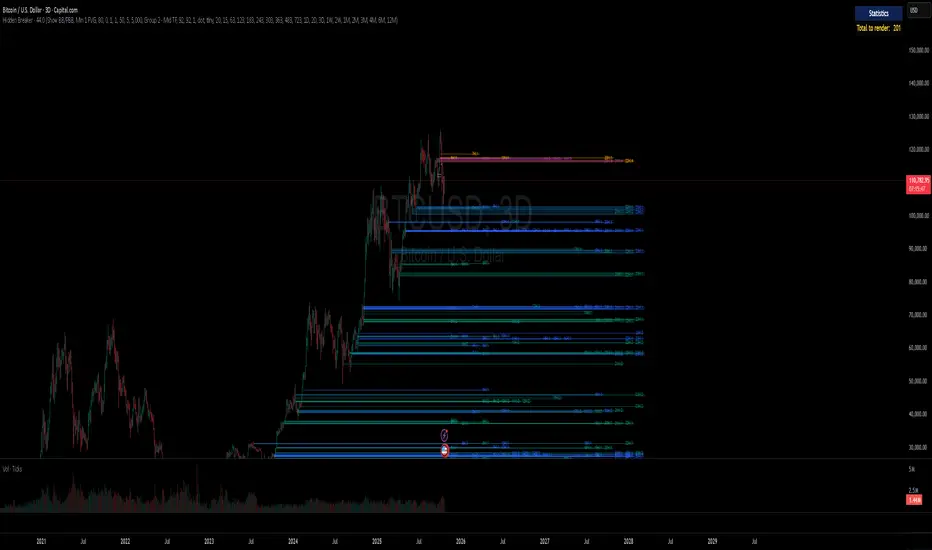
Timeframe LiquidityTimeframe Liquidity – Multi-Timeframe Highs & Lows by
Timeframe Liquidity automatically plots previous day, week, month, and year highs and lows, key liquidity zones used by smart money and price-action traders. These levels extend into the future and can automatically stop once price wicks through, showing clear liquidity sweeps and tested zones.
Perfect for traders using ICT / SMC concepts, liquidity theory, or market structure analysis. Instantly see where liquidity rests, where it’s been taken, and how price reacts at major support and resistance.
Features:
Auto-plots PDH/PDL, PWH/PWL, PMH/PML, PYH/PYL
Custom line styles, colors, and label sizes
Option to stop line on wick (liquidity sweep)
Smart timeframe visibility (hides same-TF levels)
Accurate UTC offset handling
Identify liquidity pools fast, trade cleaner charts, and track where smart money hunts liquidity.
Built for precision, clarity, and confluence.

Volume Surprise [LuxAlgo]The Volume Surprise tool displays the trading volume alongside the expected volume at that time, allowing users to spot unexpected trading activity on the chart easily.
The tool includes an extrapolation of the estimated volume for future periods, allowing forecasting future trading activity.
🔶 USAGE
We define Volume Surprise as a situation where the actual trading volume deviates significantly from its expected value at a given time.
Being able to determine if trading activity is higher or lower than expected allows us to precisely gauge the interest of market participants in specific trends.
A histogram constructed from the difference between the volume and expected volume is provided to easily highlight the difference between the two and may be used as a standalone.
The tool can also help quantify the impact of specific market events, such as news about an instrument. For example, an important announcement leading to volume below expectations might be a sign of market participants underestimating the impact of the announcement.
Like in the example above, it is possible to observe cases where the volume significantly differs from the expected one, which might be interpreted as an anomaly leading to a correction.
🔹 Detecting Rare Trading Activity
Expected volume is defined as the mean (or median if we want to limit the impact of outliers) of the volume grouped at a specific point in time. This value depends on grouping volume based on periods, which can be user-defined.
However, it is possible to adjust the indicator to overestimate/underestimate expected volume, allowing for highlighting excessively high or low volume at specific times.
In order to do this, select "Percentiles" as the summary method, and change the percentiles value to a value that is close to 100 (overestimate expected volume) or to 0 (underestimate expected volume).
In the example above, we are only interested in detecting volume that is excessively high, we use the 95th percentile to do so, effectively highlighting when volume is higher than 95% of the volumes recorded at that time.
🔶 DETAILS
🔹 Choosing the Right Periods
Our expected volume value depends on grouping volume based on periods, which can be user-defined.
For example, if only the hourly period is selected, volumes are grouped by their respective hours. As such, to get the expected volume for the hour 7 PM, we collect and group the historical volumes that occurred at 7 PM and average them to get our expected value at that time.
Users are not limited to selecting a single period, and can group volume using a combination of all the available periods.
Do note that when on lower timeframes, only having higher periods will lead to less precise expected values. Enabling periods that are too low might prevent grouping. Finally, enabling a lot of periods will, on the other hand, lead to a lot of groups, preventing the ability to get effective expected values.
In order to avoid changing periods by navigating across multiple timeframes, an "Auto Selection" setting is provided.
🔹 Group Length
The length setting allows controlling the maximum size of a volume group. Using higher lengths will provide an expected value on more historical data, further highlighting recurring patterns.
🔹 Recommended Assets
Obtaining the expected volume for a specific period (time of the day, day of the week, quarter, etc) is most effective when on assets showing higher signs of periodicity in their trading activity.
This is visible on stocks, futures, and forex pairs, which tend to have a defined, recognizable interval with usually higher trading activity.
Assets such as cryptocurrencies will usually not have a clearly defined periodic trading activity, which lowers the validity of forecasts produced by the tool, as well as any conclusions originating from the volume to expected volume comparisons.
🔶 SETTINGS
Length: Maximum number of records in a volume group for a specific period. Older values are discarded.
Smooth: Period of a SMA used to smooth volume. The smoothing affects the expected value.
🔹 Periods
Auto Selection: Automatically choose a practical combination of periods based on the chart timeframe.
Custom periods can be used if disabling "Auto Selection". Available periods include:
- Minutes
- Hours
- Days (can be: Day of Week, Day of Month, Day of Year)
- Months
- Quarters
🔹 Summary
Method: Method used to obtain the expected value. Options include Mean (default) or Percentile.
Percentile: Percentile number used if "Method" is set to "Percentile". A value of 50 will effectively use a median for the expected value.
🔹 Forecast
Forecast Window: Number of bars ahead for which the expected volume is predicted.
Style: Style settings of the forecast.
