Сoncentrated Market Maker Strategy by oxowlConcentrated Market Maker Strategy by oxowl. This script plots an upper and lower bound for liquidity provision, and checks for rebalancing conditions. It also includes alert conditions for when the price crosses the upper or lower bounds.
Here's an overview of the script:
It defines the input parameters: liquidity range percentage, rebalance frequency in minutes, and minimum trade size in assets.
It calculates the upper and lower bounds for liquidity provision based on the liquidity range percentage.
It initializes variables for the last rebalance time and price.
It defines a rebalance condition based on the frequency and current price within the specified range.
If the rebalance condition is met, it updates the last rebalance time and price.
It plots the upper and lower bounds on the chart as lines and adds price labels for both bounds.
It defines alert conditions for when the price crosses the upper or lower bounds.
Finally, it creates alert conditions with appropriate messages for when the price crosses the upper or lower bounds.
Concentrated liquidity is a concept often used in decentralized finance (DeFi) market-making strategies. It allows liquidity providers (LPs) to focus their liquidity within a specific price range, rather than across the entire price curve. Using an indicator with concentrated liquidity can offer several advantages:
Increased capital efficiency: Concentrated liquidity allows LPs to allocate their capital within a narrower price range. This means that the same amount of capital can generate more significant price impact and potentially higher returns compared to providing liquidity across a broader range.
Customized risk exposure: LPs can choose the price range they feel most comfortable with, allowing them to better manage their risk exposure. By selecting a range based on their market outlook, they can optimize their positions to maximize potential returns.
Adaptive strategies: Indicators that support concentrated liquidity can help traders adapt their strategies based on market conditions. For example, they can choose to provide liquidity around a stable price range during low-volatility periods or adjust their range when market conditions change.
To continue integrating this script into your trading strategy, follow these steps:
Import the script into your TradingView account. Navigate to the Pine editor, paste the code, and save it as a new script.
Apply the indicator to a trading pair chart. You can customize the input parameters (liquidity range percentage, rebalance frequency, and minimum trade size) based on your preferences and risk tolerance.
Set alerts for when the price crosses the upper or lower bounds. This will notify you when it's time to take action, such as adding or removing liquidity, or rebalancing your position.
Monitor the performance of your strategy over time. Adjust the input parameters as needed to optimize your returns and manage risk effectively.
(Optional) Integrate the script with a trading bot or automation platform. If you're using an API-based trading solution, you can incorporate the logic and conditions from the script into your bot's algorithm to automate the process of providing concentrated liquidity and rebalancing your positions.
Remember that no strategy is foolproof, and past performance is not indicative of future results. Always exercise caution when trading and carefully consider your risk tolerance.
Liquiditypool

Buyside/Sellside Liquidity [Real-Time] (Expo)█ Overview
Buyside/Sellside Liquidity (Expo) is an indicator that identifies buy-side and sell-side liquidity in real time. Buy-side liquidity represents a level on the chart where short sellers will have their stops positioned. Sell-side liquidity represents a level on the chart where long-buyers will place their stops. These levels are found in areas where traders are "proven wrong" and, therefore, want to get out of their trades. Smart money will accumulate or distribute positions near these levels where many stops are placed and absorb all provided liquidity.
█ What is Buy-side and Sell-side liquidity?
Liquidity is the ability of a market to absorb large orders without significantly affecting the asset's price. Buy-side liquidity refers to the ability of buyers to buy large amounts of contracts without significantly affecting the price. Sell-side liquidity refers to the ability of sellers to sell large amounts of contracts without significantly affecting the price. This type of liquidity is important for large institutional investors, such as hedge funds and investment banks, who need to buy/sell large amounts of contracts without significantly affecting the price.
█ How to use
The price will always seek liquidity to either reverse or continue in the current move.
Reversals
Reversals are common around these levels since many traders are forced to close their positions, pushing the price in the other direction. Look for price actions that confirm a reversal around those levels.
Continuations
Liquidity is also a must for a trend to continue. If the price pushes through the liquidity levels and the current order flow structure is intact, traders should look for a continuation setup.
Inducement
Inducement is the act where smart money manipulates the price to access liquidity. Buy-side and Sell-side liquidity levels can be used to identify potential areas of inducement.
-----------------
Disclaimer
The information contained in my Scripts/Indicators/Ideas/Algos/Systems does not constitute financial advice or a solicitation to buy or sell any securities of any type. I will not accept liability for any loss or damage, including without limitation any loss of profit, which may arise directly or indirectly from the use of or reliance on such information.
All investments involve risk, and the past performance of a security, industry, sector, market, financial product, trading strategy, backtest, or individual's trading does not guarantee future results or returns. Investors are fully responsible for any investment decisions they make. Such decisions should be based solely on an evaluation of their financial circumstances, investment objectives, risk tolerance, and liquidity needs.
My Scripts/Indicators/Ideas/Algos/Systems are only for educational purposes!

ICT Liquidty H/L [MK]indicator shows liquidity levels at pivot highs and lows on the chart timeframe. Levels are drawn as a horizontal line up to the last active bar. Once a level has been passed through, the level is highlighted. The liquidity level will remain highlighted until a pre determined amount of bars have closed after the level was passed. These liquidity levels can be used as targets for trades, or as potential reversal points. Liquidity (or resting orders) at key pivot points form a key part of the ICT trading system. Users can configure the indicator to display the untapped liquidity levels, or they can be completely hidden until they are passed through.
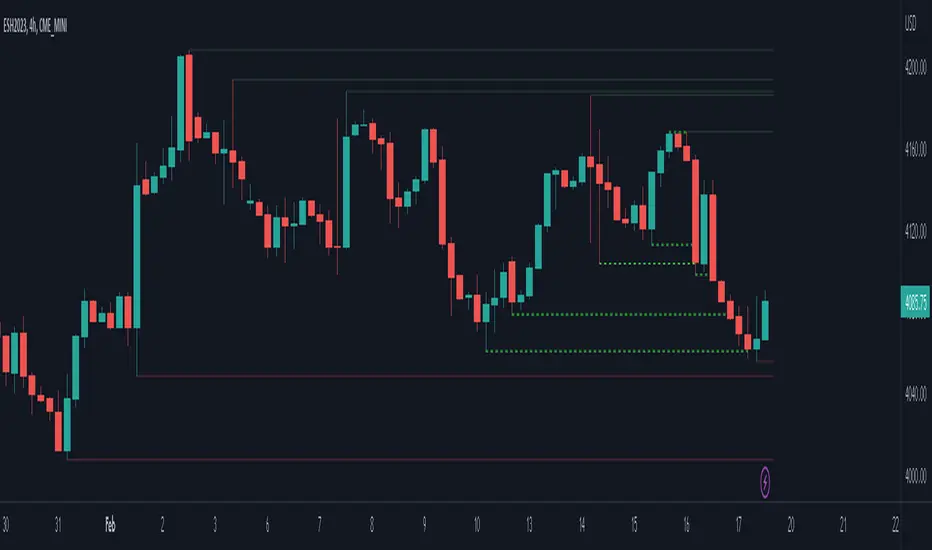
Liquidity Hunter - FattyTradesThis indicator is used to automatically identify and plot two forms of liquidity that will be targeted by market makers.
The first form of liquidity is based on multi-time fame highs and lows. It plots 1H, 4H, D, W, & M liquidity on an intraday chart to make it easier to identify. I believe hat liquidity is what drives the market and the most common form of this liquidity can be identified through higher time frame highs and lows. You can use whatever method you prefer to determine which liquidity pool will be targeted. When the liquidity is purged, it will be shown as dotted lines. This should not be used as traditional support/resistance, but rather as targets for the market.
The second form of liquidity is in the form of imbalances or fair value gaps. You can select a higher time frame to be plotted along with the current time frame you're viewing to identify imbalances that will likely be targeted intraday. We know that higher time frame fair value gaps work equally well as targets for market makers. When a higher time frame FVG is broken into, it can also act as a very powerful form of support and resistance. By default, when a fair value gap has been mitigated it will be removed from the chart, however this can be disabled.
Between these two forms of market maker liquidity targets on the chart, it will be easier to formulate a thesis intraday to determine where the market will move. It can help minimize the amount of switching between higher time frames that needs to be done, allowing you to identify targets while trading on your favorite intraday time frame for optimal risk/reward.
In the near future, I will build in alerting mechanism to alert when liquidity on higher time frames as been purged/mitigated.

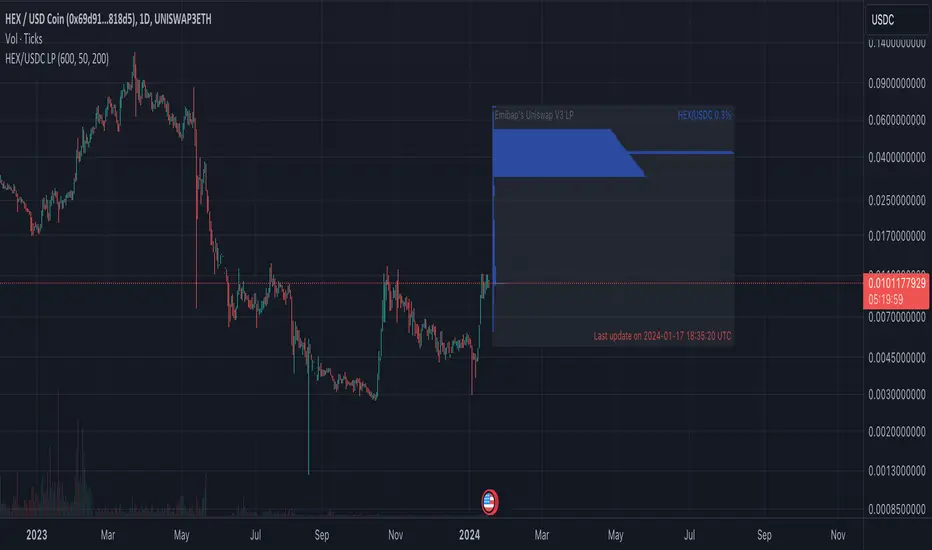
Emibap's Uniswap V3 HEX/USDC 3% Liquidity PoolThis script will display a histogram of the Uniswap V3 HEX / USDC 3% liquidity pool.
Similar to what you can see in the liquidity section of the Uniswap pool page but conveniently rendered alongside your chart.
It's meant to be used on any HEX / USDC chart only.
One of the main motivations for using this in your HEX / USDC chart is to get an idea of the current sentiment: If most of the volume is below the price it might be an indication of an upcoming move up, for instance.
I'll try to update the liquidity regularly; if possible several times a day.
Using the 4h, daily, or weekly time frames is highly recommended.
The options are straightforward:
Histogram bars color. Default is blue
Histogram background color. Default is black at 20% opacity
Upper price limit of the diagram: Visible upper bound price limit for the histogram, based on the current price. I.E: 200%: If the price is 1, the histogram will show 3 as the upper bound
Lower price limit of the diagram. Visible lower bound price limit for the histogram, based on the current price. I.E: 99%: If the price is 1, the histogram will show 0. 01 as the upper bound
Width of the widest bar: Width (in bars) for the widest bar of the histogram. The more the higher resolution you'll get
Liquidation Levels V2 (Ultimate Edition)!(version 2.0) - Covers ALL pairs from Binance futures (USDT)!
The Liquidations Level Indicator is a new, fresh and innovative indicator that adds a new perspective into the charts.
The indicator plots (in real time !), the liquidation points/levels that are "created" for every new position that is currently opened in futures trading of a cryptocurrency.
The calculation and the plots work for both directions (either longs or shorts).
How it is done: We calculate all new large positions opened by other traders, by taking into account the Open Interest from major exchanges.
For each new large position that is opened, the indicator plots in the chart the liquidation levels for the specific position per leverage level (100x, 50x or 25x).
This is exactly what the Market Maker knows!
In crypto, the Market Maker, tends to push the price to these levels, making these levels targets.
You could combined it with any other Technical Analysis indicator you used to trade.
Add it to your favorites indicators and enjoy the price action. You will soon realize that our indicator can be a game-changer indicator !
Soon, we will add some here in TradingView, some ideas and strategies that we have already used with this indicator with success.
Here, a new game starts for you..and the Market Maker. Don't trade against him, trade with him (!)
_____________________________
Notes:
_____________________________
1) Second version supports allt the USDT crypto that are tradable on Binance futures (at least).
Right now you can use any of them (e.g. BTC , ETH, BNB, XRP, ADA, SOL, DOT, DOGE, MATIC, LTC, ATOM, , etc. )
paired with one of the above stablecoins:
USD, USDT, USDC , or BUSD.
2) You can adjust the lower limit to take into account for new positions (total amount is in millions USD/USDT/ USDC ), so you can filter the positions and display only the large ones.
This adjustment is up to you and it is different for each coin, as they have huge differences in Total Market Cap and the Total amount trading per day.
BTC is almost always first, and then ETH, Luna, etc. From our experience a amount of 5m in USD fits for BTC , 2m USD for ETH, and you can of course switch it.
3) Don't use the indicator with any other pair, except the above ( /USD, /USDT, /BUSD or / USDC ). The Open Interest is calculated per USD, so if you project this over a crazy pair (e.g. BTC /LTC) it will not project anything.
4) Initial version supports reading the Open Interest from Binance. Upcoming versions will expand this, as an option.
_____________________________
Extras:
_____________________________
This was our first effort to build something for the crypto community, that can be useful and of course free.
We hope we like it. If you like the indicator, just spread it.

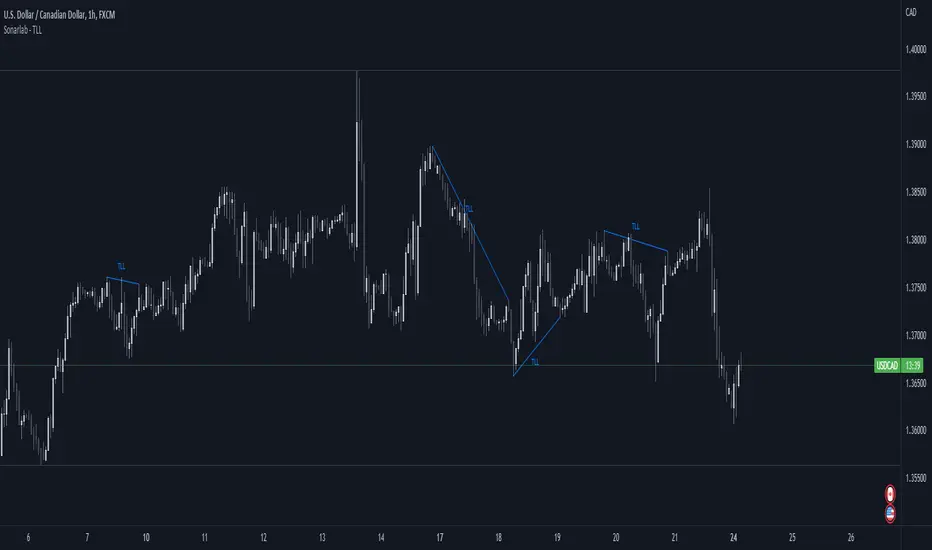
Sonarlab - Trendline Liquidity Indicator**This is not a normal Trend Line Indicator**
Most of the concepts we get thought online are to good to be true. Buy and sell off the touch of the trend line and you will be winning! You probably find out already that this ain't the way to trade. Trend lines mostly gets broken and you will be taken out.
he reason behind this is that the trend lines sparks the interests of Institutions. They use those area's to stop people out and use them as fuel for their positions: Liquidity.
TLL: Trend Line Liquidity
Lets show you an example on how to use these TLL markings 👇
In this example above we can see a beautiful example of the TLL indicator mapping out the TLL. The Imbalance Indicator shows us with the BPR (balanced price range) there is a sign of going short. The other confluence we can add is the TLL, which price likes to clear in these situations.
In this other example we also see two TLL resting on top. We see that price tried to break the SL (swing low), but the fake out detection showed us this was a grab on liquidity. After that we can see that on the LTF we get a displacement and we can assume that price is going to target the TLL.
Another example where price cleared the TLL and used is a targets.
This indicator will map the Trend Line Liquidity for you, so you are more aware of the liquidity that is resting around you. The Indicator has the following inputs:
Sensitivity A lower sensitivity create smaller trend lines, where a higher sensitivity creates bigger trend lines.
Display limit : The amount of lines you want the indicator to display
Line type/ text size (styling options)
Liquidity Heatmap (Nephew_Sam_)Liquidity Heatmap
This indicator plots a heatmap of resting liquidity above and below swing lows and multiple timeframes
The darker the color is or the larger the zone is, the more liquidity is lying there. If you think there are too many zones, you can increase the timeframes in the settings or just disable it.
Liquidity simply means orders such as stoplosses, buy/sell stops.
Disclaimer: You are free to use this code but your should be open source too

Liquidity Pools (Nephew_Sam_)This indicator makes use of Pivot Points to identify liquidity pools. This simply means, highs and lows that the price should eventually take out (go towards) before reacting.
In this current version (v1), I implemented multi timeframe pivot points, each with a custom line style and color.
The x left/right bars are used to identify swing points, the number provided will find the highest/lowest candle in the provided left/right bars.
Upcoming
In the next update(s) we will add more features like - identifying relative highs/lows, closest liquidity pools, extending lines, adding labels etc

Liquidity mapLocate institutional daily, weekly, and monthly liquidity intervention zones in an innovative format that allows you to fractalize the degree of trend reversal opportunity across multiple lengths!
Far from the traditional formats to tell you "where's the high/low", we display with this map the grab levels relating to the amplitudes of the measured period.
You can check "show old levels" to backtest these potential fractal reversal areas.
Use the levels that interest you according to your working UT (scalping, intraweek, swing, etc.), or take all the elements into consideration for your trading management :
Confluence the information to optimize your entry and shelter your stop loss under strong levels rejections !
Default parameters are: display high/low weekly & monthly, display liquidities levels in daily.

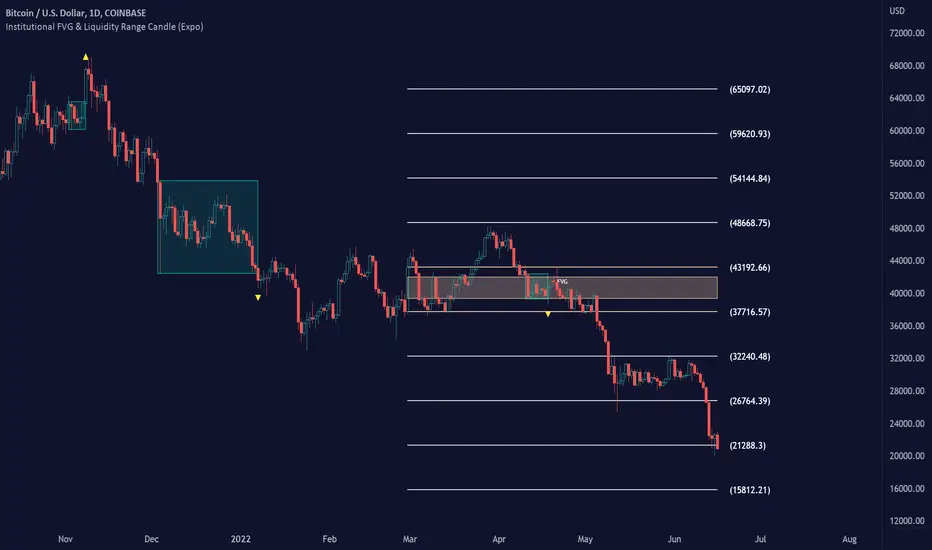
Institutional FVG & Liquidity Range Candle (Expo)█ Institutional FVG with predicted SR levels & Liquidity Range Candle is an indicator that uses Smart Money Concepts to give you the insights needed to make informed decisions based on the theory in SMC. This premium toolkit work in any market and timeframe.
█ Institutional Fair Value Gap , also known as imbalance, inefficiencies, and Liquidity void, identifies the most significant FVG within the lookback period. This is often referred to as Institutional Fair Value Gap since only big players can cause these liquidity voids.
Fair Value Gap, Liquidity voids are sudden price changes without enough liquidity at a stable price, and the price jumps from the originating price level to the final price level, creating an imbalance in price.
The price tends to fill or retest the FVG area, and traders understand at which price level institutional players have been active. FVG is a valuable concept in trading, as they provide insights about where many orders were injected, creating this inefficiency in the market. The price tends to restore the balance.
This indicator highlights the most significant Fair Value Gap on the chart and plots predicted future support and resistance levels based on the price action created at the FVG. A super simple and yet effective way to get solid market levels that acts as a magnet for the price.
█ Liquidity Range Candle is another trading concept used by large market players where they manipulate the price to stay inside a specific market area, creating a tight consolidation zone. Once the price breaks the liquidity range, liquidity flows into the market. It's an easy way to grab liquidity from retail traders. Stop losses are triggers, breakout traders jump into the market, and institutional traders absorb the liquidity.
If you don't see the liquidity, you become the liquidity!
A break of a liquidity range is a sign of a breakout, potential continuation, retracement, or reversal. Use it together with an overall market analysis. It's common that traders also mark the previous 1-3 liquidity ranges and plot them into the future. These zones can act as a future magnet for the price, and we can get a retest of the zones, or if we break above/below a previous range can be a sign of a trend change. We also know that these liquidity ranges have been important levels for institutional players, who may be willing to accumulate or distribute more orders at these levels.
█ HOW TO USE
Use the indicator to identify several important and commonly used trading concepts taught within the SMC.
Find Significant FVG
Find Significant liquidity ranges
-----------------
Disclaimer
Copyright by Zeiierman.
The information contained in my Scripts/Indicators/Ideas/Algos/Systems does not constitute financial advice or a solicitation to buy or sell any securities of any type. I will not accept liability for any loss or damage, including without limitation any loss of profit, which may arise directly or indirectly from the use of or reliance on such information.
All investments involve risk, and the past performance of a security, industry, sector, market, financial product, trading strategy, backtest, or individual’s trading does not guarantee future results or returns. Investors are fully responsible for any investment decisions they make. Such decisions should be based solely on an evaluation of their financial circumstances, investment objectives, risk tolerance, and liquidity needs.
My Scripts/Indicators/Ideas/Algos/Systems are only for educational purposes!
Liquidity Raid - Stop HuntLiquidity Raid - Stop Hunt
The market always seeks liquidity. Liquidity rests above previous highs and below previous lows as many traders see these as obvious points to place their stops. These are areas in the chart where many orders are placed together and serve as tipping points for market makers.
The script marks the breach of a market structure high/low with a vertical line. The script has the option to show the current W,D,4H & 1H market structure high and low.
How to use:
Once a raid occurs, use a higher timeframe to search for high probability supply and demand zones. Price needs to react to something. You may have multiple breaches before a reversal happens as price is likely looking for fresh(untested) zones. So don't trade blindly.
A good understanding of supply and demand concepts, odds enhancers, and how to identify fresh levels is expected to utilise it's full potential.
Lines and colours are all customizable
Alerts function included.
Indicator in use:

Liquidity Pool - TradingEDThe use of this indicator is restricted to private use, and it can be used only by invitation. Different functionalities have been added to the original codes, such as alerts and signals that seek to make trading much easier to interpret by any type of trading operator of any experience level, from beginner to intermediate and advanced .
Key components:
• Follow the liquidity levels, as they are going to attract the price sooner or later.
• Never open positions opposite to a liquidity level’s direction.
• During the price movement towards a liquidity level, there appears a high probability to cross that level.
• When a liquidity level is crossed, the reversal movement is quite a frequent consequence, as major players are not interested in a level anymore.
When support and resistance levels are held for a long time, the highest liquidity is cumulated above or below those levels, so this is why "Liquidity pools" occur around key support and resistance, or areas on the chart where a lot of trading activity takes place. If you trade, you need this trading activity to get your order filled. Most retail traders don’t have to worry about liquidity when it comes to getting filled. In fact, even some professional swing or trend traders may not have to worry about it. A string of order types cumulates an asset’s liquidity there. This is why investors drive prices into those areas, creating new liquidity levels.
Main functions of this indicator:
1) The SOURCE for the counts can be determined by the trader (close, open, etc).
2) The MEASURE can be based on a CANDLES count if you are trading OHLC Charts from 1D onwards, or if your trading is intraday, you can also select counts by MINUTES, HOURS or DAYS, depending on your trading style.
3) LENGTH, by default it will be loaded as in the STRATEGY, but considering the previous point, you can modify it according to your convenience.

HTF Liquidity Levels█ OVERVIEW
The indicator introduces a new representation of the previous days, weeks, and months highs & lows ( DWM HL ) with a focus on untapped levels.
█ CONCEPTS
Untapped Levels
It is popularly known that the liquidity is located behind swing points or beyond higher time frames highs/lows (in a sense, an intraday swing point is a day high/low). These key areas are said "liquid" because of the accumulation of resting orders, mainly in the form of stop-loss orders. And this more significantly on higher time frames which have more time for stacking orders. As the result, the indicator aims to keep track of untapped levels that have their liquidity states intact.
Liquidity Pools
Once a liquidity level identified, or better, a cluster of liquidity levels work as magnets for the market. The price is more likely to make its way towards heavier pockets of liquidity, by proximity (the closest liquidity pool), and by difficulty (path with less obstacles). This phenomenon is referred as liquidity run, raid, purge, grab, hunt, sweep, you name it. Consequently, the indicator can help you frame a directional bias during your trading session.
█ NOTES
Drawings
Once a level is tapped, it is highlighted. At the end of each day, all tapped levels are cleared.

Liquidity_Zone by SebasVentuLiquidity_Zone by SebasVentu It is a strategy that shows the liquidity zones and also has a simulator
Es una estrategia que muestra las zonas de liquidez y ademas cuenta con un simulador

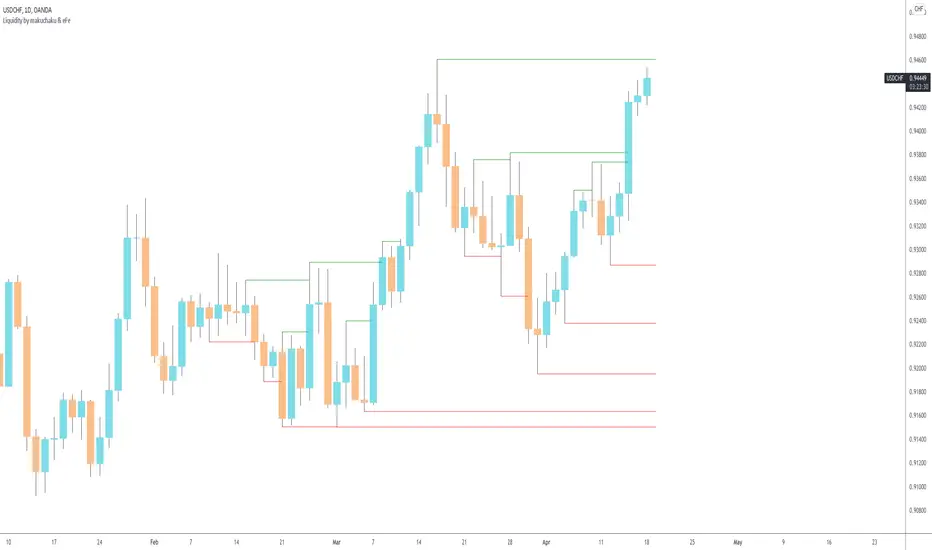
Makuchaku's trading tools - Liquidity visualizerThis indicator plots those pivots/fractals which have not been taken out by price, whereby showing where are the clusters of highs/lows where stop orders (or liquidity) could be hiding.
This is a fantastic tool for taking reversal trades.
Demand & Supply Zones [eyes20xx]Demand & Supply Zones
This indicator helps to identify large moves driven by institutions.
What qualifies as a zone?
If the price moves (open to close) by more than a certain % in one candle or in a bullish / bearish run of candles, the zone is marked as a Demand or Supply zone .
0.8% is good for Crypto and Forex might be better with 0.4%. Play around with the % to match your requirements.
Active zones
A zone remains active until it is hit by the price. When it becomes inactive, the zone background becomes transparent.
Zone lines
Lines are displayed if the zone is active and within a certain % of the close. 3% is a good setting for Crypto.
A maximum of two lines are displayed for each zone type.

PT LiquidityVersion 1.0 of our Liquidity indicator helps determine areas where price might gravitate to fill liquidations. We have six levels of interest, broken down into three levels for shorts (highlighted in red) & three levels for longs (highlighted in green). Each level is labeled 25x, 50x, 100x. We added a cloud for a visual to assist in short/long liquidation zones. You want to be taking short setups at the top of the cloud when shorts get squeezed & taking long setups at the bottom of the cloud when longs get squeezed. The indicator has a proprietary formula that allows the levels to change based on volume and time frames. The levels are generated in real-time with a rolling VWMA.
Strategy:
If you are scalping, price tends to ping pong between the 50x & 100x longs (green) to 50x & 100x shorts (red). If we shift outside that zone, consider the trend to have changed. Look at a higher time frame (12h+) for trend direction. Price usually reverses when the daily takes all three liquidation levels. You want to see a strong reaction (wick) once we tap that last liquidation level.
This Oscillator was built around our buy sell indicator & it is used on all time frames for swinging & scalping. It is included as part of the library. Just message us for access!

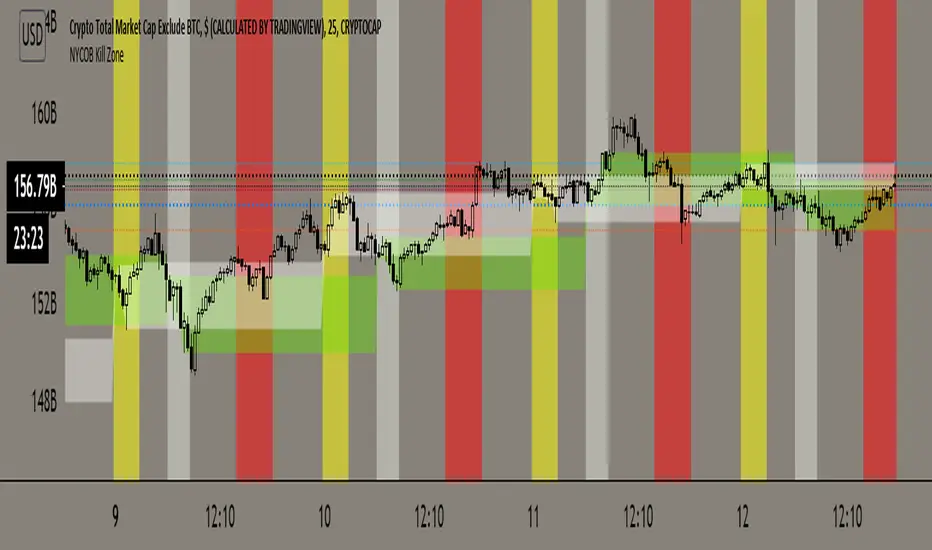
NYCOB Kill ZoneThis script plots the H and L of the first 2 hours of the NYC session and shades the space between in which i deem the NYC Order Block
It also maps out the First two hours on the chart as well so you can understand when the OB has formed
Over the past 3 years of trading cryptocurrency i have noticed a phenomena that has occurred nearly every day
The H or L will 90% of the time will be posted in the first two hours of this session
knowing this means you understand if you just wait til this time you can better your odds at not getting stop hunted due to poor entry
A few things to take from this study are these.
1. after the OB is formed
2. whichever side gets taken out first (H/L) will 90% define the bias for the day. I have found that using the m13-m15 TF will add some more confirmation with 1-2 closes outside of range H/L/
3. After general bias has formed 2 things can happen
A) PA just takes off and there is really nothing you can do about it unless you had other studies that told you that will happen
B) PA will dip back INTO the OB and create the OTE which is any retracement below the .5 Fibonacci of the shaded OB
4. Typically OTE happens after the session has ended
5. If you used OTE off of the past days NYCOB then you can use the new (forming or just formed) NYCOB to CONFIRM your initial bias presented from the previous days OTE and bias.
6. When PA cannot close outside the NYCOB it presents a range to range play where PA will visit the opposite side of the range to chase liquidity,
7. When the NYCOB is TIGHT then deviation is more likely to result in price expansion, when the NYCOB is WIDE then deviation tends to present more range to range plays.
8. After bias is formed and OTE has been made your stops should always be outside the NYCOB. I use the m30 or H1 ATR to get a slight cushion from the OB to ensure i dont get stop hunted.
AS of now this about all the information i have but i will continue to update this list in the comment section as more studies and results have been posted.
DM me on how to attain access.
Cheers
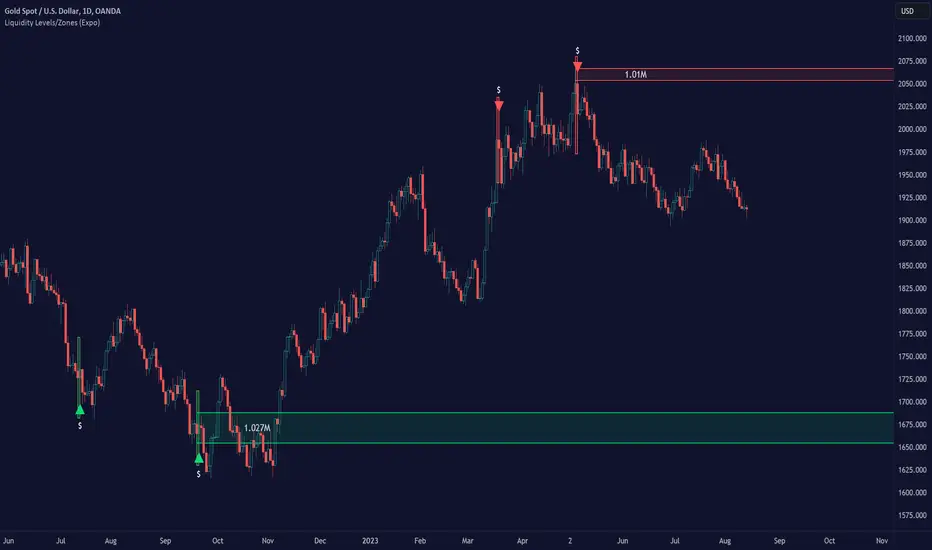
Liquidity Levels/Zones (Expo)Liquidity Levels/Zones (Expo) automatically identifies and displays key liquidity levels/zones.
Liquidity describes the extent to which an asset can be bought and sold quickly, without affecting the price. It is a measure of how many buyers and sellers are present, and whether transactions can take place easily.
Levels/Zones are displayed where there is a significant level of trading activity and when there is both high supply and demand for an asset, security, or contract. These levels can leave clues for future price behavior and act as support/resistance zones. The trading activity can confirm the existence, or a continuation, of a trend or a trend reversal.
The user can modify the settings so that short- term, medium-term, and long- term liquidity levels/zones are displayed.
The indicator can be used standalone or as a part of your current trading strategy.
Real-time
No repainting
Works on any market
HOW TO USE
1. Use the indicator to identify key liquidity levels/zones.
2. Use the indicator to identify high trading activity.
3. Use the indicator to confirm the existence, or a continuation, of a trend or a trend reversal.
INDICATOR IN ACTION
1-hour chart
I hope you find this indicator useful , and please comment or contact me if you like the script or have any questions/suggestions for future improvements. Thanks!
I will continually work on this indicator, so please share your experience and feedback as it will enable me to make even better improvements. Thanks to everyone that has already contacted me regarding my scripts. Your feedback is valuable for future developments!
ACCESS THE INDICATOR
• Contact me on TradingView or use the links below
-----------------
Disclaimer
Copyright by Zeiierman.
The information contained in my scripts/indicators/ideas does not constitute financial advice or a solicitation to buy or sell any securities of any type. I will not accept liability for any loss or damage, including without limitation any loss of profit, which may arise directly or indirectly from the use of or reliance on such information.
All investments involve risk, and the past performance of a security, industry, sector, market, financial product, trading strategy, or individual’s trading does not guarantee future results or returns. Investors are fully responsible for any investment decisions they make. Such decisions should be based solely on an evaluation of their financial circumstances, investment objectives, risk tolerance, and liquidity needs.
My scripts/indicators/ideas are only for educational purposes!
MR Liq lvlHi Guys!
- This script show you liquidations levels with leverage of 100X, 50X, 25X & 10X (shorts & longs).
- This indicator "only" works for XBT on Bitmex.
- Other indicators only show the liquidations up to 25X .
- The idea of this indicator is to help the user to determine those levels where Bitmex hunt liquidity.
Best Regards.
Mr.amin

