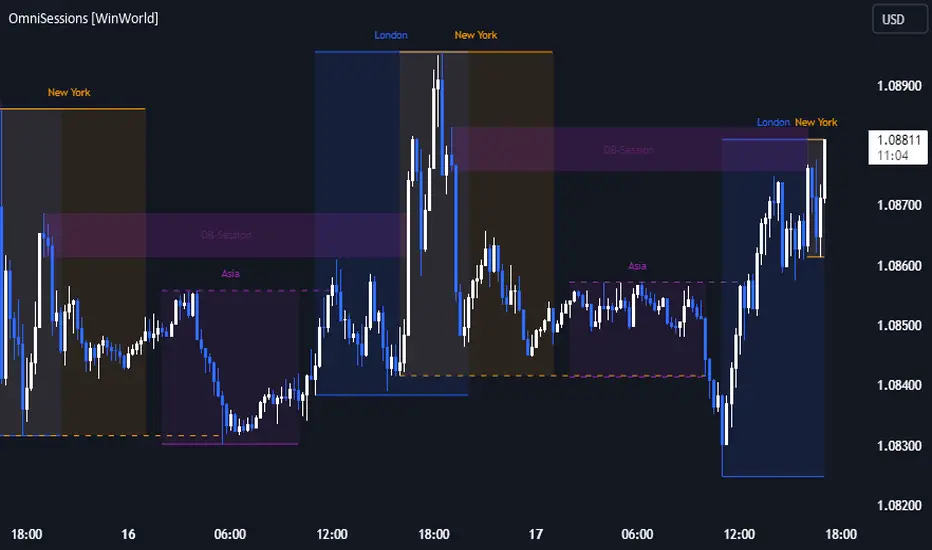
OmniSessions [WinWorld]The indicator shows the range of 4 most popular sessions (New York, Tokyo, London, Sydney). Sessions are used to identify zones with maximum volatility, as well as to find entry points. Session boundaries can act as POI no worse than OrderBlock.
In addition to sessions, you can use settings with KillZones - a range within a session that has potentially high volatility.
Silver Bullet is a more advanced range that allows you to identify the potential for maximum volatility. Excellent entry points can be obtained on the sweep of the range or from the nearest orderblock. We will explain it a bit deeply below.
Why use sessions?
During specific sessions big financial instutions from specific parts of the world enter the market, and this fact alone let us find the most "liquid" sessions in order to catch the best price movements. If talking about orderblocks, it is just a point of interest (more precisely, it is actually a zone of interest), which usually is a zone where the signficant amount of limit orders lies, and when price enter such zone, it immediately shows a strong reaction with either breakout from this zone or it bounces against this zone.
How is this indicator different from others?
There a lot of orderblocks indicator out here publicly available, but huge portion of them doesn't take into calculation important smart money concepts, such as valid pullbacks, for example. Valid pullbacks is a concept of price movement, which lets us indentify quite precisely price's impulses. Based on this impulses, we search our orderblocks. This approach allows to catch the most relevant and highly liquid orderblocks, which present traders with best trade entry opportunities, because usually, when entering with these orderblocks, you follow the moves of big money players, and that gives trader an edge in trading. None of open-source indicators uses such approach ( we've studied all of them ). Also an important notice: no public code is utilized in this indicato whatsoever. We've build our own flexible session mechanism, which allows you to quickly change between different type of sessions and also choose which session to use. And the big thing is our own alorithm to deal with asset, trading sessions of which are quite exotic (such as DAX and MEOX indexes, which close and open at different times of the day, which makes it hard for indicator to catch by default), so with indicator you can enjoy trading by sessions with no "bugs".
And the most user-desired and important thing: we've implemented feature to set winter and summer seasons for sessions, and this solves life-long struggle of traders to set correct trading session time, when forex exchanges switch trading hours, so now you don't need to info which our summer or winter is traded by, but just switch between seasons by one button in our indicator. And we can proudly state, no sesions indicator in the TradingView has such feature , so feel free to use it now on our indicator.
How orderblocks are built?
When London, New York or Asia ends, we find the closest orderblocks above and below closed session's high and low respectively. We do it by finding so called valid pullbacks ( was explained above ), then searching for valid fair value gap (FVG), that is inside of some valid pullbacks, and if we find it, then the orderblock is established and you will live orderblock and fair value gap (FVG) box ( both are colored in closed session's colour ).
How are orderblocks and FVG displayed on the chart?
Live orderblock and FVG are displayed as boxes on the chart, that are plolonged each bar if price didn't reach the orderblock.
Some important details:
When price touches FVG, FVG then is modified to reflect how much of untouched FVG is left. You will see it as decreasing of FVG box size in live mode. If price fully takes over FVG, FVG deletes;
When price touches orderblock, orderblock stops being prolonged and stays on the chart and is considered as worked-out.
These featues allow you to fully see live orderblocks and FVGs (if they exist) and already worked-out orderblocks to see how useful they were in the history.
Is that it?
No, because our indicator also shows sessions sweeps, which is historically a good indication that price grabbed the liquidity of previously closed sessions and now has enough "power" to do big movements, which is a good thing for traders, because it allows them to catch big movements and profit big.
Ok, we've covered the basics, now let's talk about what exactly this indicator can do.
OmnISessions is all-in-one sessions' indicator, that cointain:
Sessions (Automatic adaptation to your time zone)
Kill Zones
Silver Bullets
Session Sweeps
Order Blocks (Session, Killzone, SilverBullet)
Easily switch between summer and winter seasons
Now you don't need to look for opening and closing times of stock exchanges: the algorithm itself adjusts the session times according to your timezone. Just change the seasonality: winter/summer and the session times will be clearly displayed on your chart.
A quick view of the settings:
Show: Sessions, KillZones or SilverBullet
Season selection: Winter/Summer
Session Color Selection
Visuals:
Show/Hide session name - displays session name (ex.: London, New York, Silver Bullet and etc.) on the chart;
Show/Hide session box - displays session range as box with coloured background on the chart;
Show/Hide High/Low sessions - displays two horizontal lines for higher and lower borders of the session;
Show/Hide OrderBlocks - displays worked-out orderblocks in the history with live orderblocks and their fair value gaps (FVGs);
Show/Hide live Session High/Low - displays higher and lower border of the session as lines, that are prolonged each bar even after the session ends;
Show/Hide Session Sweeps - displays session sweeps of higher and lower border as dotted line;
Dividers (alternative session display):
Horizontal Divider
Backgrounder coloring
Customization: choose the display type: Sessions, Killzones or Silver Bullet.
The indicator displays orders that are above or below the previous session boundaries.
Below are Killzones with Order Blocks:
And this is Silver Bullet with Order Blocks:
Overall, you can clearly see that orderblocks, sessions sweeps and different type of sessions in one indicator allow you to fully utilize your time and mental energy, because finding orderblocks with valid pullbacks by hand is quite time-costly task, but finding them on different type of sessions, while not knowing trading hours of current trading session, is the true hell of work. OmniSessions indicator performs all of these calculations by itself, so you can focus on finding the best entries, while checking the situation on different sessions at the same time.
We hope that you will find great use of OmniSessions!
London
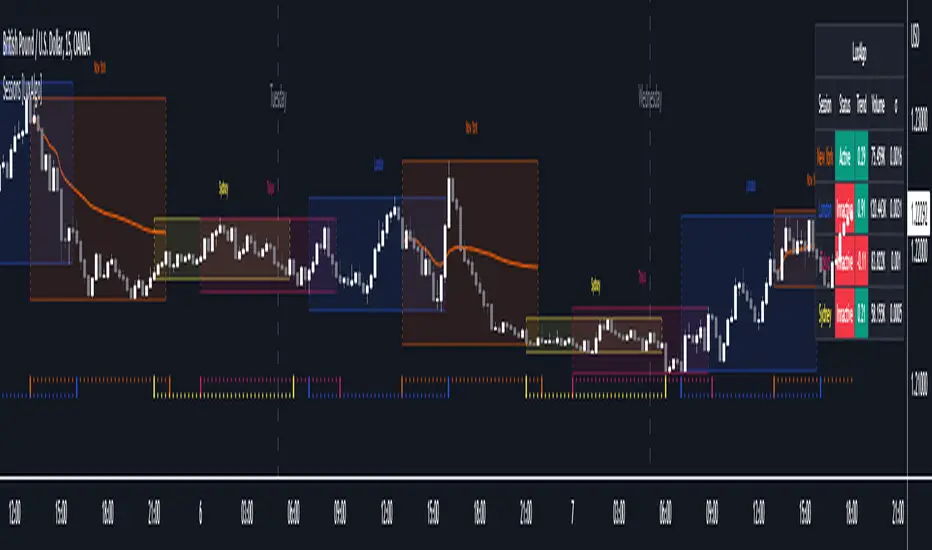
Sessions[Lenny Kiruthu]The script below is designed to show up to 4 different trading sessions i.e. London, New York, Tokyo and Sydney sessions, it also displays the days each session is taking place in as well as two horizontal lines one for the previous days high and the other for the previous days low.
It also displays a table that shows the user the highest and lowest price for 4 different currency pairs the previous day as well as their current prices and below it a confirmation row that shows whether price is currently above, below or within yesterdays range. Note that it only states "High Broken" or "Low Broken" if the current close is above or below the lines.
What you can change
Your time zone for example GMT -4 or GMT +3
The session start and end time
The colors, border type and border width of the session ranges
Displaying the table
Ability to choose the 4 symbols to view on the table

Sessions - AlgoLabA script in UTC for London, New York, Tokyo, & Sydney sessions.
Recommended on any timeframe < 1H.
---
Using this script, a box is plotted on the opening candle of each session; this can show us valuable areas on each chart where price may mediate to show a standing move.
You may also select each of the session boxes, in the settings; this will show you a box of the opening, low, high, and close of each selected sessions.
Each and all boxes are closed at the end of each session.
-The script produces a time table that will show you when each session occurs, and if the current time is within one of those sessions.
---
On this chart you can see boxes formed on the opening candles of the sessions,
London is red, New York is blue, Sydney is green, Tokyo is yellow.
-A key point to notice, before using this script, is how price may mediate around each box, before causing a move.
-Some boxes may be larger / smaller than others, due to the size of the opening candle.
---
Lots of updates to come, any recommendations? Feel free to leave a comment.
Hope it helps, enjoy!

Sessions [LuxAlgo]This indicator shows when user set sessions are active and returns various tools + metrics using the closing price within active sessions as an input. Users have the option to change up to 4 session times.
The indicator will increasingly lack accuracy when the chart timeframe is higher than 1 hour.
Settings
Sessions
Enable Session: Allows to enable or disable all associated elements with a specific user set session.
Session Time: Opening and closing times of the user set session in the hh:mm format.
Range: Highlights the associated session range on the chart.
Trendline: Returns the associated session trendline on the chart.
Mean: Returns the associated session mean average on the chart.
VWAP: Returns the associated session volume weighted average price on the chart.
Ranges Settings
Range Area Transparency: Transparency of the area highlighting sessions ranges.
Range Outline: Highlights the borders of the session range area.
Range Label: Shows the session label at the mid-point of the session interval.
Dashboard
Show Dashboard: Enables sessions dashboard on the chart.
Advanced Dashboard: Returns more information regarding user set sessions on the dashboard.
Dividers
Show Session Divider: Highlights active sessions using intervals on the bottom of the chart (this can lead to less responsive charts)
Show Daily Divider: Highlights days on the chart.
Usage
This tool is versatile and allows the user to perform a wide variety of tasks all focusing on highlighting and analyzing price movements within a specific user set session in a periodic fashion.
Significant forex trading sessions are used by default, but the users are free to choose the opening and closing time of their choices.
Using ranges can indicate which sessions returned the most volatile price movements.
Trendlines can be useful to estimate the underlying trend of a specific session, but they can also offer a quick way to see which session started a trend reversal.
The session Mean highlights the equilibrium level within a session, extrapolating these levels can provide potential support and resistances levels of interest.
Finally, users can use the sessions VWAP's for real time applications, using them as trailing supports and resistances.
Using The Advanced Dashboard
The advanced dashboard returns useful information regarding the user set sessions. Each dashboard elements are described below:
Status: Highlights whether the user set session is active (open) of inactive (closed).
Trend: Shows correlation coefficient between the session prices and a linear sequence of values. Values above 0 indicates an up-trending session, while values under 0 indicates a down-trending session. Values closer to (1, -1) indicates a more trending session.
Volume: Shows accumulated volume within the session
σ (Standard Deviation): Shows standard deviation of the session, while this value is not bounded it can be useful to compare it with the other ones to see which session was the most volatile.
Note that when a session becomes inactive the value on the dashboard will hold until the specific session becomes active again.
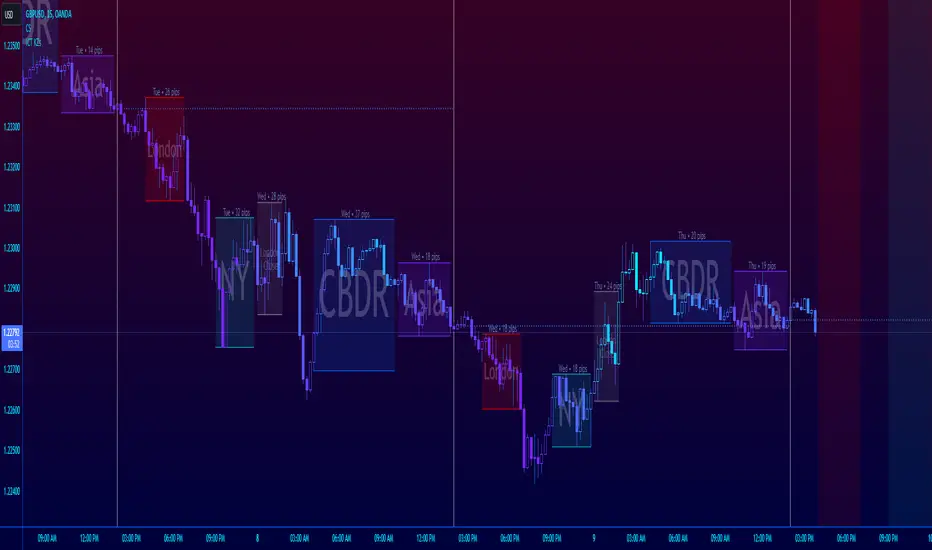
ICT Session Killzone Boxes & DeviationsICT Killzone Sessions Boxes & Deviations is a convenience indicator that marks out past and future ICT killzones for Asia, London, and New York, London Close and CBDR.
The boxes highlights the highest and lowest candle opens of that session/killzone, which is what the deviations are based on. Two lines mark out the highest high and lowest low of that session.
This indicator also includes New York midnight opening price and a vertical divider showing you that time.
Future killzones are also marked out.
All times are set to GMT-4 so these boxes should work across most exchanges. Times and code can be changed if a few don't match up.
Included are week of day labels for your convenience.
For those who are unfamiliar, ICT Killzones are optimal times to look for trades during or before a session, often providing entry for trades with orderblock tests, FVG fills or stophunts.
Please note: This indicator only works well on 1HR timeframe and below. The default max timeframe setting is set to 15min, which can be changed in the menu.
There may be some bugs so please highlight anything you find in the comments below :)
Shout out to @Ryazn for all the ideas!
All Forex Sessions in One Script OnlyDraws all Forex Sessions:
*it works only with forex*
These Sessions can show Daily Highs and Lows:
- Pre-London / London
- Pre-New York / New York
It's possible to hide Highs and Lows having full background for these sessions
Daily Session Breaks
- Mondays use a different color
- Asian Boxes every day
- All Sessions Ranges/Colors are editable
-All elements (pre-London/London/Pre-New York/New York/Asian Boxes/Session Breaks) can be switched off independently

AltSessionHello World
It’s no secret that trading sessions play a massive role in market movement and liquidity. We can clearly see in the image about how important identifying international trading hours are for a trader.
The Asian session starts around 1am GMT and often has a bearish bias through this session lasting for a few hours, after which Frankfurt and London traders start to come online and can often reverse the Asian sentiment.
The London session is the best session to trade traditionally starting around 7am GMT before the American traders come online and reverse market once again.
We have designed this indicator to help identify different trading hours easily with a background shade on the chart and also high/lows of the training session, as these levels can often be revisited.
We hope you find this indicator useful and please feel free to drop a comment if you have any updates you wish to be made or any future indicator script ideas, thank you.

[astropark] Kill ZonesDear Followers,
today I'm glad to present you an indicator which highlights for you the most important market Kill Zones .
This indicator will color background of the time sessions when Asia, London and New York sessions are going to be most active .
This way you can understand easier what istitutions and big hedge funds made during the session.
You can change colors and transparency in the indicator options, default colors are yellow for Asia, blue for London and red for New York sessions.
You can enable the indicator to show background also during the weekend (disabled by default).
This indicator works on all markets, I suggest not to use it above 1h timeframe, 5m-15m is great.
This is a premium indicator , so send me a private message in order to get access to this script.

Forex bot full strategy with risk managementThis is a full strategy designed for forex major pairs, specially EUR/USD using 1h time frame chart.
Its components are
200 EMA
MACD
OBV
PSAR
RIsk management with tp and sl movements
Rules for entry
For long = Previous histogram from MACD was below 0 and current one is above 0. CLose of a candle is above EMA 200 , OBV oscillator is negative and we have an uptrend from PSAR
For short = Previous histogram from MACD was above 0 and current one is below 0. CLose of a candle is below EMA 200 , OBV oscillator is positive and we have an downtrend from PSAR
Rules for exit
For tp and sl values we calculate the distance from the close of candle until the psar values.
If you have any questions, let me know !

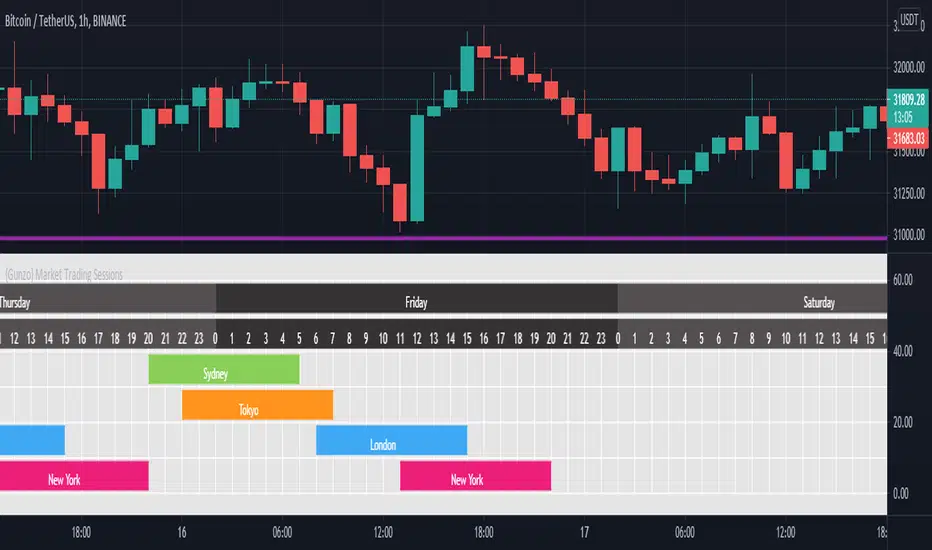
{Gunzo} Market Trading Sessions (Tokyo, London, New York)Market Trading Sessions is a tool designed to help traders to find the best times of the day for price action trading. It displays non-overlapping visuals for the major trading sessions : Oceania, Asia, Europe, and USA.
OVERVIEW :
This tool has been designed to match all the following requirements that I needed for optimal usage :
Display opening and closing of main markets
See clearly market sessions (non-overlapping colors)
Display Sydney session if wanted
Display GMT hours and days
Visually pleasing design and colors
Highly configurable
As I had trouble finding a script matching all these criteria, I created this tool and I'm sharing it with the TradingView community, hoping you will find it useful too.
SETTINGS :
Display market sessions on weekends : Display theoretical market sessions times on the weekend which can be useful for non forex markets.
Display session for Oceania\Sydney : Display "Oceania\Sydney" trading session
Display session for Asia\Tokyo : Display "Asia\Tokyo" trading session
Display session for Europe\London : Display "Europe\London" trading session
Display session for USA\New York : Display "USA\New York" trading session
Display session names : Display names of the session on the visual
Oceania color : Configurable color for the "Oceania\Sydney" sessions
Asia color : Configurable color for the "Asia\Tokyo" sessions
Europe color : Configurable color for the "Europe\London" sessions
USA color : Configurable color for the "USA\New York" sessions
Background color : Configurable color for the table background
Border color : Configurable color for the table borders
Text color : Configurable color for the table text
Header color : Configurable color for the table header (even days)
Header color (alternate) : Configurable color for the table header (odd days)
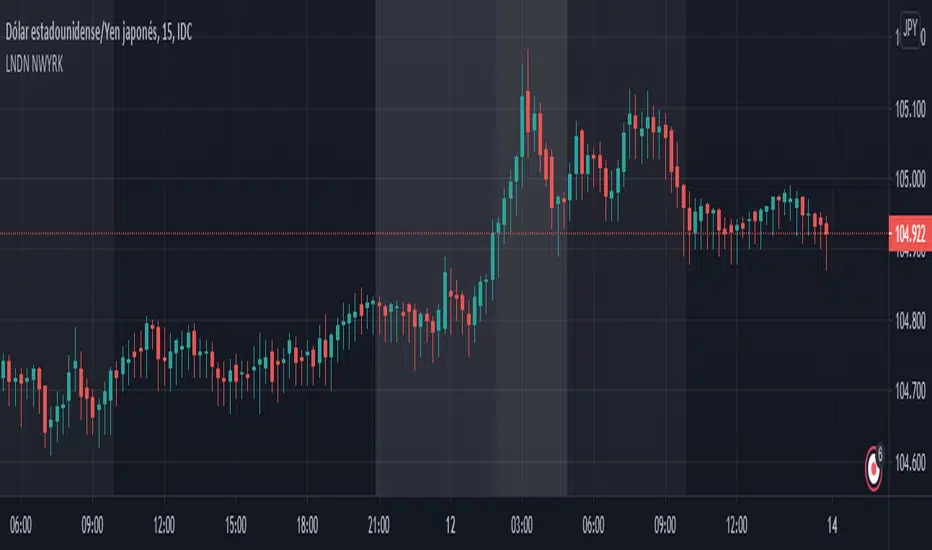
LONDON NEWYORK SESION BY dobleRBackground colors that show open-close of London and New York market sessions
Written for CDMX, MEXICO (UTC-6).
London Breakout/Session GBP/USD Forex DaytradeThis is a forex strategy suited for day traders, specialized in the london breakout session
The key elements for this strategy are the specific london time session, together with an exit time(before asian trade/at the end of new york session).
At the same time, as logic elements we only use price action inside like :
For long we have 3 ascending candles, and for short we have 3 descending candles.
For exit we have both TP/SL based on price percentage movement, or we exit if we reach the end of the day.
If you have any questions message me in private !

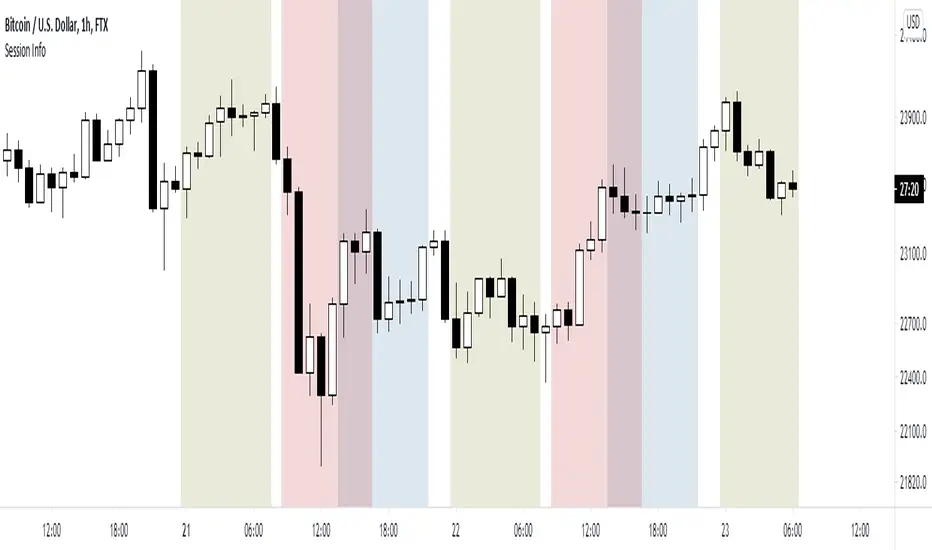
World market Session Information for bitcoinIt marks out different world markets active timings on the bitcoin charts.
You can also modify the script to a strategy and test out different strategies.
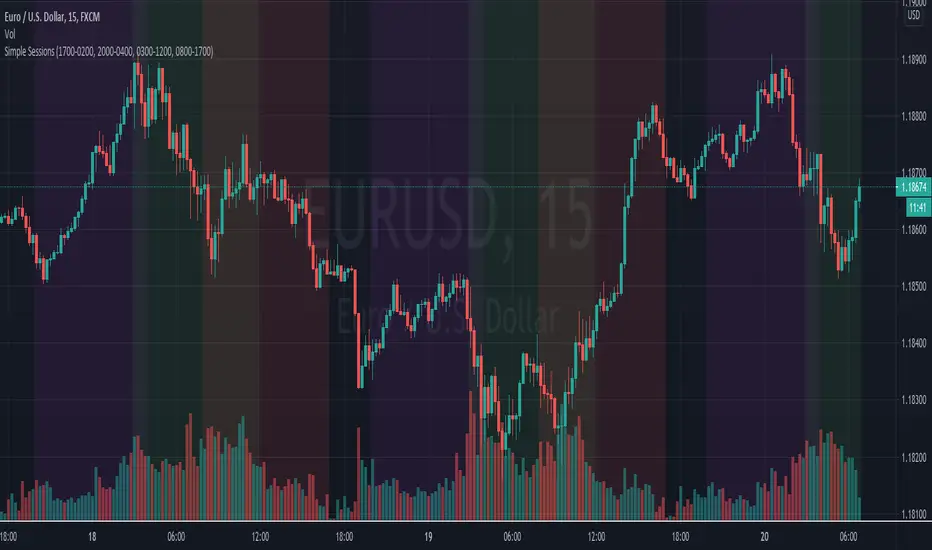
Simple Sessions## Background ##
Simple Sessions is based on the very awesome "Sessions on Chart" by Aurocks_AIF.
I really liked how the background colours worked but wanted to simplify it by removing some parts that I didn't use. I then simplified much of the code, put it into my standard template format and re-published. Hopefully the code is a bit cleaner and easier to read now.
## Usage ##
The default indicator shows the following sessions:
* Sydney in Navy
* Tokyo in Purple
* London in Green
* New York in Red
The good news is that using Green and Red for London and New York, gives a nice distinct yellow for the overlapping sessions. Sydney and Tokyo are by in similar colors by design.
By default, only London and New York show, but you may turn on Sydney and Tokyo in the settings.
## Use, Share, Like, etc #
Have fun!
-- chilts
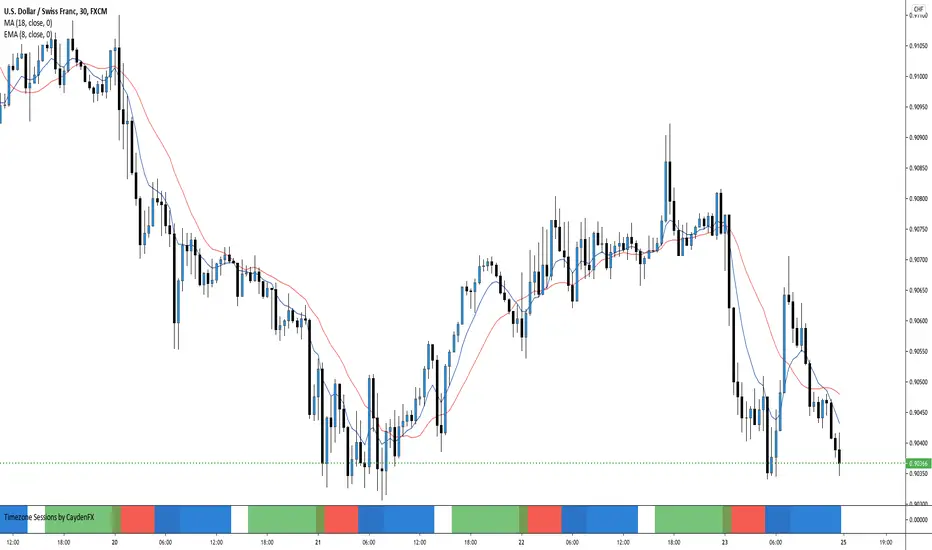
Timezone Sessions by CaydenFXThis indicator is used to tell when each market is in session. This is based on the Los Angeles time frame. You can customize the colors and opacity of each session. The sessions include London, New York, Sydney, and Tokyo. I only have three sessions being displayed in the picture.
London breakout GBPUSD daytradeHello,
First I want to WARN THAT YOU NEED A MINIMUM OF 30X LEVERAGE FOR THIS STRATEGY IN ORDER TO WORK.
THE REASON IS THAT THE SIZE IS CALCULATED BASED ON A VERY SHORT STOP LOSS LEVEL IN PIPS
UTILIZE IT AT YOUR OWN RISK
This is a daytrading strategy, that's suited for GBPUSD 1H timechart.
It a very simple strategy that utilizes 2 moving averages : a very fast one and a very slow one.
It will always enter only at the beginning candle of London session, and it will always exit at the candle at the finish of London session.
So the rules are simple :
If its 8 am GMT and the candle close or high cross the slow moving average and we are above at the same over the slow moving average we make a long movement. The oposite condition is applied for short.
At the same time we always use a very small stop loss = 50-100 points ( 5-10 pips).
We dont have a take profit, in our case the trade ends always at the end of London session. In this case at 15h GMT
It might work on other currencies aswell, but it has to be tested first.
For any questions or suggestions, please let me know.

Money maker EURUSD 15min daytraderVERY IMPORTANT : THIS STRATEGY WAS MADE WITH LEVERAGE IN MIND
You need atleast 20X LEVERAGE ACCOUNT IN ORDER TO WORK PROPERLY.
With high rewards come high risk .
If you dont want to use leverage, use a risk % of less than 0.25 %.
The below example is without use of leverage on a capital 100.000 risking only 0.25% on each trade
This is a breakout strategy, initially made for EURUSD 15 min for London session.
Its made of 4 SMMA and 1 EMA
Rules for entry are simple :
For buy if our current closed candle is above all moving averages, and they are in ascending order ( 3 > 6 > 9 .... ) and we are in the London session we enter.
For sell the same, but in reverse. If closed candle is below all moving averages and they are in descending order ( 3< 6 < 9 .....) and we are in the London session.
We have a risk manangement with TP/SL.
For exit its either if we reach a tp/sl level, or we reach London finish time.
It also has a risk management, calculating the size based on the pips for SL and our current balance.
For any questions , let me know.

Amazing scalper for majors with risk managementHello,
Today I am glad to bring you an amazing simple and efficient scalper strategy.
Best suited for 1M time frame and majors currency pairs.
Its made of :
Ema (exponential moving average) , long period 25
Ema(exponential moving average) Predictive, long period 50,
Ema(exponential moving average) Predictive, long period 100
Risk management , risking % of equity per trade using stop loss and take profits levels.
Long Entry:
When the Ema 25 cross up through the 50 Ema and 100 EMA. and we are in london or new york session( very important the session, imagine if we have only american or european currencies, its best to test it)
Short Entry:
When the Ema 25 cross down through the 50 Ema and 100 EMA, and we are in london or new york session( very important the session, imagine if we have only american or european currencies, its best to test it)
Exit:
TargetPrice: 5-10 pips
Stop loss: 9-12 pips
Hope you enjoy it :)

Wavetrend strategy with trading session for any time chartHello there
Today I am glad to provide you a strategy based on the wave trend oscillator. If you want to use it as an indicator, just disable long and short to not make any shops.
It works on all time frames.
The way it works its like an RSI .
We have overbought and oversold levels, and together with a channel and length we calculate the wave trend.
And then like in RSI, when we cross those lines we buy or sell depending on which lines we cross.
For risk management, so far its not implemented, but it can be done in many ways.
The only thing I applied is to always close a trade at the end of friday day. At the same time it can be applied the rule to sell when % of equity is lost, or at the end of a trading session like london,neywork and so on.
For any questions or doubts, let me know.
Hope you enjoy it :)

London&NY Sessions with DaysOnly has certain time frames for New York and London which can be changed. Does not included other sessions. Also has options to include the market open.

Koala System EURUSD 15minToday I bring you one of the best systems I have found for 15min chart for EURUSD, can be adapted to other pairs aswell I suppose.
Its made of 4 SMA 3 6 9 50 and EMA 200.
It only makes 1 trade per day, in this case we have a risk % of our total eqquity, being the min 0.1 lots , can be changed tho .
We target TP/SL the same 1:1 rr, in this case I use 30 pips for both., that means I risk maximum 30$ out of a total of 1000 equity , per each trade , with 3%
Entry is simple : price is below all movings averages for sell or above for buy. At the same time we check that the ma's are in ascending or descending order.
The key here is patience, never make more than one trade per day.
System always close the trade at the end of london session. Also it only works, during the london session.
Enjoy it.

EURUSD 5min london session strategyHey, today I bring you another strategy that I pull up together.
Its a KISS system ( keep it stupid simple )
We have 2 ma of 5 lenght each, one applied to the high and the other to low. With this we create a channel.
If the candle close above or below the channel we got a signal. Then we can optionally verify with the RSI to increase our chances.
At the same time, this system, only trades during the london session ( can be changed), and it has 2 rules, preferably no more than 5 trades / day, and no more than 2% risk of equity lost .
We also have a TP/SL system made of pips.
Enjoy it.

Simple and efficient 1h strategyThis strategy is made from a crossover of 2 ema : 4 and 8 in this case, together with a RSI of lenght 10 applied to hl2
The strategy is simple : we enter when we have a cross between the 2 ma's and rsi at the same time is in ascending or descending position crossing the middle line of 50.
For exit we have : at the end of a session( we trade only between london and newyork in this case, so we exit newyork), or through a tp/sl pip point system.
Hope you enjoy it.
