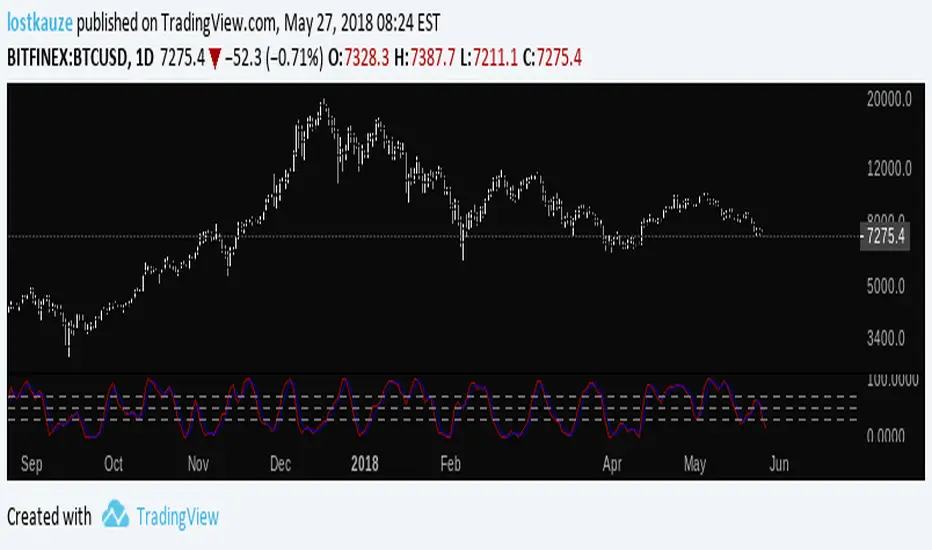
Bitfinex Sentiment Index [Long-Short]BSI provides two attractive graphs that breakdown the long (green area) and short (red area) positions ratio for the all Bitfinex margin cryptocurrency pairs only .
It is a quantitative measure of the bullishness or bearishness that can be used as a trading rule or in a trading system entries or exits. Included slow stochastic oscillator.
PANJANG

Speed_long_short-v2[WOZDUX]Indicator longs and shorts version 2.
------
Индикатор лонги и шорты версия 2.

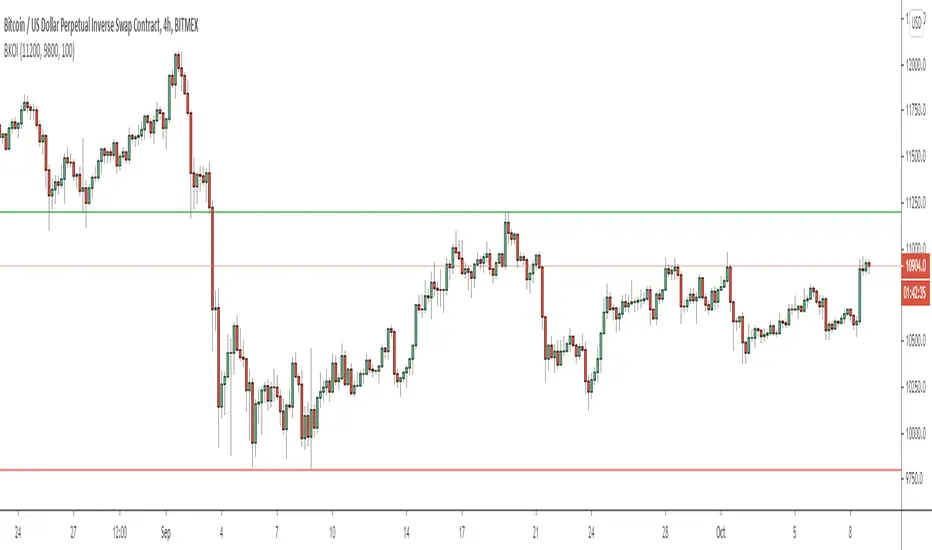
Breakout IndicatorThis script allows you to set breakout alerts.
An alert will be triggered only when price breaks and closes beyond the specified prices. You will get an alert on the first candle that closes beyond the levels you set.
Total Power IndicatorHello traders!
This indicator was originally developed by Daniel Fernandez (Currency Trader magazine, 2011).
It is based on the two well-known indicators by Dr. Alexander Elder - Bulls Power and Bears Power.
Signals
1) Long when Bull and Total lines indicate 100 (it happens rarely)
2) Short when Bear and Total lines indicate 100 (it happens rarely)
3) Bull and Bear lines crossovers
4) Long when Bull line crosses Total line from below
5) Short when Bear line crosses Total line from below
6) Long/Short when Bull/Bear lines cross adjustable level.
Like and follow for more open source indicators!
Happy Trading!

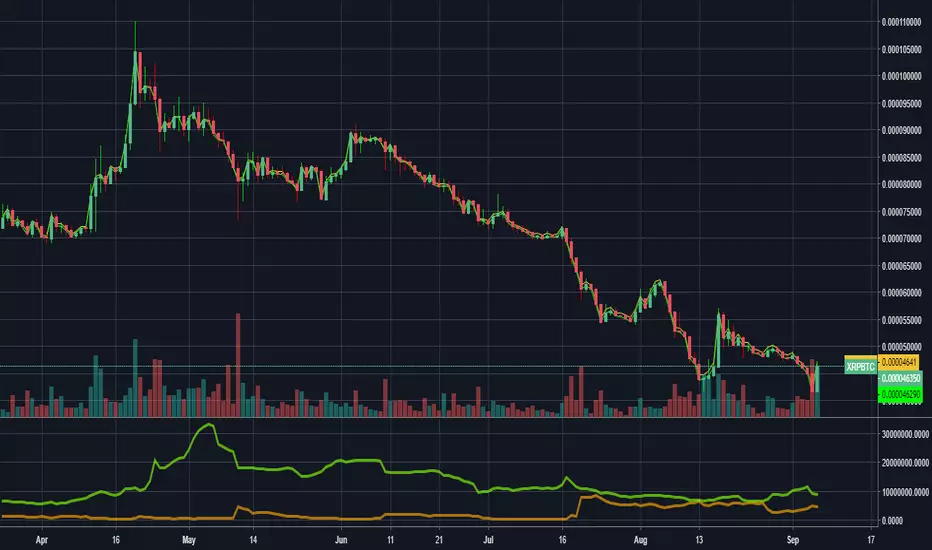
XRPUSD LONG/SHORT RATIO BITFINEXXRP longs and shorts on finex.
Red line -> Shorts
Green line -> Longs
Area -> Longs/Shorts normalized.

XRPBTCSHORTS XRPBTCLONGS - Bitfinex XRP Shorts & Longs// Created by titanlyy
// This script was inspired by @autemox who created the BTC version of this.
// Hope this helps. Peace out.
// 7th September 2018
BTC longs n' shortsA indicator that neatly shows you BitFinex margin longs and shorts that can be put on any chart!

Dumb Indicator 9 - Bitfinex Shorts X LongsThis is a way to study how the crypto market is going on Bitfinex, you can see the diference between the Long and Short terms on most popular pairs.

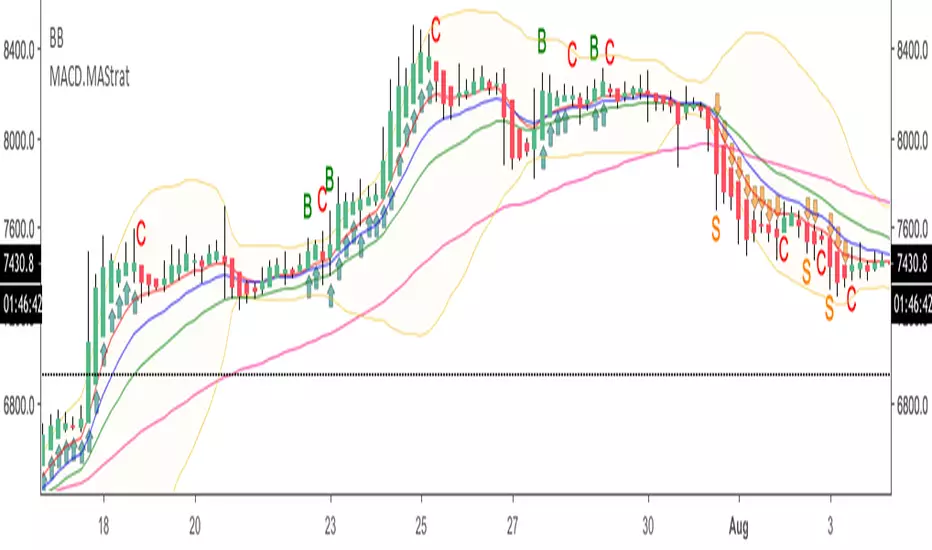
HA.MACD.MA.TradeSetupsHi probably trade setups indicator intended to be used with Heikin Ashi candles. It uses fibo EMAs and MACD to signal longs/shorts. Intended for scalping high cap coin with high volume on lower time frames.
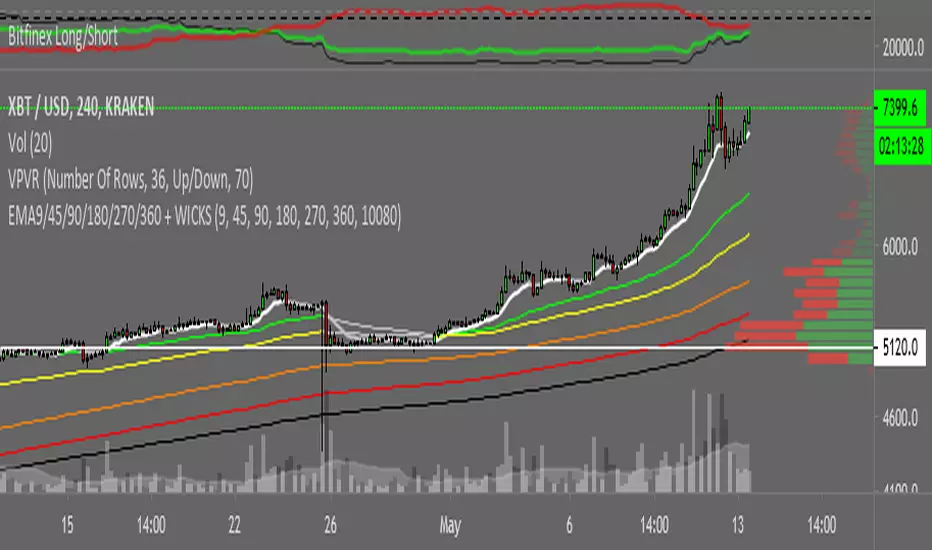
Bitfinex BTC longs vs Short & RatioSince the last BTC Short Squeeze on Bitmex maintenance I decided to made a Indicator plotting Long:Short ratio, and their respective graphs.
Green = Longs
Red = Shorts
Black = Ratio (Longs:Shorts)*Close <= Close price just for chart normalization!
I hope you find it useful.
NOTE: It isn't a prospective indicator, but try to find out who's bitching the market and when ;p

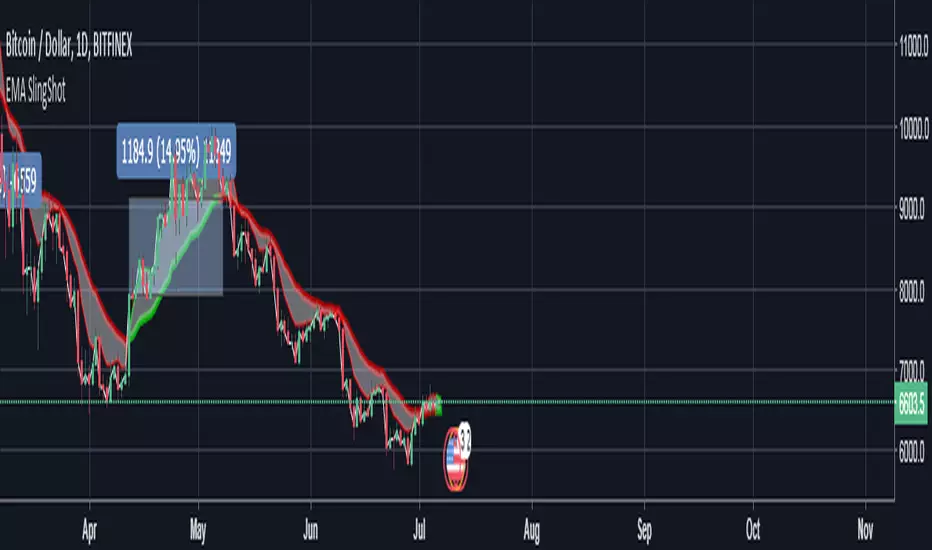
EMA SlingShotUsing ema for close and high, provides optimal entry and exit point. Work best for 1 day period.
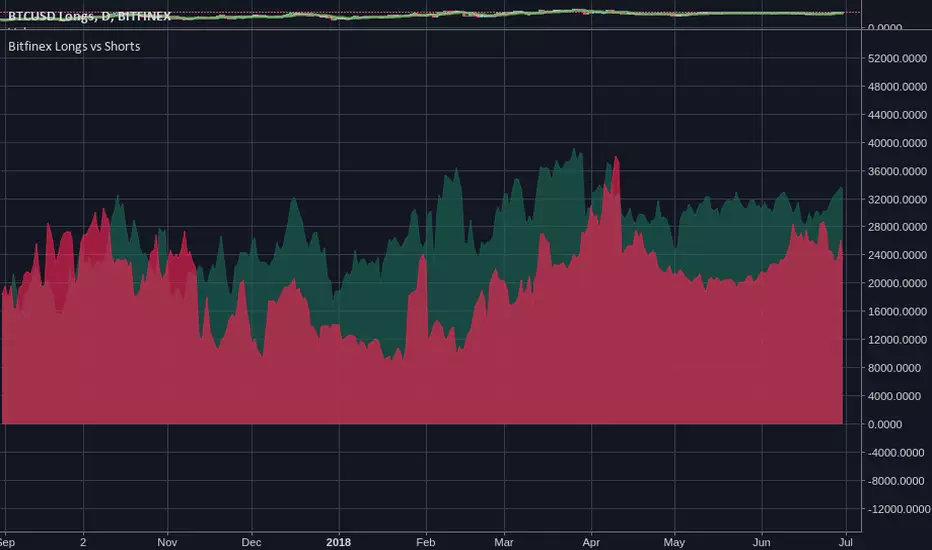
Bitfinex Longs vs Shortssexy view of the current long/short positions on Bitfinex. I saw some pay-for, hidden-source-code version of this and thought: "oh man."
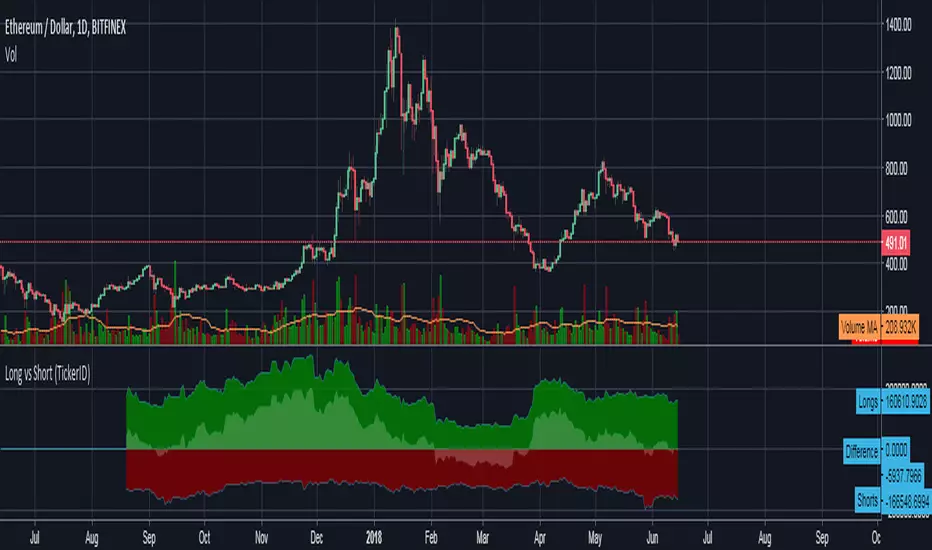
Bitfinex Long vs Short (TickerID)Uses the active ticker to show long/short values on all Bitfinex pairs that have that data available on Tradingview.
Closing Leverage and Rate of ChangeShows BTCUSDLONGS vs BTCUSDSHORTS along with their rate of change on a scale that's friendly for a combined indicator. ROC is increased proportionally so you can see it in relationship to Open Shorts and Open Longs on the same graph without zooming. I had been using an offset as well, but using an offset to adjust position causes the highs to look lower and it makes the lows look less low. It was significant enough to seem like a bad idea to include.


Stoch BitfinexSimilar to RSI Bitfinex , but Stoch version.
It applies Stochastic Oscillator to BTC longs/shorts ratio on Bitfinex. You can use the oscillator as you'd use Stoch:
- Divergences
- Oversold/overbought signals
- R/S on the indicator
- Trend indication
- etc
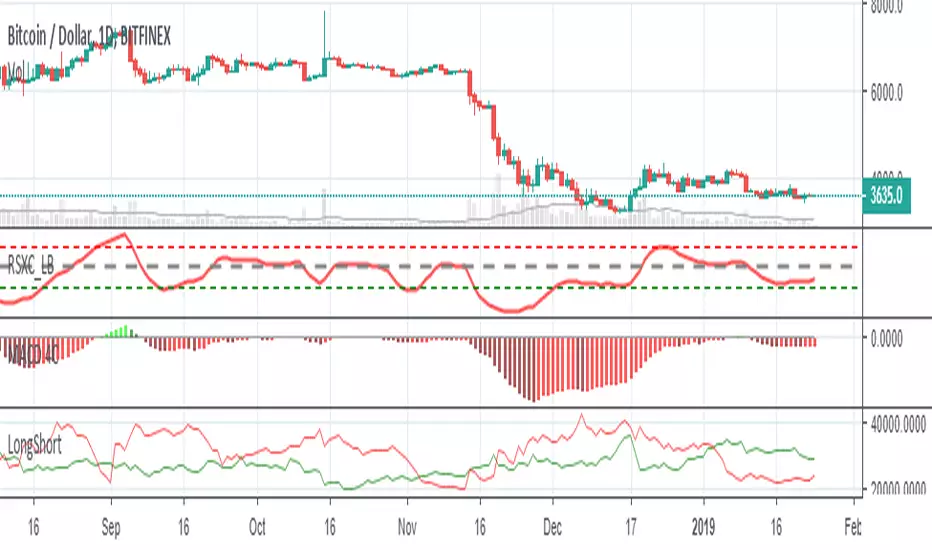
RSI BitfinexRSI applied to BTC longs/shorts ratio on Bitfinex. You can use the oscillator as you'd use RSI:
- Divergences
- Oversold/overbought signals
- R/S on the indicator
- Trend indication
- etc

Bitfinex Longs vs. ShortsIt shows amount of longs vs shorts for Bitfinex.
It can be applied to any currency that has a long/short option on Bitfinex.
It works with any other exchange but it pulls short long data from Bitfinex.
Useful for "reading" the market sentiment.
Use it well. Be blessed.

BITFINEX Long to Short RatioShows the ratio of longs to shorts. Above 1.0 means more longs. Below 1.0 means more shorts. A value of 1.0 means equilibrium.

