Percent Trailing Stop (%) - For Study Scripts===========
Percent Trailing Stop (%) - { FOR STUDY SCRIPTS }
===========
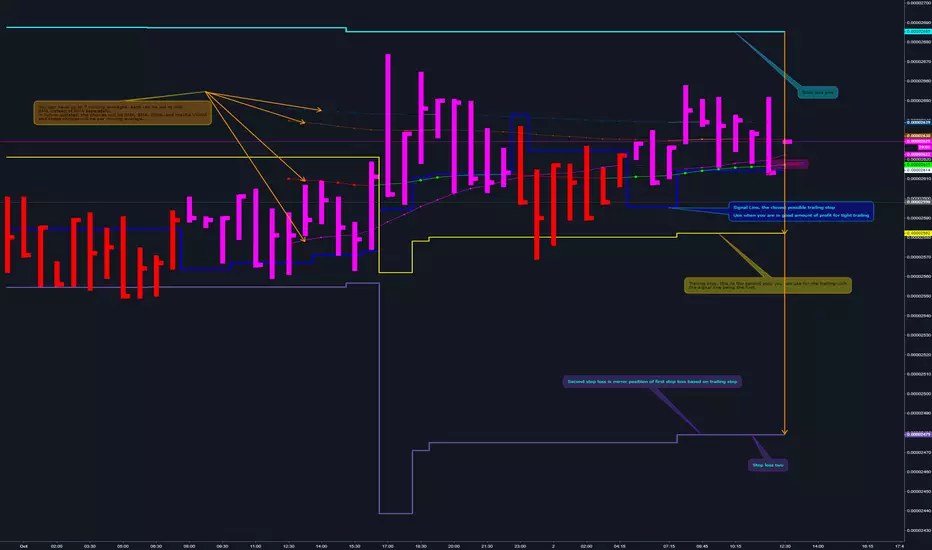
Wow - this is an example of how to implement Alerts relating to a Trailing Stop (%) within your Study Script. It's taken a bit of effort to get this working but I think we got there!
Alerts include Open Long/Short, Trailing Stop Hit, and (the most important one) Movement of Trailing Stop! <- this is actually really quite good, by the way! :)
You can ignore the actual entry/exit orders - they're based on a simple MA cross and are therefore NOT relevant, NOT profitable and NOT recommended!
You should be using this code as a way of adding a Trailing Stop to your own scripts - hope it helps!
Set your "Open Long/Short" Alert to "Once per Bar Close" - Set your "Trailing Stop Hit" Alert to "Once per Bar" - Set your "Move TSL" Alert to "Once per Bar Close". - You're all done! Enjoy.
-----------
Good Luck and Happy Trading!
Loss

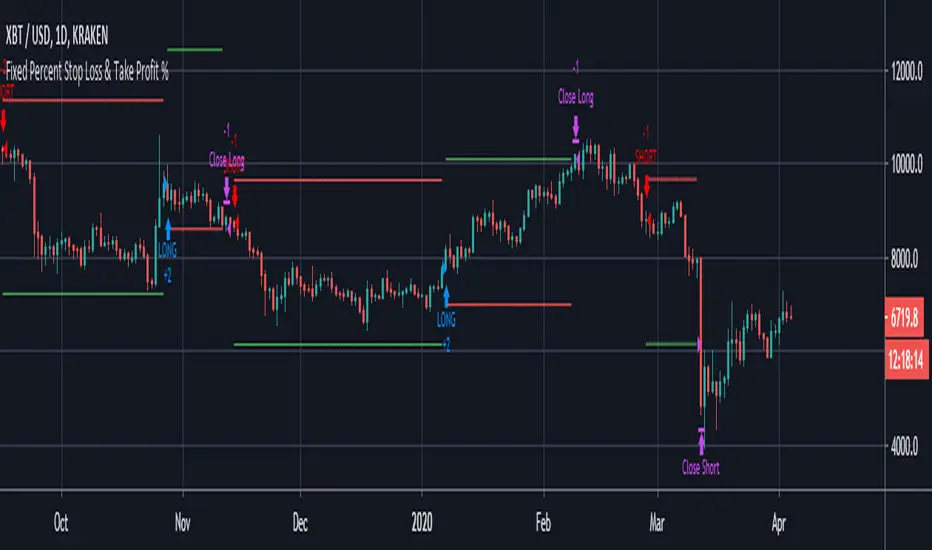
Fixed Percent Stop Loss & Take Profit % - For Study Scripts===========
Fixed Percent Stop Loss & Take Profit % - { FOR STUDY SCRIPTS! }
===========
A neat example of how to set up Fixed Stops and Take Profit as a percent of the entry price - This is for setting Alerts within your own Study Script for when either your SL or TP get hit.
Yup, that's about it!
You can ignore the actual entry/exit orders - they're based on a simple MA cross and are therefore NOT relevant, NOT profitable and NOT recommended!
You should be using this code as a way of adding Stops and Takes to your own scripts - hope it helps!
Set your "Open Long/Short" Alerts to be triggered "Once per Bar Close" - Set your "SL/TP" Alerts to trigger "Once per Bar".
--
We wrote this with a bit of a rush on! ~ If you spot any mistakes/bugs just let us know and we'll get round to them asap!
-----------
Good Luck and Happy Trading!

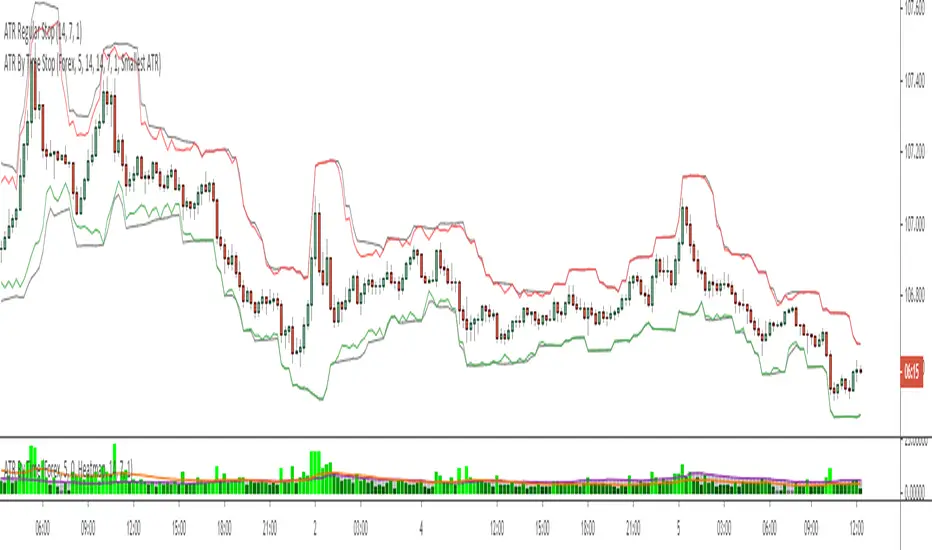
ATR By Time [Chart]What is ATR By Time (Chart)?
This premium indicator is a companion script to my ATR By Time indicator.
This companion script draws your stop loss price to the chart directly. In the above example, the black line represents a regular 1x ATR stop loss above and below price action, while the colored lines are the 1x ATR By Time indicator values when set to use the "Smallest ATR" in the settings menu.
When set to "Smallest ATR", the script calculates the regular ATR and the ATR By Time of Day and compares the distance of the two values. It then selects whichever value is smaller to be used as the stop loss, and adds or subtracts it to the most recent swing high or low (or the closing price if desired).
This allows for tighter stops and larger position sizing during certain times of day for aggressive traders when set to Smallest ATR, or wider stop losses during more volatile periods of the day for conservative traders when set to Largest ATR.
Stop Loss Distance Options:
- Regular ATR
- ATR By Time
- Smallest ATR
- Largest ATR
More Information
Similar to my RVOL By Time indicator, the ATR By Time indicator works on any market that has consistent trading session lengths . So it works best on Forex & Crypto, but also works on some Stock and Futures markets.
Instead of calculating the ATR based on recent price data like the regular ATR indicator, it calculates an ATR value for each candle based on that candle’s time of day .
For example, if you set the Lookback setting on this indicator to 14, then instead of calculating the ATR based on the past 14 candles, it will calculate an ATR value based on the past 14 trading sessions for each candle (as an average).
So in other words, your 10:00AM candle will show the average of the past 14 10:00AM candles rather than the past 14 candles leading up to that 10:00AM candle.
This is extremely useful for day traders in particular as it allows you to gauge the average range of candles during certain times of day instead of only by the most recent price action.
It also draws a regular ATR (optional) – so this is essentially an enhanced ATR script that gives you multiple readings on price volatility.
If you are interested in trying the script or you want more information on how the script works, there is more information available on my website including instructions on how to apply for a free trial: ATR By Time Feature Page .
Good luck with your trading!
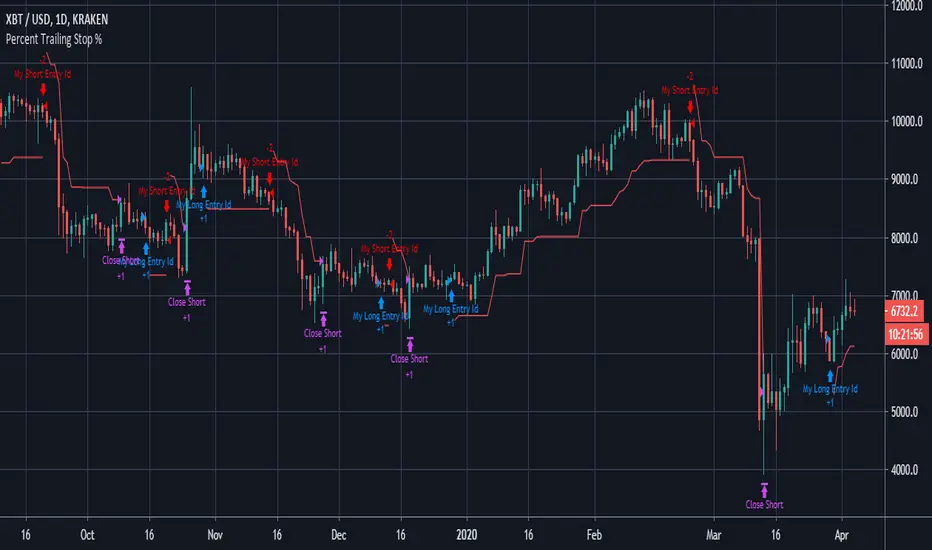
Percent Trailing Stop %===========
Percent Trailing Stop %
===========
Another Stop Loss Indicator today - our last Fixed SL/TP script went down quite well, this one is for adding a Percent Trailing Stop from Entry Price to your own strategy.
You can ignore the actual entry/exit orders - they're based on a simple MA cross and are therefore NOT relevant, NOT profitable and NOT recommended!
You should be using this code as a way of adding a % Trailing Stop to your own scripts - hope it helps!
You should also notice that a generally considered losing strategy (a simple MA cross) could actually become profitable with careful money management - try combining this Trailing Stop script with our Fixed Stop/Take Profit script for really accurate management of your capital.
-----------
Good Luck and Happy Trading!
Fixed Percent Stop Loss & Take Profit %===========
Fixed Percent Stop Loss & Take Profit %
===========
A neat example of how to set up Fixed Stops and Take Profit as a percent of the entry price.
Yup, that's about it!
You can ignore the actual entry/exit orders - they're based on a simple MA cross and are therefore NOT relevant, NOT really profitable and NOT recommended!
You should be using this code as a way of adding Stops and Takes to your own scripts - hope it helps!
-----------
Good Luck and Happy Trading!
Percent MrEmamThis is my Gain/Loss indicators that is utilizing with version 4 of pine script, it simply writes the percentage on the last candle as label. If loss passes 100% in reality you lost all your money, so the indicators will show "LIQUIDATED" instead of the percentage.
Bitcoin Production Cost OscillatorFor Trav,
Oscillator version of "Bitcoin Production Cost".
Based on raw data from CBECI.
Follow me to read more about the calculation logic.

Scripting Tutorial B - TManyMA - Commission/FeesThis script is for a triple moving average strategy where the user can select from different types of moving averages, price sources, lookback periods and resolutions.
Features:
- 3 Moving Averages with variable MA types, periods, price sources, resolutions and the ability to disable each individually.
- Crossovers are plotted on the chart with detailed information regarding the crossover (Ex: 50 SMA crossed over 200 SMA )
- Forecasting available for all three MAs. MA values are forecasted 5 values out and plotted as if a continuation to the MA.
- Forecast bias also applies to all forecasting. Bias means we can forecast based on an anticipated bullish , bearish or neutral direction in the market.
- To understand bias, please read the source code, or if you can't read the code just send me a message on here or Twitter . Twitter should be linked to my profile.
- Ribbons added and on by default. Optional setting to disable the ribbons. 5 ribbons between MA1 and MA2 and another 5 between MA2 and MA3.
- Ribbons are alpha-color coded based on their relation to their default MAs.
- Ribbons are only visible between MAs if the MAs being compared share the same Type, Resolution, and Source because there is no way to consolidate those three in a simple manner.
- Ribbon values are calculated based on calculated MA Periods between the MAs.
- Converted the existing study into a strategy.
- Strategy only enters long positions with a market order when MA crossovers occur.
- Strategy exits positions when crossunders occur.
- Trades 100% of the equity with one order/position by default.
- Ability to disable trading certain crosses with input checks.
- Ability to exit trades with a take profit or stop loss.
- User input to allow quick changes to the take profit or stop loss percentages.
- Strategy now calculates on every tick
- Strategy also includes fixed commission values based on Coinbase standard order fees
This script is meant as an educational script with well-formatted styling, and references for specific functions.
*** PLEASE NOTE - THIS STRATEGY IS MEANT FOR LEARNING PURPOSES. DEPENDING ON IT'S CONFIGURATION IT MAY OR MAY NOT BE USEFUL FOR ACTUAL TRADING. THE STRATEGY IS NOT FINANCIAL ADVICE ***

Stop Loss_Traders StreamHello Guys we created another tool to calculate your Risk / Stop Loss per Trade. This will automatically calculates the DATR and as per your Risk Input it will calculate and show Stop Loss Price and even it will draw a Red coloured Horizontal line for your reference. Before changing stock don't forget to make Zero @ "Distal Line of DZ / SZ". Please post if any recommendations.........

Scripting Tutorial A - TManyMA - StopsThis script is for a triple moving average strategy where the user can select from different types of moving averages, price sources, lookback periods and resolutions.
Features:
- 3 Moving Averages with variable MA types, periods, price sources, resolutions and the ability to disable each individually.
- Crossovers are plotted on the chart with detailed information regarding the crossover (Ex: 50 SMA crossed over 200 SMA )
- Forecasting available for all three MAs. MA values are forecasted 5 values out and plotted as if a continuation to the MA.
- Forecast bias also applies to all forecasting. Bias means we can forecast based on an anticipated bullish, bearish or neutral direction in the market.
- To understand bias, please read the source code, or if you can't read the code just send me a message on here or Twitter. Twitter should be linked to my profile.
- Ribbons added and on by default. Optional setting to disable the ribbons. 5 ribbons between MA1 and MA2 and another 5 between MA2 and MA3.
- Ribbons are alpha-color coded based on their relation to their default MAs.
- Ribbons are only visible between MAs if the MAs being compared share the same Type, Resolution, and Source because there is no way to consolidate those three in a simple manner.
- Ribbon values are calculated based on calculated MA Periods between the MAs.
- Converted the existing study into a strategy.
- Strategy only enters long positions with a market order when MA crossovers occur.
- Strategy exits positions when crossunders occur.
- Trades 100% of the equity with one order/position by default.
- Ability to disable trading certain crosses with input checks.
- Ability to exit trades with a take profit or stop loss.
- User input to allow quick changes to the take profit or stop loss percentages.
This script is meant as an educational script with well-formatted styling, and references for specific functions.
*** PLEASE NOTE - THIS STRATEGY IS MEANT FOR LEARNING PURPOSES. DEPENDING ON IT'S CONFIGURATION IT MAY OR MAY NOT BE USEFUL FOR ACTUAL TRADING. THE STRATEGY IS NOT FINANCIAL ADVICE ***

P/L count for MACDSimple and effective P/L Count (based on MACD indicator) shows you when MACD give profit and when it lead to loss. PL Count consist of three plots: green (profit), red (loss) and orange (0 by default, but you can setup it as minimum profit level. Go into deal when green(profit) crossover red(loss) and exit when red crossover green. Use it together with MACD for determine deal direction. For some instruments deal opens when green crossover orange minimum profit level (not cross green and red)) .

Hendo's Volatillity Stop HelperA simple indicator helping you with stop loss placement. It uses the recent volatility in the market to generate a band above and below price.
If you struggle with stop loss placement but already understand entries, exits and direction this indicator might be one for you.
Pairs extremely well with certain oscillators, price action trading and pivot point trading.
Comes with 8 settings to facilitate both types of traders:
High acuraccy, low risk/reward ratio
Low acuraccy, high risk/reward ratio
Colours & Transparancy are fully customizable. Access is free, source code is protected and will remain to be so.
In order to achieve the best results I highly suggest you to place stop losses below the lower band (in longs) and above the upper band (in shorts).
Stay tuned for more!

ATR ChannelsATR Channels help you to identify where to place your stop-loss or trailing stop-loss based on price volatility, according to the Average True Range (ATR).

Moving Gain Loss PercentTracks the percentage gain/loss in three ranges:
single candle (can be turned on or off)
custom range of candles
custom range of candles
For example, with a range of 3 candles, and the serie:
1 - close 10
2 - close 5
3 - close 20
The moving gain would be:
1 - close 10 - gain 10, infinite%
2 - close 5 - gain 5, infinite%
3 - close 18 - gain 8, 80%
Or, for example if the range is 12 candles on a monthly chart, then the result is the Year-To-Date gain/loss plotted as a percentage.


Gain Loss V2This is the Version Two of my Gain/Loss percent indicator, it's really simple but very handy indicator, when you go into a position, most of the time during a day trade, you don't have enough time to sit back and calculate the percentage of your gain or loss specially with maker/taker fee and leverage and sometimes funding fee you should pay the exchanges/brokers.
The default values for maker/taker and funding fees are set as you would encounter in Bitmex exchange. every 8 hours you are in position, you should rise the number of funding you pay by one, The rest will be calculated automatically.
Normally you need to set the fees for maker/taker and fund based on what your broker/exchange tells you once, then each trade, you set your entry point, being it a margin trade or not, and finally if it's margin, the direction and the leverage and that would be it.
Again, most of the time traders don't change their leverages, so you would set it for once and after that, you just set the entry, click the direction boolean and that is it.
The source is hidded but every one can use the script.


NeoIchi TrailingThis is the separation of moving average parts from NeoIchi indicator with addition of four different ATR setting that can be used for Stop Loss and Trailing Stops. The NeoIchi indicator won't have any moving averages any more, the code is secured but every one have access to use this indicator on their charts.
Ehlers Instantaneous Trendline StrategyInstantaneous Trendline Strategy by John Ehlers from his book "Cybernetic Analysis for Stocks and Futures".
You can choose implementation of stop-loss. Don't forget to define correct spread for your instrument.
Double EMA with stop loss indicatorThis is an updated version of my previous stop loss script.
I've added a double EMA line and modified the stop as below;
In an uptrend....
1. a yellow dot will appear once it's time to move your stop. The yellow dot will display at the level of the stop loss. Place your stop 1 pip below the dot.
2. The yellow dot will only appear if a new higher low has formed and has been confirmed. Also the current candle must have broken the high of a previous bullish candle or the dot will not appear.
3. The dot will also appear if there is a likely reversal of the current trend.
Also works in downtrends.....
