Local Limit LowerDisplays recent higher and lower lows.
In it's simplicity is a lot more powerful than might appear at first glance.
Does not rely on volatility calculation.
Can be linked together to create an objective view of recent support levels.
Makes current trends more visible.
Excellent as a trailing stop algorithm.
Can be used with its sibling: Local Limit Upper
RENDAH

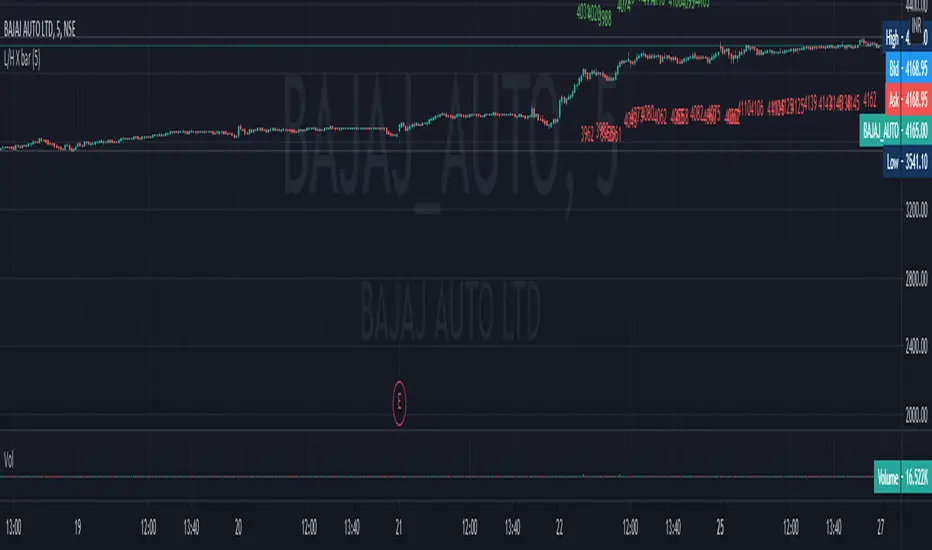
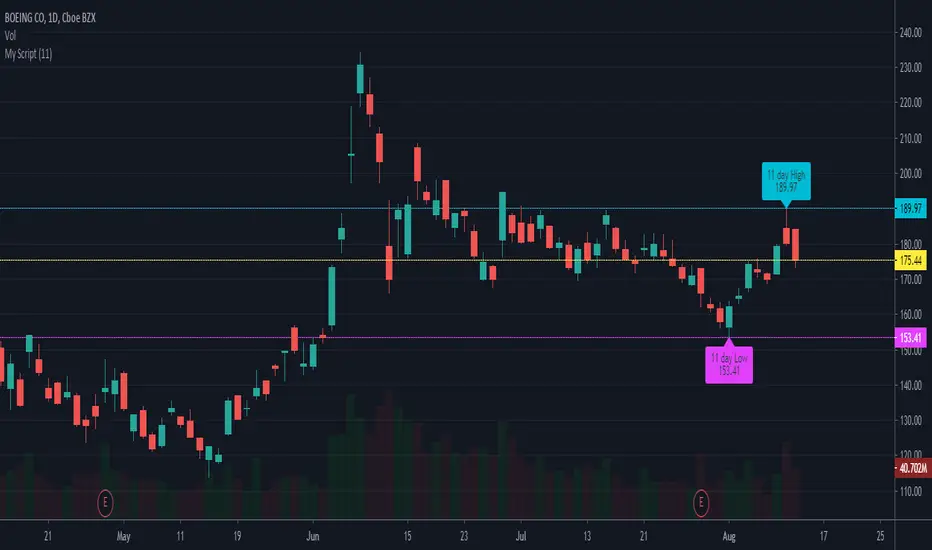
low and high X Bars//This script finds High and Low X bars back. Simple pine script, can customize lookback period.
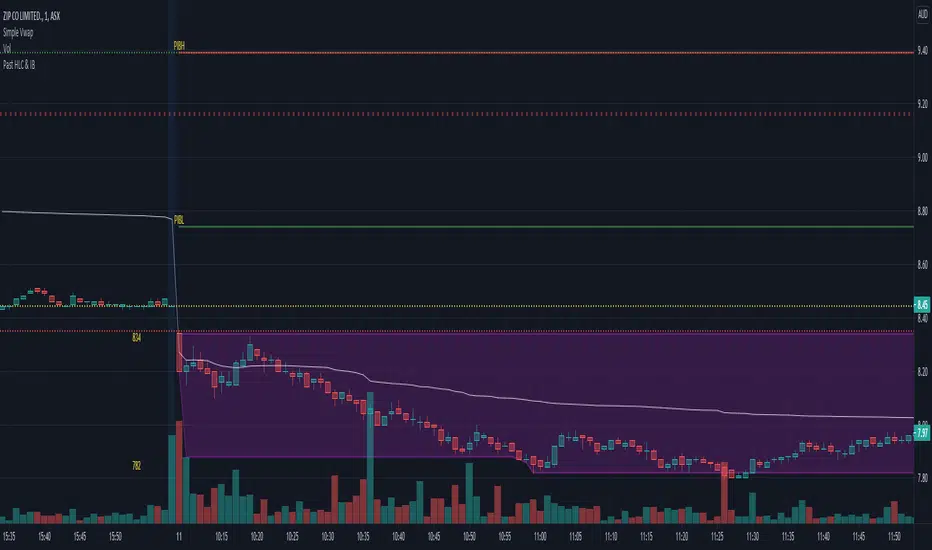
Initial Balance (IB) and Previous Day / Week High, Low & ClosePlots Historical key levels for volume profile idea.
Plots the following:
- Previous Day High
- Previous Day Low
- Previous Day Close
- Previous Day IB High
- Previous Day IB Low
- Current Days IB High
- Current Days IB Low
IB is based on first hour of trading.
Made specifically for ASX stocks, have not tested it on other exchanges or assets.
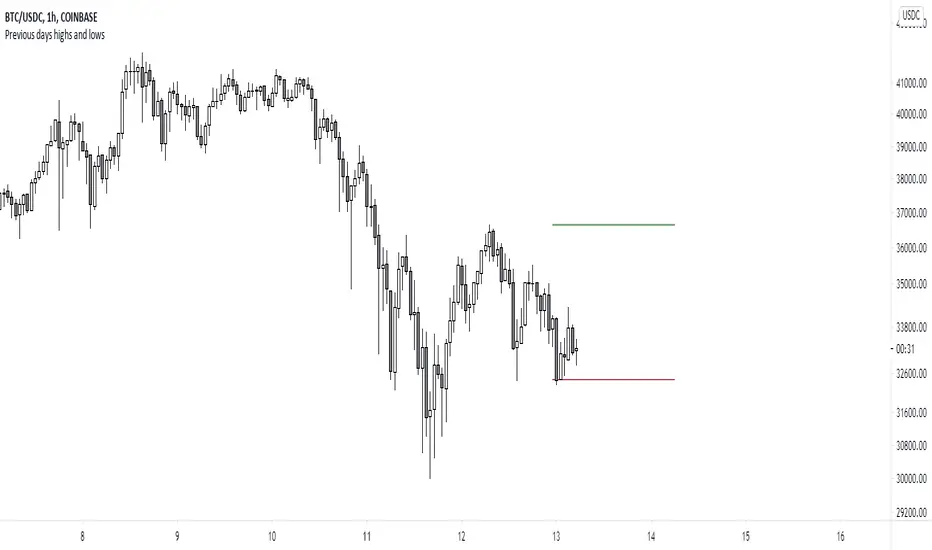
Previous days highs and lowsA script which marks a line pointing the highs and lows of the previous trading day.
Day start top and bottomThis code is modified to draw the first 15 minutes(variable in setting by default 15m is set) of the high and lows through out the day.
It will work on time frames less than than or equal to 1st input. Hope this code helps you all.
IMPORTANT SETTING DETAILS:
1.Res = input(title="Starting X minutes lines to be Displayed",defval="15", type=input.resolution)
2.Day_start_15m=input("0915-0930",title="your country's Trading session time (starting X minutes)")
make sure to enter the starting 15 min of your country trading time in the input in 2nd input
both the above input 1 and 2 must be equal in time i.e "0915-0930"=15min and first one is also 15m
you need to make sure that the input settings are correct. It is By default set For INDIAs trading start time, you have to set start time according to your country.

Rabbit HoleHow deep is the Rabbit hole? Interesting experiment that finds the RISING HIGHS and FALLING LOWS and place the difference between the highs and lows into separate arrays.
== Calculations ==
In case current high is higher than previous high, we calculate the value by subtracting the current highest high with the previous High (lowest high) into array A,
same method for the lows just in Array B.
Since we subtract highs and lows it means velocity is taken into consideration with the plotting.
After adding a new value we remove the oldest value if the array is bigger than the Look back length. This is done for both lows and highs array.
Afterwards we sum up the lows and highs array (separately) and plot them separately, We can also smooth them a bit with Moving averages like HMA, JMA, KAMA and more.
== RULES ==
When High Lines crosses the Low Line we get a GREEN tunnel.
When Low Lines crosses the High line we get the RED tunnel.
The Greenish the stronger the up trend.
The Redish the stronger the downtrend.
== NOTES ==
Bars are not colored by default.
Better for higher time frames, 1 hour and above.
Enjoy and like if you like!
Follow up for new scripts: www.tradingview.com

High Low Rate Of ChangeAn experimental indicator using Pine Script Arrays. The indicators measures the rate of change of the highest highs and lowest lows. I call it the "High Low Rate of Change".
The H/L Rate of Change indicator finds the delta between the current highest high and previous highest high and after some filtering places these values into an array.
Same goes for the lowest lows.
In the end Sum it all up into the Histogram with optional smoothing using Exponential moving average (EMA).
==Colors==
Green: Up Trending.
Light Green: Weakening up trend.
Red: Down Trending.
Light Red Weakening Down Trending.
==Notes==
Bar colors are disabled by default.
Supports EMA smoothing (enabled by default).
Like if you Like and Enjoy!
Follow up for upcoming indicators: www.tradingview.com

Key Levels TheHuntThis indicator is made to show you some key levels on the chart on the different timeframes. You can hide them or show them in the settings. The levels are the Monthly Weekly and Daily opens, current monthly, weekly and daily high / low, last weeks high / low & last daily high / low as well as Monday high and low. These levels can be used as key pivots or key liquidity areas. You can also adjust the time to also use the correct Mon range for forex pairs.
As you can see on the chart, that is how the levels show up on the chart.

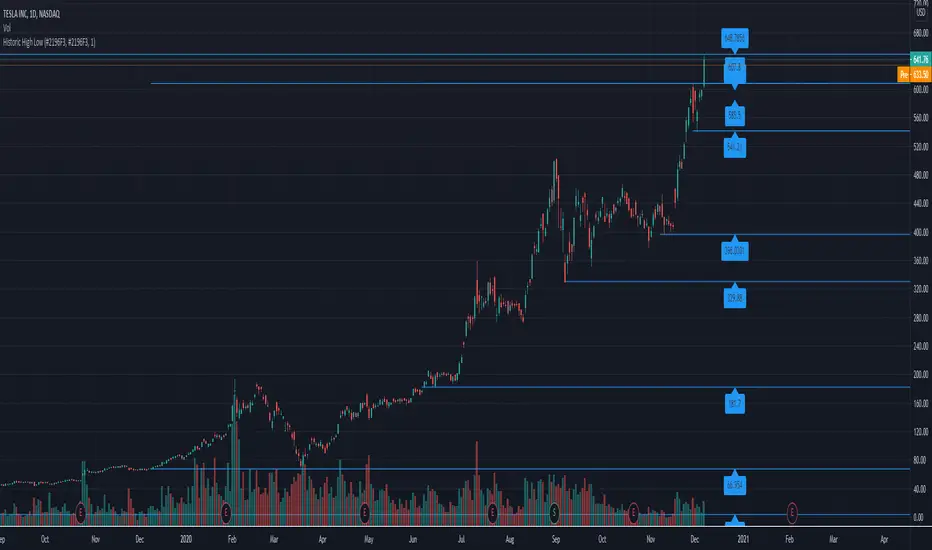
Historic High Lows AdaptiveThis will plot in the ticker opened:
-All-time High and Low
-1 Year High and Low
-6 Months High and Low
-3 Months High and Low
-1 Month High and Low
-1 Week High and Low
-Previous day High and Low
Colors, extending the line to the right, width, showing price tag are all parameters.
High and Low calculations are updated daily
Lines haves issues sometimes rendering when the candles are in a period too small.

Pivots High Low (HH/HL/LH/LL)/Trend [Anan] Hello Friends,,
This is pivot points high low with pivot trend to define the trend direction.
Pivot trend is the pivot points average.
Options:
- Pivot Point Period
- Show/hide Pivot Points Labels
- Show/hide Bull/Bear Labels ( depends on pivot trend)
- Show/hide Pivot Center Line (Bull>Center, Bear

[co.n.g] LeathermanThis is a modest approach of assembling my most favorite strategies into a single indicator script!
I extended the functionality of the ART to the maximum in this piece of price action and volume analysis.
The original "Average Range Targets" - though by default turned off t due to heavily re-scaling the chart -
and the previous day's high and low.
What I've added:
high and low of the actual week
high and low of the previous week
open of the day
close of the previous day
VWAP of the daily session - adjustable to any length
VWAP of the weekly session
opening range / inital balance of the session -fixed to 15 Minutes
I've decluttered the chart as good as possible.
KNOWN BUGS:
Sometimes the plotting is incorrect due to rescaling or zooming in and out of the chart.
How to use - a quick price action guide:
The breakout of the open range is often indicating the trend of the day, a false breakout is often seen as a reversal sign.
A price below the VWAP is seen as cheap, a price above as expensive. In contrary to others, I personally prefer to see a rising price on a rising VWAP ;
additionally, I like bounces off or spikes and reversals through the VWAP , either the daily or the weekly.
The highs and lows of the days and weeks are seen as support and resistance . Trade preferably long above and short below those levels.
The ADR is an indication not working perfectly, especially with stocks.
!!! WARNING !!!
Don't rely solely on a single script nor a single indicator!
Always consider the price action, the trend, the overall market and especially the volume.
There is no "Get-Rich-Quick"-scheme, learn to read the chart and trade accordingly.
Enjoy and make money!
Yours,
Constantine
p.s.:
If you like to show your gratitude for my work:
CHEER!

Session High and Session LowI have heard many people ask for a script that will identify the high and low of a specific session. So, I made one.
Important Note: This indicator has to be set up properly or you will get an error. Important things to note are the length of the range and the session definition. The idea is that you would set it up for what's relevant to your trading. Going too far back in the chart history will cause errors. Setting the session for a time that is not on the chart can cause errors. If you set it to look farther back than there are bars to display, you may get an error. What I've found is that if you get an error, you just need to change the settings to reflect available data and it will be able to compile the script. At the time of its publishing, the default range start is set to 10/01/2020. If you're looking at this years later, you'll probably have to set the range to something more recent.
Features:
Plot or Lines:
Using Plot (displayed), the indicator will track the high/low from the end of the session into the next session. Then at the start of the next session, it will start tracking the high/low of that session until its end, then track that high/low until the start of the next session then reset.
Using lines, it will extend horizontal lines to the right indefinitely. The number of sessions back that the lines apply to is a user-defined number of sessions. There are limits to the number of lines that can be cast on a chart (roughly 40-50). So, the maximum number of sessions you can apply the lines to is the last 21 sessions (42 lines total). That gets really noisy though so I can't imagine that is a limiting factor.
Colors:
You can change the background color and its transparency, as well as turn the background color on or off.
You can change the highs and lows colors
You can adjust the line width to your preference
Session Length:
You can use a continuous session covering any user-defined period (provided its not tooooo many candles back)
You can define the session length for intraday
You can exclude weekends
Display Options:
You can adjust the colors, transparency, and linewidth
You can display the plotline or horizontal lines
You can show/hide the background color.
You can change how many sessions back the horizontal lines will track
Let me know if there's anything this script is missing or if you run into any issues that I might be able to help resolve.
Here's what it looks like with Lines for the last 5 sessions and different background color.

Yesterday's open, high, low and closeA very simple script to plot the yesterday's OHLC, to be used in an intraday graph.
There were other scripts like this, but their code was ugly, filthy, smelly, and WET, so I did this.

TheStrat MTF High/LowI just started learning about #TheStrat by Rob Smith. I created this tool as it helps me see the bigger TFs over my short TF periods. It plots the Highs and Lows of the current and past Quarter, Month, Week, Day, 6hour, and 1hour. (I added the 6 hour for myself for use with cryptos which run 24 hours). It leaves the previous Highs/Lows plotted as well so you can see how the candles are moving within the bigger candlestick . Example, if you select the 15 minute candlestick , it will also list the current high/low for the 1h, 6h, D, W, M, and Q.
It has customization that will disable whatever TF's you are not interested in.
It has auto-detect and disable lower TFs that are less than or equal to the current selected TF. This function will only work to disable when one of the above mentioned periods is selected. Example, if you select the M candle, it will disable the M, W, D, 6h, and 1h. Only the bigger TF of the Q will be visible. Example of when function wont work, if you selected the 2 Month candle it will not disable any of the TFs.
I am open to any ideas that you experienced Stratters offer. As soon as I get better at the system and generate some income for myself, I will likely make it open source. Hope this helps.

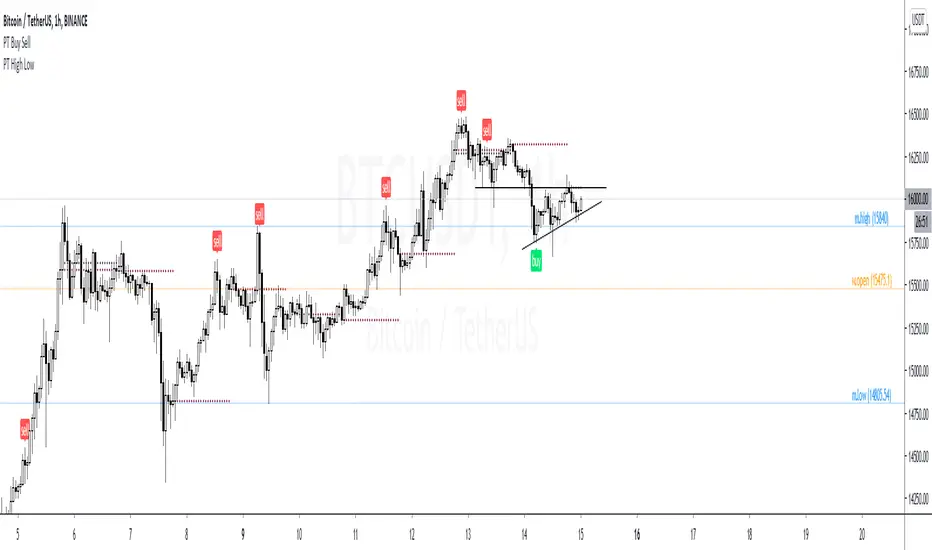
PT High Low Version 1.0 of our PT High Low indicator helps create a visual for the Daily, Weekly, Monthly & Yearly range. These levels will give you an idea of where the price can react if reached. Consider them pivotal areas. We included a toggle that will help you go between the candle's High/Low to the candle's Open/Close. Both features are unique when scalping & swinging. The High/Low will paint a beautiful visual for your day to day trading & the Open/Close will help you determine where price maxed opened & closed for that specified timeframe.
Strategy:
Price tends to gravitate between the Daily level when playing intraday scalps. If playing the weekly, you want to be above the weekly pivot to punt longs & under the weekly level to punt shorts. More likely than not, when the price hits a monthly or yearly level, we get a noticeable reaction off it.
This Oscillator was built around our buy sell indicator & it is used on all time frames for swinging & scalping. It is included as part of the library. Just message us for access!
Low - High Simple TrackerYet another "Low - High" indicator using the new Pine Script Arrays.
The indicator uses the latests Lows and Highs to plot a trend line and reversal/slowdown.
More detailed explanation inside the script.
Enjoy!
Green - Up Trending
Red - Down Trending
White - Slow Down/Reversal might occur.
Made for educational purposes of how to use Arrays, yet can be very useful.

Highs Lows and OpensThis script is an update to a lovely script by BURSATRENDBANDCHART
There original script gave Daily, Weekly and Monthly Highs but I loved the format
I required
Previous Days Highs and Lows
Previous Week High and Low
Previous Day Open
Previous Week Open
Hope this can be of use

Derivative Pivot HL Points Hello.
This script aims to take into account mutable variable Pivot Points' periods.
While doing this, it takes the period between 2 signals that I use in the script:
And these periods in my Pivot HL function integrated into len length (Mutable variables) :
The cornerstone of the script is these facts.
Pivot can be optimized by playing with reversal periods.
These pre-formed levels can be used as Supply and Demand levels.
Regards.

[Alerts] Custom ORB with Target/StoplossThis Open Range Breakout (ORB) Indicator displays High, Low for the selected time frame.
Indicator Feature :-
Shows Long & Short signals based on the crossover.
You can use different alerts like Long, Short, Long-TP, Short-TP, Long-SL, Short-SL, Close
You can change Take profit points
Stop Loss will be low of breaking candle when Long signal is generated and high of breaking candle when Short signal is generated
Select Session time to get alerts only on that period
Select Square off and End Session to generate Close alert based on a specific time at the end of the day
In the future, I will Enhance and update this Indicator if needed
If you have any suggestion mention here
Thank you :-)

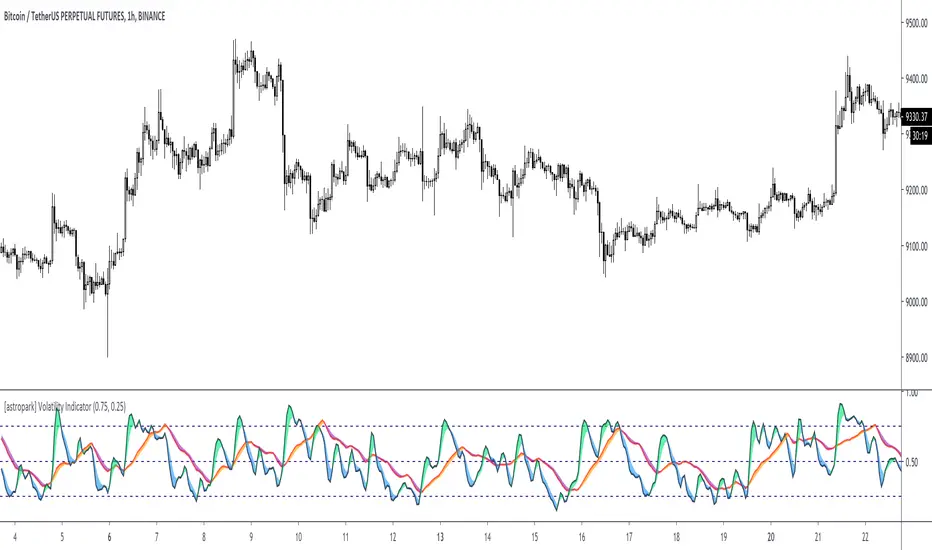
[astropark] Volatility IndicatorDear Followers,
today another interesting script: Volatility Indicator .
This indicator measures the volatility of the market you see in the timeframe you see, in a scale between 0 and 1.
It works on cryptocurrencies, commodities, stocks, indexes and forex.
You will see 2 volatility waves:
a black one (with green and blue shadow for increasing and decreasing mode), which is the "faster" one
a red one (with orange and purple shadow for increasing and decreasing mode), which is the "slower" one
The indicator highlights high volatility when it's near the top (1), while low volatility when near the bottom (0).
You can combine this indicator with your own strategy and indicators to validate them :
on low volatility it often happens that a signal fails to be profitable, as it lacks fuel
while it's better if volatility is over low level as price has more room to run while volatility increasing to the top
This indicator also lets you set alerts when volatility exceeds high level or low level.
This is a premium indicator , so send me a private message in order to get access to this script.
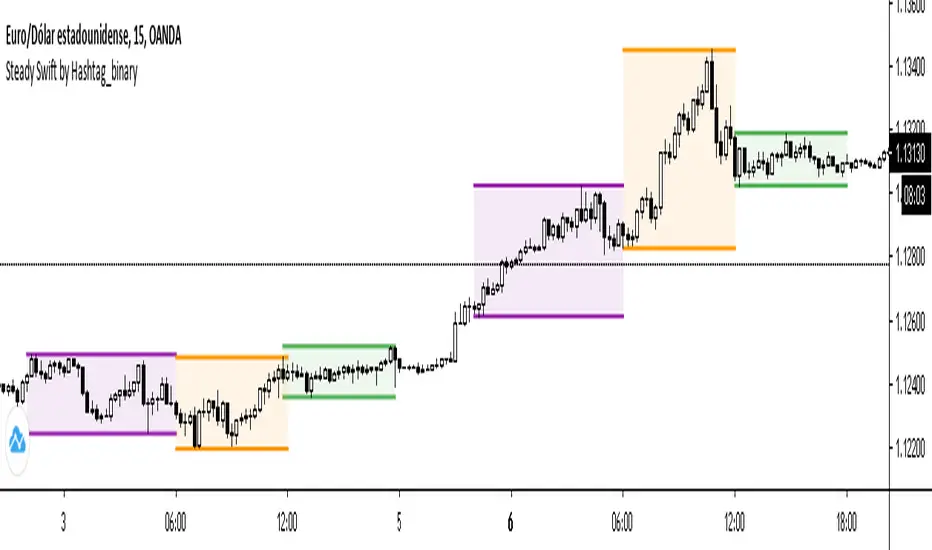
Steady Swift by Hashtag_binarySteady Swift is an indicator that shows the forex sessions and the highest and lowest points of each session of the day.
The sessions that appear on the indicator are Tokyo, London and New York.
The calculation of each session is per hour and goes from 0 to 24 hours, where point 0 begins in the Tokyo session.
In the settings part sessions can be selected or removed, just as you can choose if you want the high and low points to be measured from the wick or the body of the candle, and you can also place the colored background or remove it if you wish (as a preference it is better to leave the background color).
The lines (either current or past) of the high points and the low points of each session can be modified in thickness.
There is a variety to choose the color of the sessions. Even modify the term of each session.