Cyclical Relative Volume + CMFThis Tool is built on the basis of the relative volume of the cycle in question, it can be set as desired.
It is present a background area that indicates whether operators are more likely to accumulate or distribute, again on the basis of cyclicalit.
We can set the% variation of the volumes above the average of the cycle
Hight Threshold highlights in red or green the histograms that exceed the cycle average by x%
Low Threshold highlights in orange the volumes that are less than x% above the cycle average
Finally, volumes below the cycle average will be highlighted.
This tool expresses its maximum in Breakout or Swing operations
The Breakout is purchased if the volumes are 25/50 % higher than the average of the cycle and if the CMF is in the accumulation phase
Instead, I buy the swing if the volumes are below the average of the cycle or around the Low Threshold threshold, if we are in a phase of strong accumulation or in the presence of a slight phase of Positive Money Flow Decrease
The CMF in accumulation / distribution is highlighted by the background color that can be set as desired based on the following parameters:
-Positive Money Flow Increase
-Positive Money Flow Decrease
-Negative Money Flow Decrease
-Negative Money Flow Increase
For any bugs contact the creators
Luigigarone1983

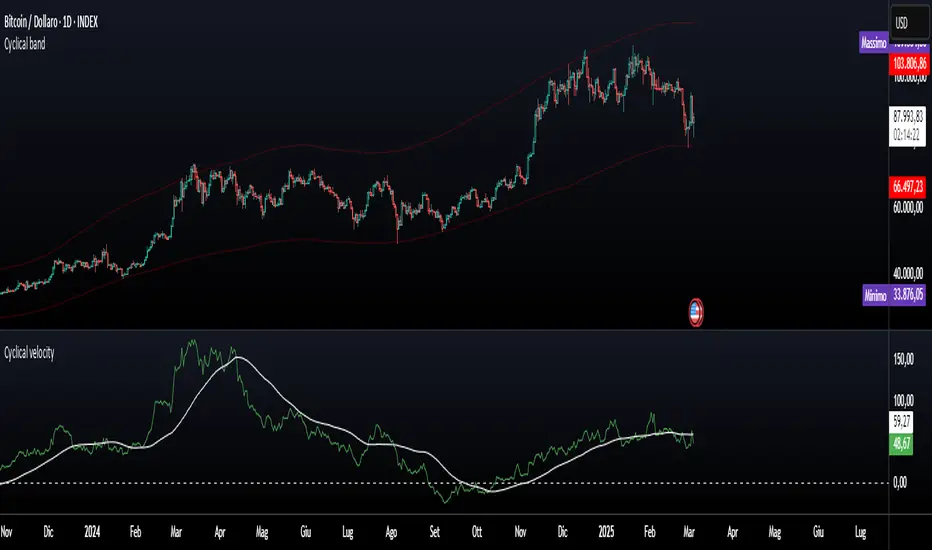
Cyclical velocity v1This indicator is used to measure the velocity of the cycle in question.
It can be used to plot static and dynamic supports and resistances.
For any bugs contact the creators
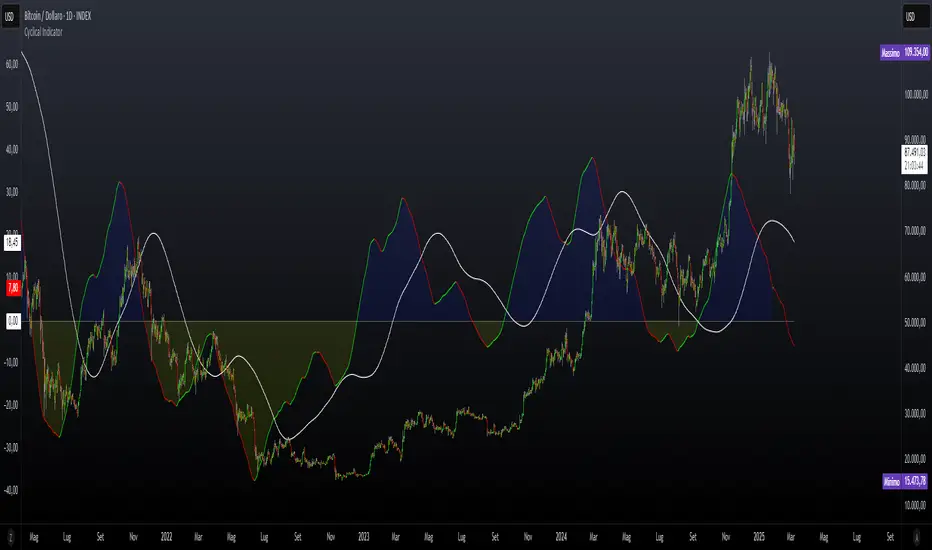
Cyclical IndicatorThis tool is an oscillator that detects cycles.
It is built on the basis of our centered moving averages.
It is fully configurable in design moreover it is possible to set the centering through the offset !
Offset 2, half cycle centering.
Offset 4, 1/4 cycle centering.
Recommended setting :
Offset 4
Cyclical ratio 2
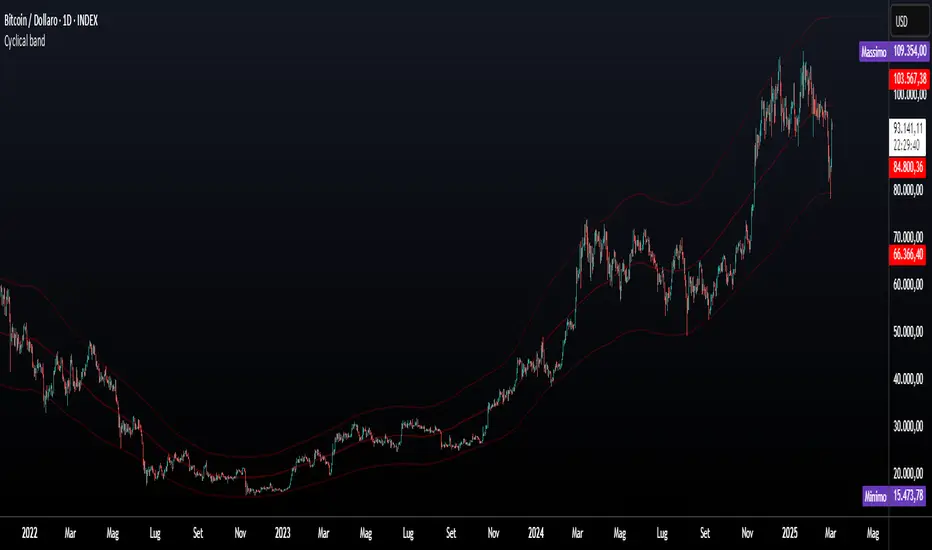
Cyclical bands v1This indicator is the evolution of the Bollinger bands, but adapted to our philosophy of cyclicality!
Highlight the excesses of the cycles.
Its construction is based on our centered medium design.
It works great when paired with our Cyclical Volatility Index indicator.
This fantastic indicator can be set at will!
It is possible to set the bands based on a variation of the standard deviation or percentage!
The bands are dual zones, in the sense that each band can be configured independently from the other, for example:
upper band% variation + 20
lower band% variation +15
For any bugs contact the creators
Cyclical volatility index v1This indicator is used to measure the volatility of the cycle in question.
It is very useful for clearly reading impulsive phases or corrective phases
Calculate average volatility and current volatility
The labels improve the visualization.
It is fully customizable in shapes and colors
C and the ability to disable labels
For any bugs contact the creators

Battleplan 2-Time Cycle v1This chart indicator is one of the most used cyclical analysis tools in the world!
It is possible to set offsets and scales of the battleplan.
Up to six sub-waves added together can be displayed.
With this tool, only 2-times cycles can be displayed.
For any bugs contact the creators

2T sine wave + correlation ranks v1This indicator produces up to 6 sinusoids very useful in the cyclical analysis, moreover a correlation index has been inserted to understand which cycle is more correlated to the price trend.
The degree of correlation is represented by the small dots at the end of the waves.
//The highest is the most correlated; all the others to follow

Quad centered moving averages v1This indicator includes four centered moving average!
The missing periods have been reconstructed with a very complex approximation and projection technique!
The hatched areas are approximations of the missing periods projected into the future.
It is possible to set the centering of the averages through the variable "Approximation Lenght" and the ratio between the main average and the underlying in "Period Partition".
Practical example of setting:
"Approximation Lenght" equal to 2 means that the centering will be of half a period.
"Period Partition" makes sure to cascade all averages by dividing them by the same number.
//Once decided the Main Cycle (default 256) we will get the 4 averages:
-red to 128
-orange 64
-yellow 32
-white 16
This is a great tool for cyclical analysis.
It is not possible, due to the pinescript v4 language limit, to set the average under 35 periods and over 1070 periods.
For any bugs contact the creators
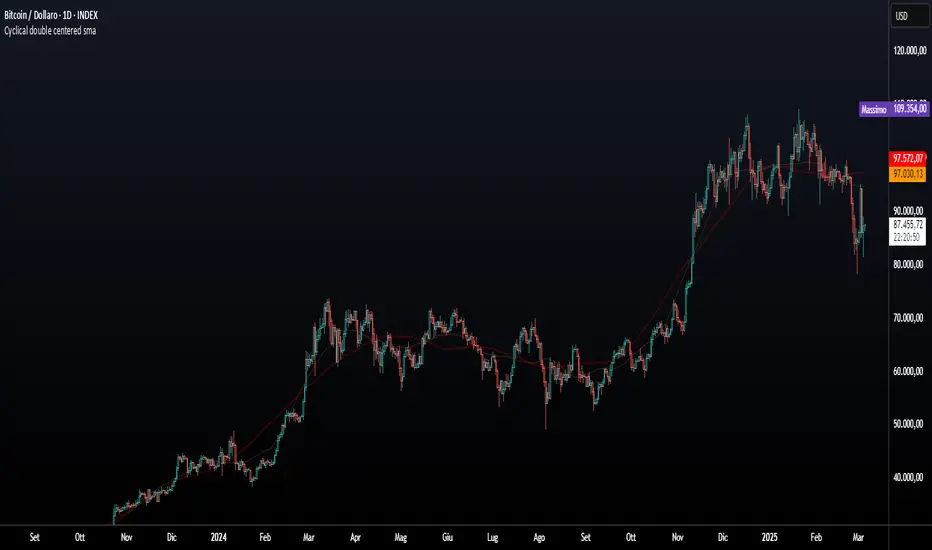
Double centered moving averages v1This indicator is a double centered moving average!
The missing periods have been reconstructed with a very complex approximation and projection technique!
The hatched areas are approximations of the missing periods projected into the future.
It is possible to set the centering of the averages through the variable "Approximation Lenght" and the ratio between the parent average and the underlying in "Period Partition".
Practical example of setting:
"Approximation Lenght" equal to 2 means that the centering will be of half a period
"Period Partition" gives me the possibility to set the second average equal to half the main average if we insert 2 in the variable; equal to the third part if we insert 3 and so on ......
//By default we will have a main period at 256 and a shorter one at 128 (period partition 2), with centering equal to half a period (approximation length 2); if the average is shorter than 64 then I put 4 in the period partition.//
This is a great tool for cyclical analysis.
It is not possible, due to the pinescript v4 language limit, to set the average under 50 periods and over 670 periods.
For any bugs contact the creators