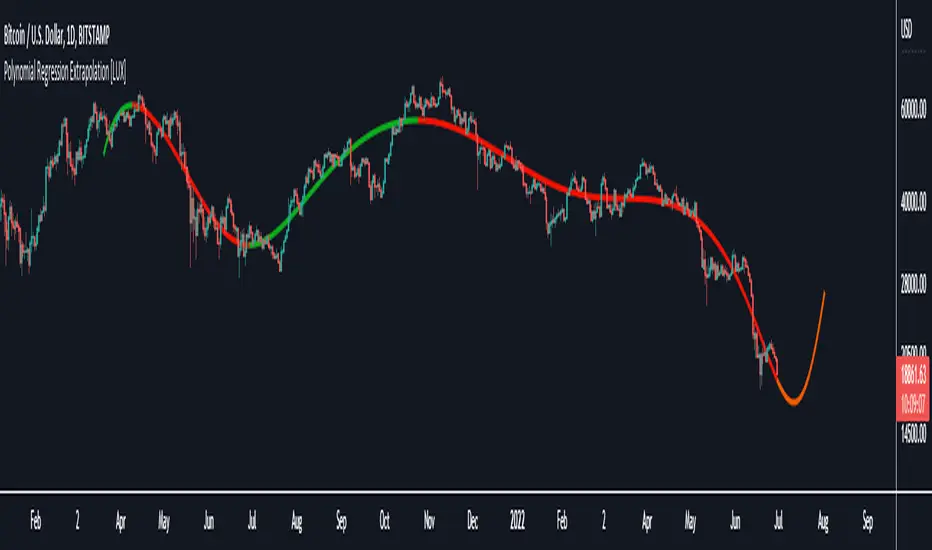
Polynomial Regression Extrapolation [LuxAlgo]This indicator fits a polynomial with a user set degree to the price using least squares and then extrapolates the result.
Settings
Length: Number of most recent price observations used to fit the model.
Extrapolate: Extrapolation horizon
Degree: Degree of the fitted polynomial
Src: Input source
Lock Fit: By default the fit and extrapolated result will readjust to any new price observation, enabling this setting allow the model to ignore new price observations, and extend the extrapolation to the most recent bar.
Usage
Polynomial regression is commonly used when a relationship between two variables can be described by a polynomial.
In technical analysis polynomial regression is commonly used to estimate underlying trends in the price as well as obtaining support/resistances. One common example being the linear regression which can be described as polynomial regression of degree 1.
Using polynomial regression for extrapolation can be considered when we assume that the underlying trend of a certain asset follows polynomial of a certain degree and that this assumption hold true for time t+1...,t+n . This is rarely the case but it can be of interest to certain users performing longer term analysis of assets such as Bitcoin.
The selection of the polynomial degree can be done considering the underlying trend of the observations we are trying to fit. In practice, it is rare to go over a degree of 3, as higher degree would tend to highlight more noisy variations.
Using a polynomial of degree 1 will return a line, and as such can be considered when the underlying trend is linear, but one could improve the fit by using an higher degree.
The chart above fits a polynomial of degree 2, this can be used to model more parabolic observations. We can see in the chart above that this improves the fit.
In the chart above a polynomial of degree 6 is used, we can see how more variations are highlighted. The extrapolation of higher degree polynomials can eventually highlight future turning points due to the nature of the polynomial, however there are no guarantee that these will reflect exact future reversals.
Details
A polynomial regression model y(t) of degree p is described by:
y(t) = β(0) + β(1)x(t) + β(2)x(t)^2 + ... + β(p)x(t)^p
The vector coefficients β are obtained such that the sum of squared error between the observations and y(t) is minimized. This can be achieved through specific iterative algorithms or directly by solving the system of equations:
β(0) + β(1)x(0) + β(2)x(0)^2 + ... + β(p)x(0)^p = y(0)
β(0) + β(1)x(1) + β(2)x(1)^2 + ... + β(p)x(1)^p = y(1)
...
β(0) + β(1)x(t-1) + β(2)x(t-1)^2 + ... + β(p)x(t-1)^p = y(t-1)
Note that solving this system of equations for higher degrees p with high x values can drastically affect the accuracy of the results. One method to circumvent this can be to subtract x by its mean.
Luxalgo
Bollinger Bands Breakout Oscillator [LuxAlgo]The Bollinger Bands Breakout Oscillator is an oscillator returning two series quantifying the significance of breakouts between the price and the extremities of the Bollinger Bands indicator.
Settings
Length: Period of the Bollinger Bands indicator
Mult: Controls the width of the Bollinger Bands
Src: Input source of the indicator
Usage
Each series is calculated by summing the distance between price and a respective Bollinger Bands extremity in the case price is outside this extremity and divided by the sum of the absolute distance between price and a respective extremity. This sum is done over the most recent Length bars.
Bullish breakouts are represented by the green areas of the indicator, while bearish breakouts are represented by the red areas of the indicator.
The oscillator can determine the presence of an uptrend when the bullish area is superior to the bearish area, while a downtrend is indicated by a bearish area being superior to the bullish one. The significance of the breakout is determined by the amplitude of each area, with higher amplitudes indicating more significant breakouts or strong trends.
Using higher Mult values would naturally return wider bands, which would induce less frequent breakouts, this would be highlighted by the oscillator.
In the chart above we can see the oscillator using a multiplicative factor of 2.

Horns Pattern Identifier [LuxAlgo]The following script detects regular and inverted horn patterns. Detected patterns are displayed alongside their respective confirmation and take profit levels derived from the pattern measure rule. Breakout of the confirmation levels are highlighted with labels.
This script is a continuation of the educational idea regarding horns patterns.
Settings
Threshold: Controls the maximum allowed slope of the line connecting two horns, with higher values allowing a higher slope.
Usage
Horn patterns are chart patterns introduced by Bulkowski in his book "Encyclopedia of Chart Patterns". We covered this pattern in the following post: Horn Tops & Bottoms Patterns - How To Find and Trade Them
The script allows the user to quickly determine the presence of a regular or inverted horn pattern, alongside automatically displaying the confirmation level and take profits associated with a detected pattern. These are calculated based on the rules described by Bulkowski.
Horn patterns are highlighted by a line connecting the horns, the dotted lines represent the confirmation level, once the price crosses this level a label will appear, either bullish or bearish depending on the detected pattern. The dashed line represents the take profit level.

Liquidity Heatmap LTF [LuxAlgo]This indicator displays column heatmaps highlighting candle bodies with the highest associated volume from a lower user selected timeframe.
Settings
LTF Timeframe: Lower timeframe used to retrieve the closing/opening price and volume data. Must be lower than the current chart timeframe.
Other settings control the style of the displayed graphical elements.
Usage
It can be of interest to show which candles from a lower timeframe had the highest associated volume, this allows for the highlighting of areas where a candle body was the most traded by market participants.
The area with the highest activity is highlighted in the script with a yellow color (or another user selected color) and additionally by two lines forming an interval.
When the candle body with the highest volume is overlapped by a candle body with lower volume this one will be highlighted instead, hence why certain areas of high activity might not be highlighted by the heatmap.
It is recommended to hide regular candles or use a more discrete graphical presentation of prices when using this tool. Lines are also displayed to highlight the full candle range as well as if a candle was bullish (in green) or bearish (in red). These lines can be hidden if the user is only interested in the heatmap.

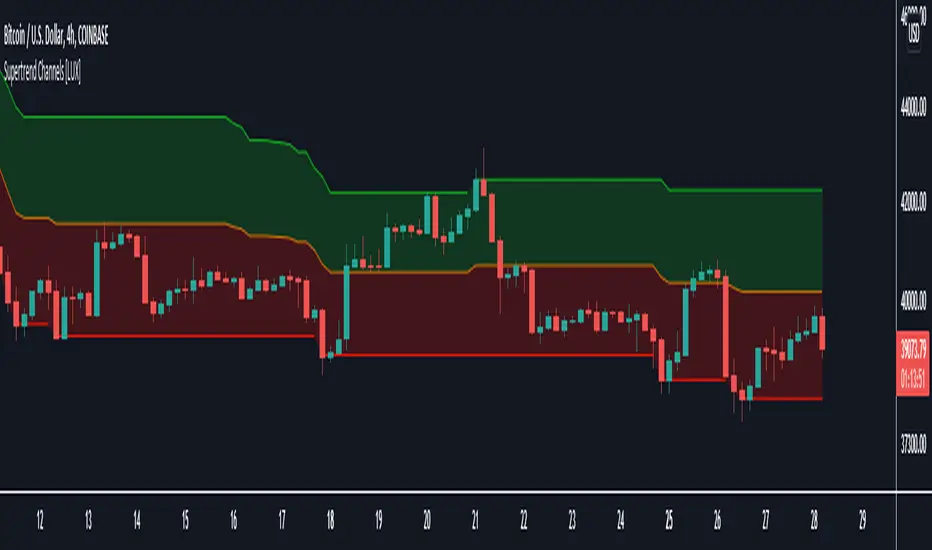
Supertrend Channels [LuxAlgo]The Supertrend is one of the most used indicators by traders when it comes to determining whether the market is up-trending or down-trending.
This indicator is displayed as a trailing stop, showing a lower monotonic extremity during up-trends and an upper monotonic extremity during down-trends. Today we propose a channel indicator based on the Supertrend trailing stop using trailing maximas/minimas.
Settings
Length: Atr length used by the Supertrend indicator.
Mult: Multiplicative factor for the Atr used by the Supertrend indicator.
Usage
The ability of the indicator to show an up-trend or down-trend is the same as the Supertrend, with rising channels when an up-trend is detected by the Supertrend and declining channels when a down-trend is detected by the Supertrend.
The look of the channels can remind of the Donchian channels indicator, and as such a similar usage can be appropriate. The extremities can for example be used as supports and resistances.
Additionally, the channel's average can be used to filter out noisy variations in the price while keeping a good distance from the price.
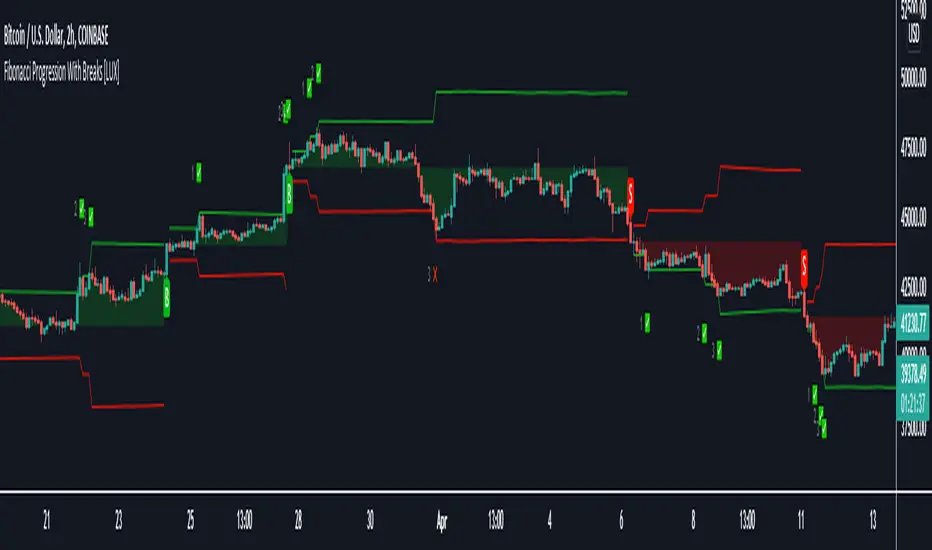
Fibonacci Progression with Breaks [LuxAlgo]This indicator highlights points where price significantly deviates from a central level. This deviation distance is determined by a user-set value or using a multiple of a period 200 Atr and is multiplied by successive values of the Fibonacci sequence.
Settings
Method: Distance method, options include "Manual" or "Atr"
Size: Distance in points if the selected method is "Manual" or Atr multiplier if the selected method is "Atr"
Sequence Length: Determines the maximum number of significant deviations allowed.
Usage
The indicator allows highlighting potential reversal points, but it can also determine trends using the central level, with an uptrend detected if the central level is higher than its previous value and vice versa for a downtrend.
When an uptrend is detected, and the price deviates significantly upward from it a first checkmark will be highlighted alongside the Fibonacci sequence used as a multiplier, if the price deviates downward, a cross will be shown instead, then the distance threshold will be multiplied by the next value in the Fibonacci sequence.
If the price deviates from the central level such that the length of the sequence is greater than the user set Sequence Length , a break label will be shown alongside a new central level with a value determined by the current closing price, while the Fibonacci multiplier will be reset to 1.
Upper and lower extremities made from the central level and threshold distance are highlighted and can be used as support and resistances.
Bart Pattern [LuxAlgo]As a sequel to our 'meme indicator' series... The Bart Pattern Detector identifies confirmed regular and inverted Bart patterns using edge detection.
Settings
Median Lookback: Lookback period of the median filter used for the edge detection, with a shorter period allowing to detect shorter-term and less spaced patterns.
Edge Detection Sensitivity: Sensitivity of the edge detection method, with higher values making the method less sensible to edges of low magnitude.
Range To Edges Threshold: Threshold for the range to edges ratio, with lower values detecting Bart patterns with flatter ranges between the edges.
Show Inverted Barts: Show inverted Bart patterns.
Mode: Determines how detected Bart patterns are displayed.
Usage
This indicator can be used to study past Bart patterns and how the market responded to them. Their detection is not done in real-time. Additionally detected edges are used to indicate the current market sentiment.
If you don't want a meme on your chart, you can also use the simple mode - but don't worry, we won't judge you if you don't...
Details
The origins of Bart patterns can be hard to pinpoint but most likely originate from social media around 2018. This pattern has been mostly covered in the cryptocurrency market similarly to how the McDonald's Pattern became a popular meme within the community. See our McDonald's Pattern Indicator that was created by us as our first 'meme indicator' in the series
The Bart pattern as its name suggests occurs when price forms a structure resembling the head of the Simpson character "Bart Simpson". This is characterized by a rectangular structure, which is a sideways market delimited by sharp volatile edges.
The Bart pattern is sometimes traded before completion, waiting for a breakout of a support/resistance located within the sideway part of the pattern.
The cause of this pattern is still discussed by traders, with some attributing it to over-leveraged market participants and while others attributing it to exchanges themselves through spoofing.
Notes
Barts patterns are very volatile structures, characterized by sudden price jumps, be careful when trading them.
Shout to the famous alien @lilmayo and our good pal @scheplick for the suggestion to create this work of art.
And don't forget to eat your shorts.

Fibonacci Grid [LuxAlgo]The following indicator returns multiple diagonal lines forming a grid. Each line has 45-degree and is set depending on Fibonacci ratios as well as the maximum and minimum price value over a certain lookback period. These can be used as potential support and resistance.
Users also have the option to set equidistant lines instead of having them determined by Fibonacci ratios.
Settings
Length: Lookback period for determining the maximum/minimum price value used for constructing the grid.
Resolution: Grid resolution, higher values will return more lines (only available when the "Use Fibonacci Ratios" is disabled)
Use Fibonacci Ratios: Set the lines based on Fibonacci Ratios, 6 ratios are used.
Usage
Each individual diagonal line can be used as support/resistance. Two Diagonal lines form channels where the price might evolve until a breakout.
The underlying logic of this grid determined by Fibonacci ratios is that price variations farther away from the main diagonals (in orange) would tend to move inside tighter channels.
Diagonals set using Fibonacci Ratios will form tighter channels when away from the center of the Lookback area. While equidistant lines will keep the same distance between each line.

Pivot Based Trailing Maxima & Minima [LuxAlgo]This indicator returns trailing maximums/minimums and the resulting average, each resetting on the occurrence of a pivot point high/low, thus allowing to highlight past and current support and resistance levels.
Note that the user has the option to make the indicator subject to backpainting or not. Backpainting would offset the indicator output to the past and as such would be less suited for real-time applications.
🔶 USAGE
🔹 Non Backpainting
The indicator can highlight points of support and resistance given by the trailing maximum/minimum average.
An uptrend is indicated when the trailing maximum is making a new higher high, while a downtrend is indicated when the trailing minimum makes a new lower low.
🔹 Backpainting
When backpainting is enabled the historical trailing maximum/minimum and their resulting average are offset to the past. However, we extend these to the most recent bar, allowing for real-time applications of the indicator.
Users can easily analyze past trends and determine their type by observing the trailing maximum/minimum behavior. For example, trailing maximums/minimums not making new higher high/lower low would indicate a ranging market.
The frequency of new higher high/lower low can also help determine how bullish/bearish a trend was.
🔶 SETTINGS
Length: Determines the pivot high/low lookback, with higher values allowing to detect longer-term tops and bottoms.
Backpaint: Determine if the indicator is subject to backpainting. Enabling this setting would offset the returned results in the past.

Cubic Bézier Curve Extrapolation [LuxAlgo]The following script allows for the extrapolation of a Cubic Bézier Curve fit using custom set control points and can be used as a drawing tool allowing users to estimate underlying price trends or to forecast future price trends.
Settings
Extrapolation Length: Number of extrapolated observations.
Source: Source input of the script.
Style
Width: Bézier curve line width.
Colors: The curve is colored based on the direction it's taking, the first color is used when the curve is rising, and the second when it is declining.
The other settings determine the locations of the control points. The user does not need to change them from the settings, instead only requiring adjusting their location on the chart like with a regular drawing tool. Setting these control points is required when adding the indicator to your chart.
Usage
Bézier curves are widely used in a lot of scientific and artistic fields. Using them for technical analysis can be interesting due to their extrapolation capabilities as well as their ease of calculation.
A cubic Bézier curve is based on four control points. Maxima/Minimas can be used as control points or the user can set them such that part of the extrapolated observation better fits the most recent price observations.
A possible disadvantage of Bézier curves is that obtaining a good fit with the data is not their primary goal. Rational Bézier curves can be used if obtaining a good fit is the primary user goal.
Details
At their core, Bézier curves are obtained from nested linear interpolation between each control point and the resulting linearly interpolated results. The Bézier curve point located at the first control point P0 and the last curve point located at the last control point Pn are equal to their respective control points. However, this script does not make use of this approach, instead using a more explicit form.
As mentioned previously, the complexity of a Bézier curve can be determined by its number of control points which is related to the Bézier curve degree (number of control points - 1). Instead of using nested linear interpolations to describe Bézier curves, one can describe them as a polynomial of a degree equal to the degree of the wanted Bézier curve.

SuperIchi [LuxAlgo]Using one indicator as the core for another one to improve certain aspects while offering an alternative user interaction can be very interesting in technical analysis.
This indicator is a modification of the popular Ichimoku indicator using the equally popular Supertrend indicator as its core, thus no longer entirely relying on calculations done over a fixed window size but instead relying on the average true range and the trend detection method offered by the Supertrend.
Settings
Tenkan: Atr length (left) and factor (right) used for the Supertrend involved in the calculations of the Tenkan Ichimoku component
Kijun: Atr length (left) and factor (right) used for the Supertrend involved in the calculations of the Kijun Ichimoku component
Senkou Span B: Atr length (left) and factor (right) used for the Supertrend involved in the calculations of the second Senkou Span Ichimoku component
Displacement: Bar offset of the cloud (positive offset) and Chikou (negative offset)
Usage
The SuperIchi indicator can be interpreted similarly to a regular Ichimoku as it retains the components and aspects from this one. Users can make use of the Supertrend Factor to detect shorter or longer-term trends.
Unlike the regular components of the Ichimoku based on rolling maximums/minimums, using the Supertrend here allows smoother components and makes it less prone to whipsaw signals.
Note that the Chikou is disabled by default in the style settings
Details
The original Ichimoku indicator is constructed from the average between the rolling maximum high and minimum low values. The Supertrend indicator also relies on one upper/lower extremity but using the average of these extremities for the modification of the Ichimoku indicator might not provide easy to use results due to the nature of these extremities.
Instead, we compute the average between the Supertrend and trailing maximums/minimums with a value reset when a new trend is detected by the Supertrend. This allows obtaining a result that is closer to the original average used by Ichimoku.

Pivot Points High Low & Missed Reversal Levels [LuxAlgo]Pivot Points High/Low, sometimes referred to as "Bar Count Reversals" allows highlighting market prices local tops and bottoms. This method compares the price value at a certain index within a user-specified window length and tests whether it is the highest (pivot high) or lowest (pivot low).
This method can return successive pivots of the same type, thus missing certain reversals, as such, we aimed to highlight those missed reversals and provide a level at their location to determine if they had any significant role to play. A zig-zag is additionally built, connecting regular pivots with missed reversals.
Settings
Pivot Length: Determine the "Bar Count Reversals" window size. higher values will highlight more significant reversals.
Other settings control the look of the displayed graphical elements within the indicator.
Usage
Missed reversals are highlighted by labels with a ghost emoji, a Zig-Zag line connecting a missed reversal is dashed. Note that labels are offset by -Pivot Length bars (with the exception of the most recent one), and as such are detected further ahead of their location.
When a missed reversal is detected, a level is displayed, starting at the location of the missed reversal and ending when a new missed reversal is detected.
These levels can be used as support and resistance.
The most recent label estimates the possible location of a confirmed reversal, and will continuously readjust whether price makes a new higher high/lower low depending on the type of previously detected pivot. A level is also made out of this estimated reversal.

McDonald's Pattern [LuxAlgo]Tradingview asked, we delivered. This script fits a cubic Bezier curve using tops/bottoms in order to approximate a McDonalds pattern, a popular meme pattern in the crypto trading community.
Traditionally the McDonalds pattern is described by an M pattern with deep retracement (> 50%), forming a McDonalds logo.
Please note that this indicator is a meme & should not be taken seriously. Some aspects of this indicator are not real-time and meant for descriptive analysis alongside other components of this script, in this case, for entertainment purposes. We suggest looking through our other open-source scripts if you’re looking for more serious tools.
🔶 USAGE
The script fits Bezier curves using specific tops/bottoms as control points. When the distance between tops and bottoms values is relatively small, the user can more easily identify the pattern.
A score is shown on the top right of the chart, aiming to return how close the returned pattern is to the original logo.
A regular Mcdonalds pattern would return a red background, while an inverted pattern would return a green one.
🔶 SETTINGS
Length: Sensitivity of tops/bottoms detection. The method does not make use of pivot points, using rolling maximums/minimums instead.
Use First Bar As Vertex: Use the price and bar index of the last bar as vertex.

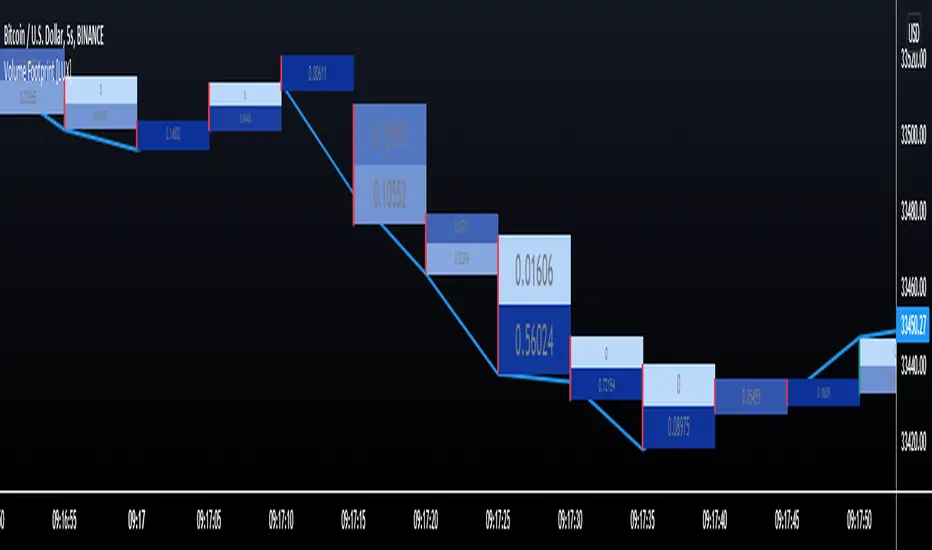
Volume Footprint [LuxAlgo]This indicator estimates a volume footprint using tick data. The script automatically separates a candle into equidistant intervals with a width obtained from the average true range or a user-given width.
Settings
Method: Interval width calculation method. This ultimately determines the number of intervals separating one candle.
Width (At the right of Method): Atr period or user given width depending on the selected method. A lower user-given width would divide a candle into a higher number of intervals.
As Percent: Returns the accumulated volume within each interval as a percentage of the total candle volume.
Style
Display Type: Determines the appearance of the returned volume footprint.
Trend Color: Color to use based on whether a candle is bullish or bearish.
Usage
When applied to a chart, the user will be asked to select the settings to use for the volume footprint. Note that changing the settings afterward will reset the volume footprint, removing previously generated footprints.
A new footprint will appear on the confirmation of a new bar, as such this version might only be useful in lower timeframes.
A volume footprint allows users to see the number of contracts exchanged within a candle interval. It can as such be seen as some kind of intrabar volume profile.
This can be useful to see areas of interest within a candle.
Different Appearance
By default, the volume footprint makes use of colored boxes with a color based on whether the candle was bullish or bearish.
Another appearance that gives additional information is the gradient type, which uses intervals color based on the number of contracts exchanged within an interval relative to the total volume of the candle. A higher number of contracts within an interval would return a darker color by default.
The regular display type makes use of boxes with a single color, with lines on the side indicating whether the candle was bullish or bearish.
Trendlines with Breaks [LuxAlgo]The trendlines with breaks indicator return pivot point based trendlines with highlighted breakouts. Users can control the steepness of the trendlines as well as their slope calculation method.
Trendline breakouts occur in real-time and are not subject to backpainting. Trendlines can however be subject to repainting unless turned off from the user settings.
The indicator includes integrated alerts for trendline breakouts.
🔶 USAGE
Any valid trendlines methodology can be used with the indicator, users can identify breakouts in order to infer future price movements.
The calculation method of the slope greatly affects the trendline's behaviors. By default, an average true range is used, returning a more constant slope amongst trendlines. Other methods might return trendlines with significantly different slopes.
Stdev makes use of the standard deviation for the slope calculation, while Linreg makes use of the slope of a linear regression.
The above chart shows the indicator using "Stdev" as a slope calculation method. The chart below makes use of the "Linreg" method.
By default trendlines are subject to backpainting, and as such are offset by length bars in the past. Disabling backpainting will not offset the trendlines.
🔶 SETTINGS
Length: Pivot points period
Slope: Slope steepness, values greater than 1 return a steeper slope. Using a slope of 0 would be equivalent to obtaining levels.
Slope Calculation Method: Determines how the slope is calculated.
Backpaint: Determine whether trendlines are backpainted, that is offset to past.

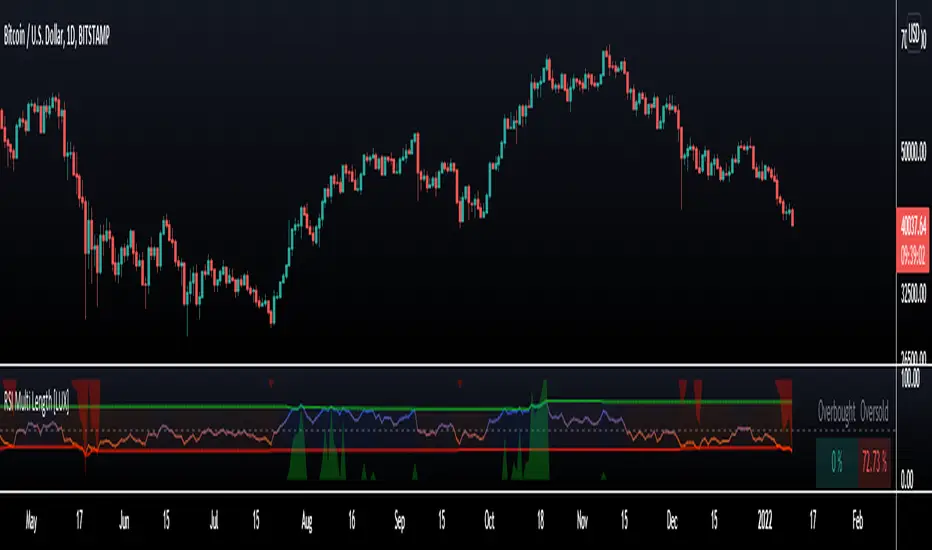
RSI Multi Length [LuxAlgo]The following indicator aims to return information over RSIs using multiple periods, including the percentage of RSIs of different periods being overbought/oversold, as well as the average between these multiple RSIs.
The percentage of RSIs of different periods being overbought/oversold is additionally used to return adaptive overbought/oversold levels.
Settings
Maximum Length: Maximum period of the RSI used for the indicator calculation
Minimum Length: Minimum period value of the RSI used for the indicator calculation
Overbought: Value of the overbought level
Oversold: Value of the oversold level
Src: Input source of the indicator
Usage
The main element of the indicator is given by the multi-length RSI average, returning an oscillator similar to a fixed-length RSI. Because of its multiple length nature, the indicator can reflect shorter to longer-term price variations depending on the Maximum/Minimum length range defined by the user.
The green area indicates the percentage of RSIs over the user-defined overbought level. The red area indicates the percentage of RSIs under the user-defined oversold level, this percentage is inverted for ease of visualization. Additionally, a dashboard at the top right of the indicator pane indicates these percentages for the most recent bar.
A lower percentage of overbought/oversold RSIs can indicate a potential shorter-term retracement.
These percentages are used to construct adaptive overbought/oversold levels for the average multi-length RSI. The overbought level will be easier to reach if the percentage of overbought RSI's is high, the same logic applies to the adaptive oversold level.
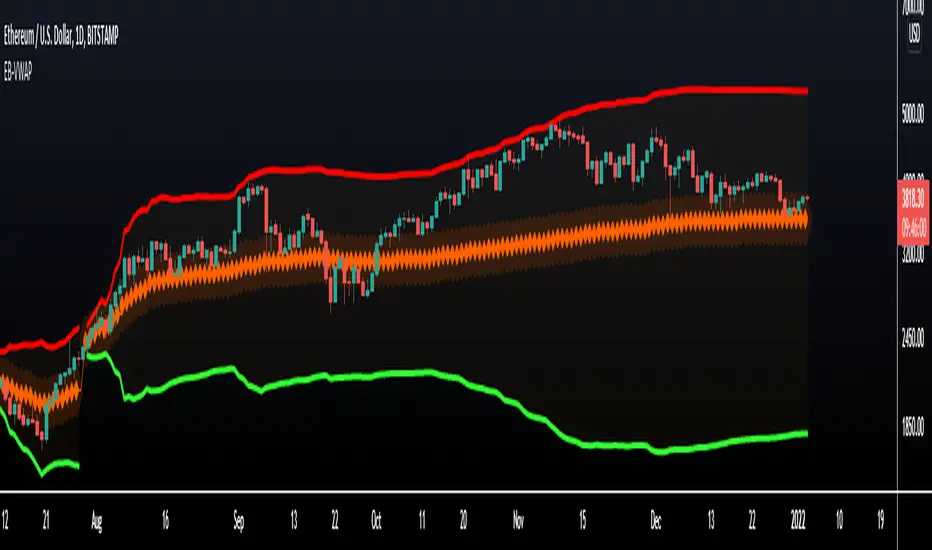
VWAP Bands - Event Based [LuxAlgo]This indicator returns VWAP bands with a degree of smoothness resetting based on various user-selected events. The bands are constructed using a VWAP based naive standard deviation.
The indicator can be anchored or start from the first bar and can be used as trailing support/resistance, in a moving average crossover system, or as source for external indicators.
Settings
Start: VWAP anchor point
Start At First Bar: Display the VWAP from the first bar instead of a specified anchor point
VWAP
Length: Controls certain characteristics of the user-selected event
Mult: Multiplicative factor for the VWAP standard deviation
Source: Price source of the indicator
Event
Event: Determines the event resetting the degree of smoothness of the VWAP
External Cross/Event: Input source used for external crosses/events
Further details about the available events are given below.
Details
Various event conditions are available to the users. When the selected event occurs, the VWAP equals the current closing price.
By default, the event is periodic, that is the VWAP resets periodically, with a period determined by the Length setting.
The Higher High event resets the VWAP when a new higher high occurs.
The Lower Low event resets the VWAP when a new lower low occurs.
The Trend Change event is similar however resets the VWAP only once a higher high or lower low occurs. Higher highs and lower lows are given by Donchian channels with a period determined by the Length setting.
The Start event reset the VWAP at the selected anchor point (or first bar if the "Start At First Bar" setting is selected). This can be useful if one only needs a regular anchored VWAP band indicator.
The External Cross event resets the VWAP when the Source price crosses the series selected in the External Cross/Event setting. In the image above the VWAP resets when the price crosses the volatility stop indicator.
The External Event resets the indicator when a series selected in the External Cross/Event setting is not equal to 0. This allows using a custom event in order to reset the VWAP. In the above example the VWAP is reset during a new session due to the External Session indicator.
Harmonic Pattern Detection [LuxAlgo]Harmonic patterns make up a major part of the many patterns traders use to make investment decisions. The following tool aims to automatically categorize which XABCD harmonic pattern is highlighted by the user and to alert when the price reaches the PRZ or D point.
The tool can categorize Bat, Gartley, Butterfly, and Crab patterns.
Settings
XA Precision: The Gartley and Butterfly patterns require precise ratios for the XA segment, this setting allows giving some headroom for the detection of these patterns. For example, the Gartley pattern requires a ratio for the XA segment of 0.618, using an XA precision of 0.01 will allow the segment to be considered correct if above 0.608 and under 0.628.
Bullish: Color of a bullish pattern
Bearish: Color of a bearish pattern
The X, A, B, C, D settings determine the location of the harmonic pattern vertices. The user does not need to change them from the settings, instead only requiring adjusting their location on the chart like with a regular drawing tool. Setting these vertices is required when adding the indicator to your chart.
Usage
Upon setting the harmonic pattern vertices, the segments, as well as each ratio and PRZ, will be displayed. A dashboard in the top right displays which harmonic pattern has been detected.
Detected bearish crab pattern on BTCUSD15.
Bullish butterfly pattern on MATICUSD15. It is important not to use an XA precision value that would return overlapping ranges between the Gartley/Harmonic and other patterns. Using the default value is recommended.
The upper limit of the PRZ is determined as vertex D plus 38.2% of segment DX, while the lower limit is the vertex D minus 38.2% of segment DX. Various methods exist for the determination of the PRZ, this one is general but the user can use one proper to the detected harmonic pattern.
Finally hovering on the label highlighting the segment ratios return the proper ratio used by each harmonic pattern for that precise segment.

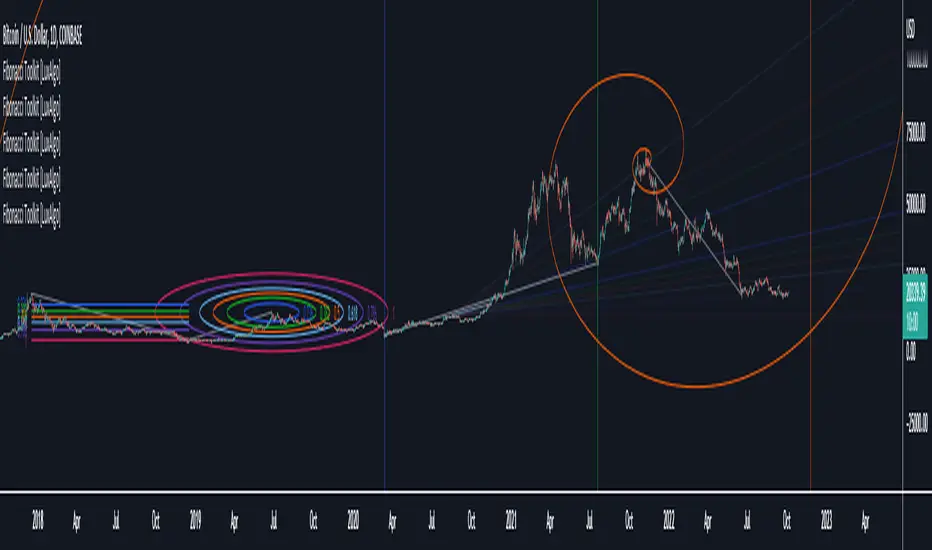
Fibonacci Toolkit [LuxAlgo]This toolkit aims to display multiple Fibonacci drawing tools including retracements, arcs, circles, fans, timezones and spirals.
Usage
Upon adding the indicator to the chart, users will be prompted to choose a starting point and an ending point for the calculation of the drawing tools.
Users can then navigate to the settings of the toolkit and choose which drawing tool to display using the Fibonacci drop-down menu. Users are also free to change the default Fibonacci ratios used by the indicator from within the settings. Each tool is described below.
Retracements
Fibonacci retracements display multiple levels constructed using the starting price point, ending price point, and multiple Fibonacci ratios. These levels can be used as support and resistance.
Arcs
Fibonacci arcs display multiple semi-circles. Each semi-circle crosses the line connecting the starting & end price point at a certain percentage determined by Fibonacci ratios. These arcs can be used as support and resistance.
Circles
The Fibonacci circles are similar to the Fibonacci arcs but display a full circle instead. Users can expect the price to bounce off of the circles.
This tool is less commonly used by traders.
Fan
A Fibonacci fan is a tool displaying trendlines all connected to a starting point and extending to a point determined by Fibonacci ratios. These can also be used as support and resistance.
Timezone
Fibonacci timezones return a series of horizontal lines. The distance of the lines increases by a factor given by the numbers in the Fibonacci sequence.
This tool can be useful to highlight points where a trend might reverse assuming that their duration increases over time.
Spiral
The Fibonnaci spiral displays a spiral that grows by a factor given by the golden ratio. This indicator returns a spiral using 7 turns (5 internal) and sets the origin of the spiral to the ending point which is selected by the user. The height of the spiral is based on the price range between the starting point and ending point.
Note that potential display artifacts can be seen when fitting the spiral on stocks and forex pairs.
Circular Barplot - Oscillators Sentiment [LuxAlgo]This indicator is an implementation of a circular barplot aiming to return the market sentiment given by multiple normalized oscillators. These include the relative strength index (RSI), Stochastic %K (%K), Linear Correlation Oscillator (ROSC), William Percent Range (WPR), Percent Rank (%R), and money flow index (MFI).
The length period of each of these oscillators can be adjusted in the indicator settings.
The label in the center of the circular plot returns the average market sentiment constructed from all the previously mentioned oscillators.
Settings
Width: Circle width.
Spacing: Determines how close each circle is to the other.
Thickness: Width of the colored lines.
Offset: Controls how far the circular barplot left extremity is from the most recent candles.
Src: Input source of the indicators.
Usage
Unlike regular bar charts, circular bar plots display the bars as circle arcs and have the advantage of preserving horizontal and vertical space. A higher arc length would indicate a value closer to the maximal value of the oscillator. Other variations of the circular barplots exist but this variation using the circle arc is particularly appropriate for normalized data.
The indicator can be used as a simple widget giving a quick method to obtain the overall market sentiment of a certain ticker. A dashboard is displayed on the top left of the chart in the event the user wants to see the actual value of the oscillators.
Note that low width or high spacing settings might return unwanted results.

Moon Phases Strategy [LuxAlgo]Trading moon phases has become quite popular among traders, believing that there exists a relationship between moon phases and market movements. This strategy is based on an estimate of moon phases with the possibility to use different methods to determine long/short positions based on moon phases.
Note that we assume moon phases are perfectly periodic with a cycle of 29.530588853 days (which is not realistically the case), as such there exists a difference between the detected moon phases by the strategy and the ones you would see. This difference becomes less important when using higher timeframes.
Settings
New Moon Reference Date: Date of a new moon to be used as starting point for the cycle calculation. Buy: Determine the condition to be used to open a long position Sell: Determine the condition to be used to open a short position
Description
The strategy can use different buy/sell conditions, these are determined in the Buy/Sell settings drop-down menu.
By default, the strategy goes long on a new moon and short on a full moon. This setup is common since full moons are said to be related to depressed mood. However, it is possible to use inverse conditions.
Users can also go long on higher moons (new moons or full moons occurring at a price that is higher than the previous one when a new/full moon occurred) and short on lower moons, this would return a trend following strategy, using the inverse conditions (buy lower moons/sell higher moons) would return a contrarian strategy.
The above chart displays the strategy using default conditions.
The above chart displays the strategy of going long on a higher moon and selling on a lower moon.
Quick Summary
We provide a quick summary of the strategy using default conditions (buy on a new moon, sell on a full moon) on various tickers using the 4h timeframe (note that using a lower timeframe would return a backtest executing a lower number of trades).
Constant position sizing is used and no frictional costs are considered.
BTCUSD
The moon phases strategy has been regularly tested with BTCUSD, with traders highlighting how moon phases tend to occur during tops/bottoms. We test the strategy from 2019-01-06 00:00.
Net Profit: $68544.86 Closed Trades : 67 % Profitability : 50.75 Max Drawdown : $18541.24 Max
TSLA
The strategy is tested from 2011-01-04 14:30
Net profit: $349.17 Closed Trades : 265 % Profitability : 54.34 Max Drawdown : $262.72
EURUSD
The strategy is tested from 2018-01-16 14:00.
Net profit: $-0.18 Closed Trades : 91 % Profitability : 50.55 Max Drawdown : 0.36

Orion Algo Strategy v2.0Hi everyone.
I decided to make the latest Orion Algo open to people. I don't have enough time to work on it lately, so I figured it would be best that everyone can have it to work on it. I took out some stuff from the original but it should give an idea on how things work. I made two strategies with this so far so you can use that to come up with your own. I recommend the DCA strategy because it gives you the most bang for Orion Algo's buck. It's pretty good at finding long entries.
Overall I hope you guys like this one. Also, Banano is the best crypto currency :)
-INFO-
Orion Algo is a trading algorithm designed to help traders find the highs and lows of the market before, during, and after they happen. We wanted to give an indicator to people that was simple to use. In fact we created the algorithm in such a way that it currently only needs a single input from the user. Since no indicator can predict the market perfectly, Orion should be used as just another tool (although quite a sharp one) for you to trade with. Fundamental knowledge of price action and TA should be used with Orion Algo.
Being an oscillator, Orion currently has a bias towards market volatility . So you will want to be trading markets over 30% volatility . We have plans to develop future versions that take this into account and adjust automatically for dead conditions. Also, while there are some similarities across all oscillators, what sets ours apart is the prediction curve. The prediction curve looks at the current signal values and gives it a relative score to approximate tops and bottoms 1-2 bars ahead of the signal curve. We also designed a velocity curve that attempts to predict the signal curve 2+ bars ahead. You can find the relative change in velocity in the Info panel. The bottom momentum wave is based on the signal curve and helps find overall market direction of higher time-frames while in a lower one.
Settings and How to Use them:
User Agreement – Orion Algo is a tool for you to use while trading. We aren’t responsible for losses OR the gains you make with it. By clicking the checkbox on the left you are agreeing to the terms.
Super Smooth – Smooths the main signal line based on the value inside the box. Lower values shift the pivot points to the left but also make things more noisy. Higher values move things to the right making it lag a bit more while creating a smoother signal. 8 is a good value to start with.
Theme – Changes the color scheme of Orion.
Dashboard – Turns on a dashboard with useful stats, such as Delta v, Volatility , Rsi , etc. Changing the value box will move the dashboard left and right.
Prediction – A secondary prediction model that attempts to predict a reversal before it happens (0-2bars). This can be noisy some times so make your best judgement. Curve will toggle a curve view of the prediction. Pivots will toggle bull/bear dots.
∆v – Delta v (change in velocity). This shows momentum of the signal. Crossing 0 signals a reversal. If you see the delta v changing direction, it may signify a reversal in the several bars depending on the overall momentum of the market.
Momentum Wave – Uses the signal as a macro trend indicator. Changes in direction of the wave can signify macro changes in the market. Average will toggle an averaging algorithm of the momentum waves and makes it easy to understand.
-STRATEGIES-
Simple - Just buy and sell on the dots
DCA - Uses the settings in the script for entries. If a buy dot appears then it will buy, if the price goes below the percentage it will wait for another dot before entering. This drastically improves DCA potential.

Linear Regression Histogram [LuxAlgo]This indicator is inspired by traditional statistical histograms. It will return the number of occurrences of price falling within each interval (bins) of the linear regression channel. This can be useful to highlight zones of interest within a trend.
Settings
Length: Number of recent closing prices used for the computation of the linear regression.
Bins Number: Number of intervals constructed from the linear regression channel.
Mult: Multiplicative factor for the RMSE. Controls the width of the linear regression channel.
Src: Input source of the indicator.
Usage
The indicator is constructed by dividing the linear regression channel range into a series of intervals (bins) of equal width. We then count the number of price values falling within each interval.
If a significant number of price values fall within a specific interval then that interval can highlight a potential zone of interest within a trend.
The zone of interest is highlighted in blue.
