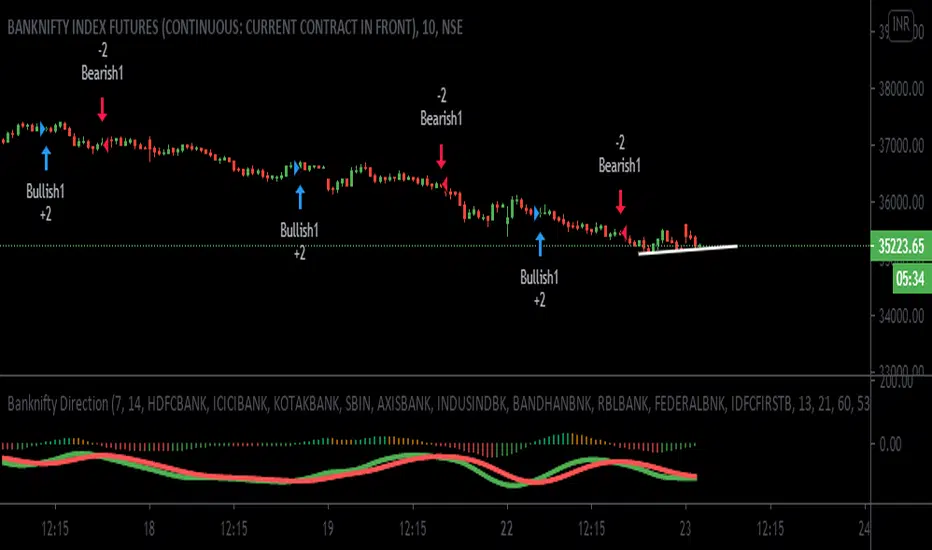
Banknifty-Direction-Bank-StocksBanknifty Direction Bank Stocks is indicator to give Banknifty future direction.
This Indicator is giving signal by taking 11 Major Indian Bank trend into consideration.
This indicator is giving two signal Bullish and Bearish .
Bullish signal can be used for long Banknifty and Bearish signal can be used to close existing Banknifty position and make new short side position and again when Bullish signal come then close existing short position and take new long position and so on.
There is zone area green zone and red zone and central line. Green zone is Bullish area and Red zone is Bearish area.
When ever green line cross over red line then Bullish signal generated and when ever green line cross under red line Bearish Signal generated.
Strong Bullish when Crossover is happening above central line and Strong Bearish when Cross under is happening below central line.
Many Thanks to LazyBear main author, I have used his wave trend function and modified that as per Banknifty index so that we can get better result.
User must keep the default setting for getting better results as results are back tested. If setting changed then result may vary.
I have added here back tested performance user can see those results. I have added commission and slippage as well.
This indicator is available on Subscription.
PM/DM for more information about the script access.
Use the link below to obtain access to this indicator
M-oscillator
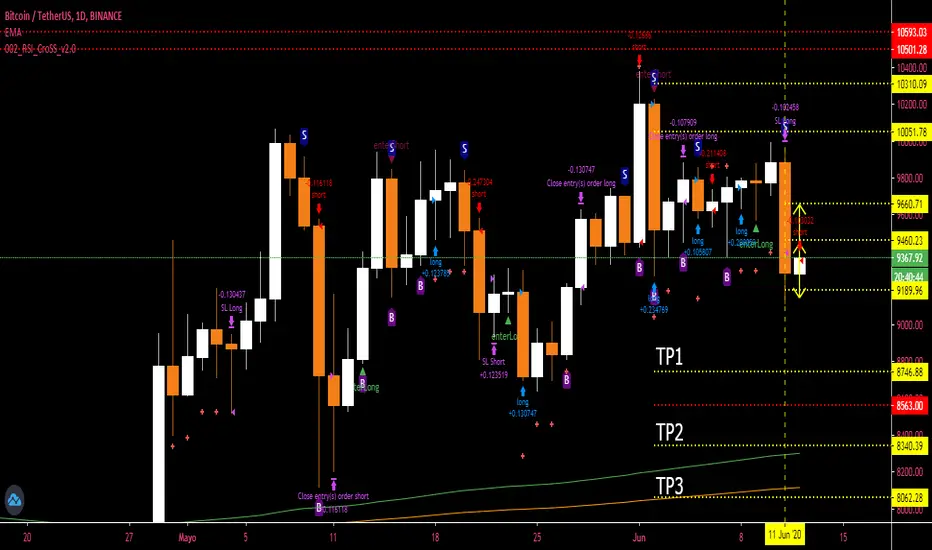
002_RSI_CroSS_v2.0 strategy-----this is a strategy the trend quality based on an RSI, in BINANCE on a daily basis, it only works on a daily basis, it has a trailing stop which removes it from the operation, I hope it works.
-----esta es una estrategia la cualidad de tendencia basada en un RSI, en BINANCE en temporalidad diaria, solo funciona en diario, tiene un trailing stop la cual lo saca de la operacion, espero les sirva
vertex reversal indicator (lirshah)vertex reversal strategy has been written based on vertex reversal indicator, this new indicator is a combination of three different indicator: Momentum, Moving Averages and Bollinger Bands.
this strategy has been written based on current bar calculation so no repainting occurs.
in order to access script contact me directly.

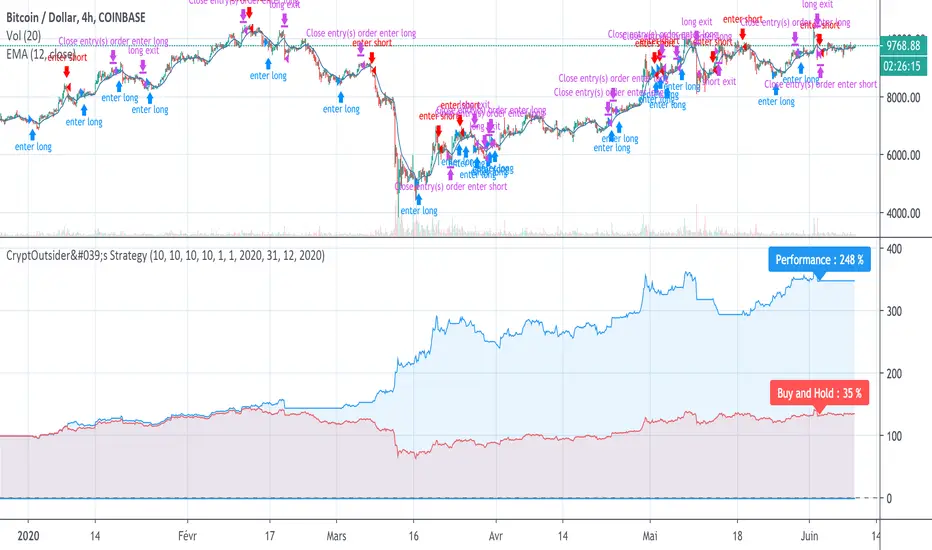
CryptOutsider's StrategyDear Tradingview user,
The present script is a BTC strategy backtest tool based on a proprietary algorithm. The performance calculated (blue on the graph) is compared to a "Buy and Hold" position (red on the graph). You can also compare it with other published strategies or even your own one !
It works with buy/sell signals of an oscillator calculated with both price and volume, evaluating accumulation and distribution over a period.
Please use the ticker COINBASE:BTCUSD, on a 4h resolution (or it won't work).
By default the following conditions used are :
Relative part of equity invested per trade : 10 %
Initial capital : 100 $
Leverage : x10
Commission fees : 0,1%
Slippage : 5 ticks
Feel free to change it in order to reflect your commission or slippage conditions on the strategy's panel (double click on the equity curve or the configuration button). Conditions can also be changed in order to improve performance while seeking a bearable drawdown (speaking of which, a relative part equity could be increased up to 30% with an acceptable drawdown).
Starting and finishing dates for the backtest can also be changed in the panel.
All the best using the strategy !
CryptOutsider
Remark : The backtesting timeframe is partial as the very last week is not available.
VK trend scalper 30mThis strategy is designed to be used on the 30 minute time frame
In this strategy, I actually implemented my own scalping style into building the strategy. Having to replicate my own trading strategy into an algorithm, I can't make it exactly perfect to how I would trade, but what I can do is try and program the parameters that give it the absolute best chance of making a big move with a small drawdown- which replicates part of my trend trading style. Here I am using VWMA , EMA and trend filtering values to find trend change and best entries.
you can also try it on any cryptocurrency/forex/commodity/stocks
*This script is currently experimental you can try it if you want.

Swing trading StrategyThis indicator based on capturing historical swing. It predicts future swing based on historical swing data. This is very useful for short term swing trading and gives best result on 30 minute chart.

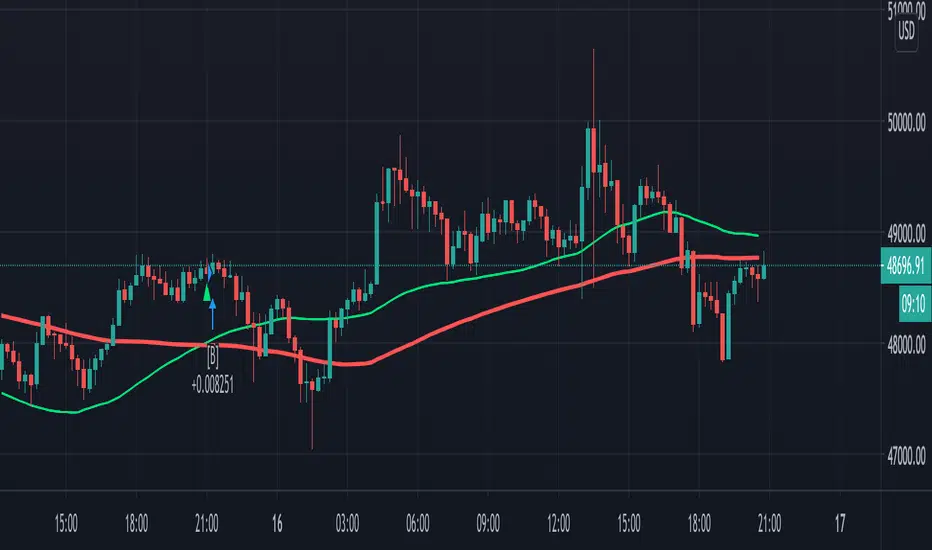
Volume Based Buy/SellThis is my very first scrip on this platform. It's the first version of the script, It works on the volume-based moving averages and exponential moving average.
I have added the buy/sell signals for educational purposes only. While adding the buy/sell signal I have an additional check on the strength of the trend to reduce loss to a minimum.
How to use:
1. Use with Heikin Ashi Chart.
2. Use 15 Min timeframe for intraday.
Some improvements I am working in the near future is:
1. Exit tread with the maximum profit.
2. Reduce down false trad to 0%.
To encourage and support please like the script try using for your own paper trading.
Dont forget to leave a comment on if you see any improvement in the script or any idea you have. Happy treading together.

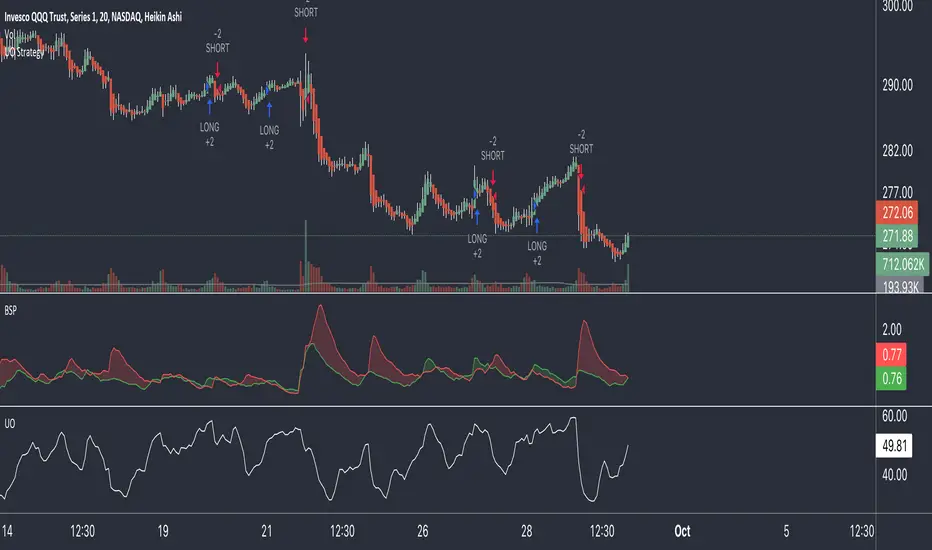
UO StrategyStrategy is based on UO and its derivatives.
Quite fast to price changes and flexible to different time frames considering risk management.
I had many versions of UO strategy, but so far this one is the safest.
Systematic Momentum strategy v 1.0Systematic Momentum strategy v 1.0
This is a long-only strategy optimized taking into consideration the underlying's momentum and volatily.
Long story short it opens positions when the momentum is highest and the risk is lowest and closes the same position when the risk-to-reward is no longer optimal.
How to use:
-> To be used on an Index or a tracker ETF
-> Position sizing should be set up to 100% of the portfolio

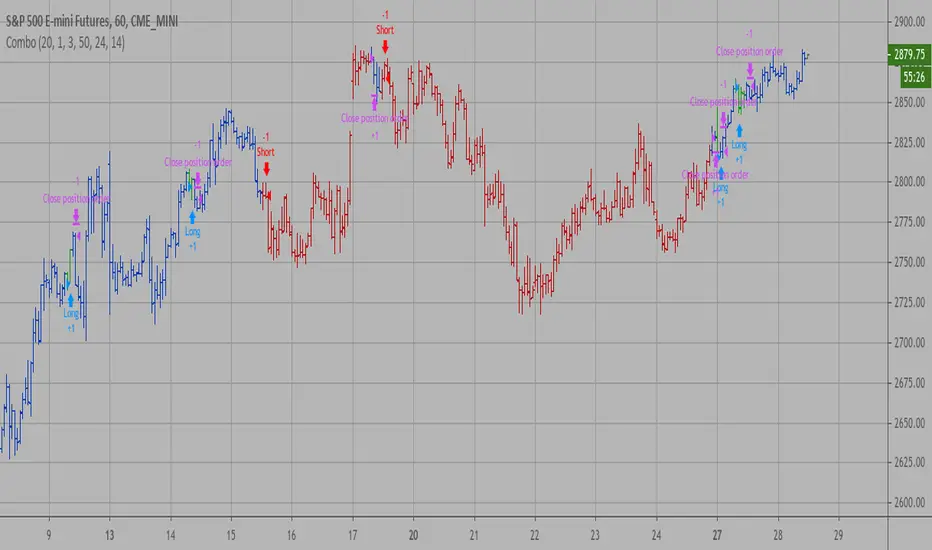
Combo Backtest 123 Reversal & Elder Ray (Bear Power) This is combo strategies for get a cumulative signal.
First strategy
This System was created from the Book "How I Tripled My Money In The
Futures Market" by Ulf Jensen, Page 183. This is reverse type of strategies.
The strategy buys at market, if close price is higher than the previous close
during 2 days and the meaning of 9-days Stochastic Slow Oscillator is lower than 50.
The strategy sells at market, if close price is lower than the previous close price
during 2 days and the meaning of 9-days Stochastic Fast Oscillator is higher than 50.
Second strategy
Developed by Dr Alexander Elder, the Elder-ray indicator measures buying
and selling pressure in the market. The Elder-ray is often used as part
of the Triple Screen trading system but may also be used on its own.
Dr Elder uses a 13-day exponential moving average (EMA) to indicate the
market consensus of value. Bull Power measures the ability of buyers to
drive prices above the consensus of value. Bear Power reflects the ability
of sellers to drive prices below the average consensus of value.
Bull Power is calculated by subtracting the 13-day EMA from the day's High.
Bear power subtracts the 13-day EMA from the day's Low.
You can use in the xPrice any series: Open, High, Low, Close, HL2, HLC3, OHLC4 and ect...
WARNING:
- For purpose educate only
- This script to change bars colors.


Patron04 TOFF MACD DEMA StrategyI prepared the macd dema indicator made by Toff as a startegy test. There is another strategy like this. But the process is opened according to the intersection of macd and signal. But the difference between my test is this. Macd is testing according to the intersection of 0 value. Macd sells 0 when cut down, buying when 0 cuts down
Toff's Macd dema:

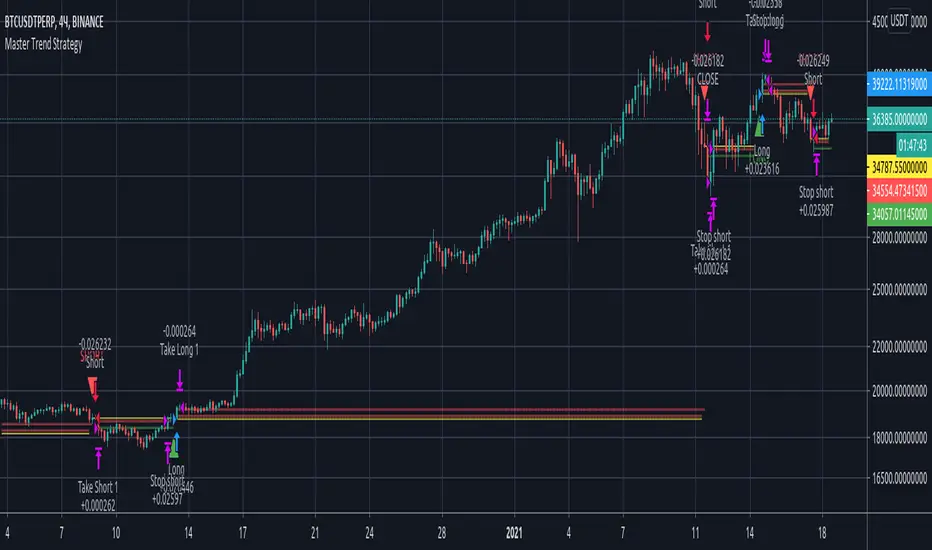
Master Trend StrategyStrategy for the Master Trend indicator. The screen shows a strategy with a deposit of 100 USD. By default, the strategy is STOP TREND. You can setup the strategy to MAIN TREND, if check off "Use stop" and "Use take 1 amount". Default strategy set stop by market when price reached first take and close by revert signal. MAIN TREND strategy trade from signal to signal use deep first take. Adjusting the settings you can create you own strategy.
This strategy has slippage equal 20 and commission 0.02% like on most of exchanges.
Can I get access?
Use the link below to obtain access to this indicator.
KD compare strategy (交易策略對照組)This is a base and easy trading strategy for comparing my other strategy.
The strategy consider K >= 80 is strong target in the last high period,
and consider K <=20 is the weak target in the last low period.
In the strong target, the strategy may increase long at the first day when K < 50, until 2/3 max order limitation or strong target become to weak.
In the weak target, the strategy may increase short at the first day when K > 50, until 2/3 max order limitation or strong target become to strong.
there are three orders for this strategy.
when the strong become to weak, it may use the remain 1/3 to save itself, and change the direction at the next k > 50
when the weak become to weak, it may use the remain 1/3 to save itself, and change the direction at the next k < 50
這是一個簡單的雙向交易策略,用來對照我其他的策略。
當 K>=80 它會認為目前是強勢股,偏多操作
當 K<=20 它會認為目前是強勢股,偏空操作
當標的為強勢股時,當第一次 K<50 會加碼多單,最多買進2/3的持股,直到轉弱
當標的為弱勢股時,當第一次 K>50 會加碼空單,最多買進2/3的持股,直到轉強
當強勢轉弱勢時,會使用剩下的1/3來拯救持股,在下次 k > 50 出清持股
當弱勢轉強勢時,會使用剩下的1/3來拯救持股,在下次 k < 50 出清持股
Strategy Tester EMA-SMA-RSI-MACDOn Tradingview I never saw a custom adjustable strategy script yet, so this is it,
you can change different things and see if you'll get a good strategy or not
Settings:
First choose the source, you can choose out of:
close, open, high, low, ohlc4, hlc3, hl2
Then choose you strategy: Long & Short, Long only or Short only
Next, choose your entry "Buy/Long" (which is the "close Short position" when "Short"):
- (E)MA 1 > (E)MA 2 (Each can be made ema or sma)
- close above (E)MA 1
- RSI strategy
- macd > signal
- macd > 0
- signal > 0
Then choose your RSI values if needed (for example you want a trigger when EMA 1 > SMA 2
but only if RSI > 60, then change "IF RSI >" from 0 to 60
Next you can choose an extra argument
and even a second argument with Higher Time Frame settings
Under this you can change your (E)MA values as desired (HTF values, MACD and RSI length can be found lower)
All the same with the exit/close (or if "Short", this is your entry)
Again, change everything as you wish
Then comes the RSI length setting, MACD settings and HTF settings, followed by SL/TP settings
(you also can enable/disable SL/TP), and TIME settings (for example you want to know the profit only from this year)
Alerts are provided in next script
Have fun!
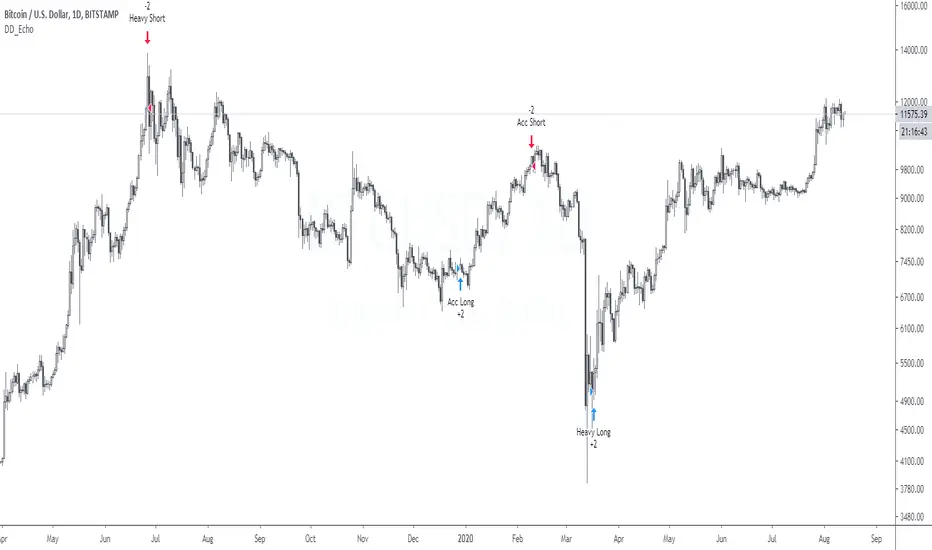
DD_EchoDD_Echo is a buy/sell trading strategy based on sentiment analysis such as fear and greed, Bitmex premium and quantity theory of money.
The performance metrics are as follows:
Net Profit: 412%
Sharpe Ratio: 1.27
Profit Ratio: 2.55
Hit Rate: 100%
If you want to access this, please DM me.
OathOath consists of 21 and 55 EMA , Commodity Channel Index and Supertrend indicator. It confirms a trend and gives you a signal on a pullback. Original creation worked on 1h EURUSD chart.
Oath is merely a rebrand of my previous Patient Trendfollower strategy. Unlike Patient Trendfollower, Oath has actually a good name and it does not fill your screen with noodles.
►Long setup:
• 21 EMA is above 55 EMA , which is above the Supertrend indicator.
• Commodity Channel Index is an oscillator, which prints into the chart if extreme levels are reached. Green is for a level above 100 or below -100, red is above 140 or below -140 and black is above 180 or below -180.
• If 21 EMA > 55EMA > Supertrend and an oversold signal appear, you can buy into the trend.
• When backtesting on 1h EURUSD , profit target 400 pips worked best with a stop-loss below Supertrend's bottom and the size of your spread. Spread values do not subtract from your profit.
• A picture shows two valid entries.
Further examples can be found in Patient Trendfollower 's description.
Thanks to:
• @everget for providing Supertrend solution.
• Satik FX who hand-tested the system by hand and reported results in this article. He is my main inspiration for creating the complete indicator as one because I want to be able to show and hide it with a single click.

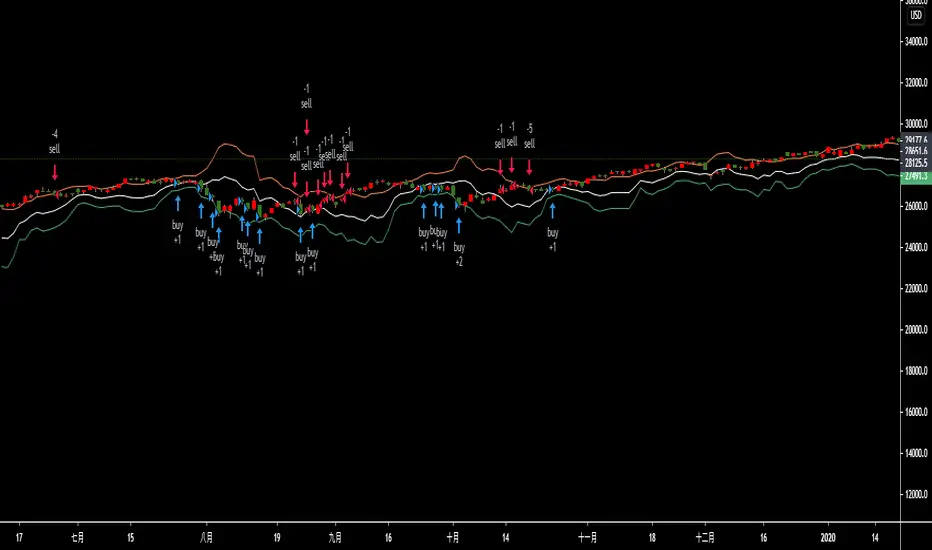
Strategy BTBTBTBT — strategy for only long positional trading of top cryptocurrencies. BTCUSD and ETHUSD are best suited for this strategy.
The main idea of the strategy is to buy cryptocurrency with a leverage of up to 1: 3 when the market is growing, and get rid of cryptocurrency when the market is not growing or falling.
The strategy is working on a daily timeframe .
To determine the trend, the strategy uses a combination of indicators MA25 and MA99.
To determine overbought (pump) and oversold (dump), the strategy uses the oscillator "SPPO".
The strategy has three trading conditions:
1) SPPO SPPOoverBought - "pump" market. Close all long positions or leave a position with a micro-leverage of 1: 0.1 for a period of 28 days.
3) Closing> MA25 > MA99 - uptrend in the market. We open the "long" position with a leverage of 1: 3.
If market conditions do not meet the above criteria, then the strategy does not have open positions.
Input parameters
Recommended timeframe D1.
FastLength - period for fast MA. Default = 25.
SlowLength - period of slow MA. Default = 99.
SPPOoverSold - trigger for determining the dump in the market. Default = -30.
SPPOoverBought - trigger to determine the pump in the market. Default = 35.
SPPOmaxForLong - the maximum value of SPPO for opening a long position. Default = 10.
LeverageLong - leverage when entering the market with a "long" signal. Default = 3.
LeveragePamp - the amount of leverage when entering the market with a "pump" signal. Default = 0.1.
LeverageDamp - the amount of leverage when entering the market with a "dump" signal. Default = 1.
Log equity chart - If true, use a logarithmic scale for a graph of equity. Default = false.

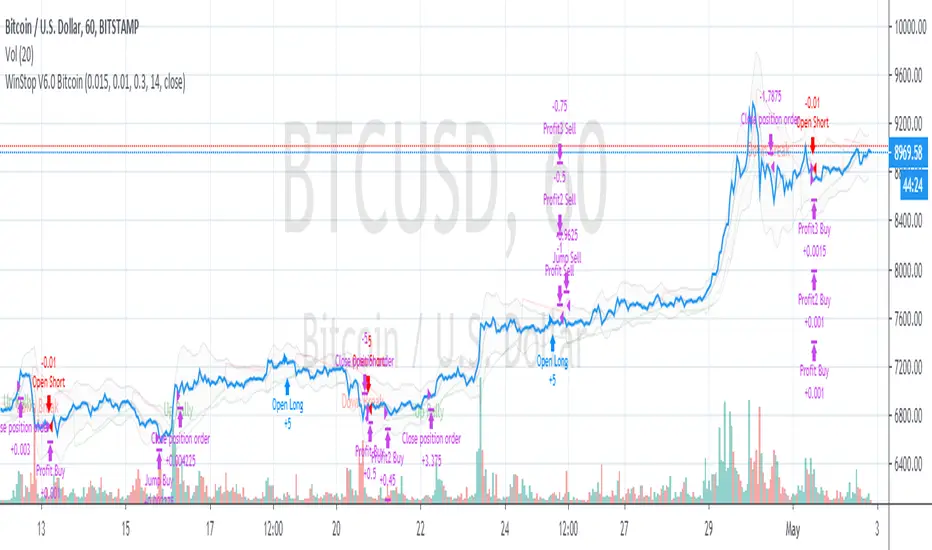
WinStop Strategy for BItcoinWinStop strategy is a high alpha low volatility trend following strategy based on Validate PSAR trends and RSI and William %R oscillators.
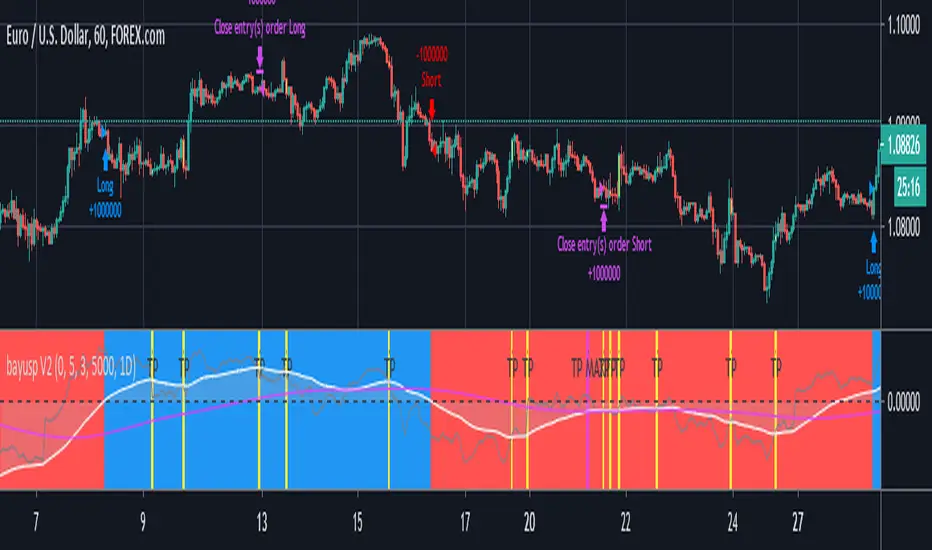
bayusp V2Using multi source like RSI , MACD , Stochastic , SMA , EMA and Huge Noural Network to Predicted Open Position.
EltrutTurtle inverted.
Long when
1. 7 period high broken
2. trendflex below 1
3. inside 35,3 bollinger band

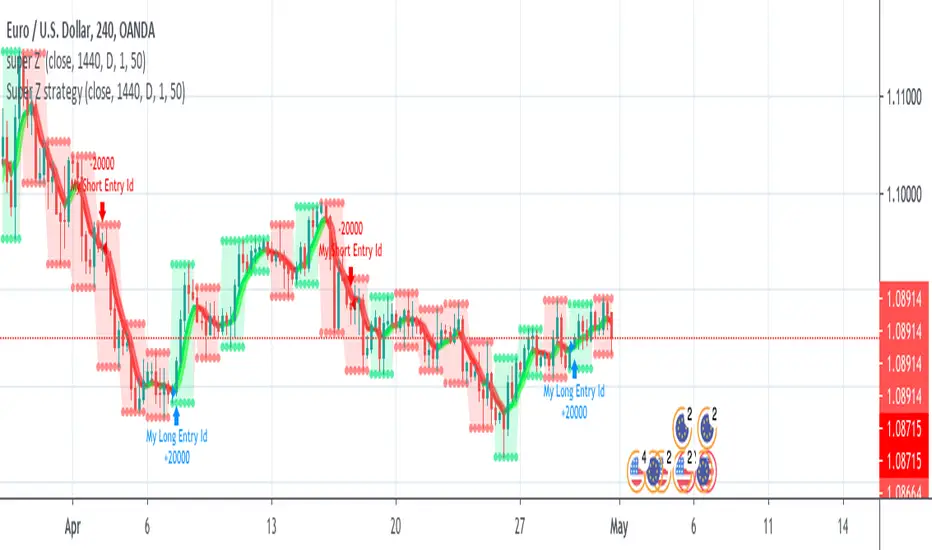
Super Z strategy - Thanks to Rafael Zioni//Original script
//https://www.tradingview.com/script/wYknDlLx-super-Z/
This is a test for verifying if this interesting study works well.
The author, thanks to him!!!, advise a possible repaint because the script uses security function.
Refer to tradingview.com for more info on repainting:
www.tradingview.com
QUOTE:
We can see repainting in the following cases:
1- Strategies using calc_on_every_tick=true. A strategy with parameter calc_on_every_tick = false may also be prone to repainting, but to a lesser degree.
(this is not the case, ndr).
2- Using security for requesting data from a resolution higher than the resolution of the chart’s main symbol (i.e. do not use ion weelky chart if you set 1440 (1Day) in inputs)
NOTE: Thanks again to Rafael Zioni. If he requires to delete this strategy, I'll do immediately.
Combo Backtest 123 Reversal & Elder Ray (Bear Power) This is combo strategies for get a cumulative signal.
First strategy
This System was created from the Book "How I Tripled My Money In The
Futures Market" by Ulf Jensen, Page 183. This is reverse type of strategies.
The strategy buys at market, if close price is higher than the previous close
during 2 days and the meaning of 9-days Stochastic Slow Oscillator is lower than 50.
The strategy sells at market, if close price is lower than the previous close price
during 2 days and the meaning of 9-days Stochastic Fast Oscillator is higher than 50.
Second strategy
Developed by Dr Alexander Elder, the Elder-ray indicator measures buying
and selling pressure in the market. The Elder-ray is often used as part
of the Triple Screen trading system but may also be used on its own.
Dr Elder uses a 13-day exponential moving average (EMA) to indicate the
market consensus of value. Bear Power measures the ability of sellers to
drive prices below the consensus of value. Bear Power reflects the ability
of sellers to drive prices below the average consensus of value.
Bull Power is calculated by subtracting the 13-day EMA from the day's High.
Bear power subtracts the 13-day EMA from the day's Low.
You can use in the xPrice any series: Open, High, Low, Close, HL2, HLC3, OHLC4 and ect...
WARNING:
- For purpose educate only
- This script to change bars colors.