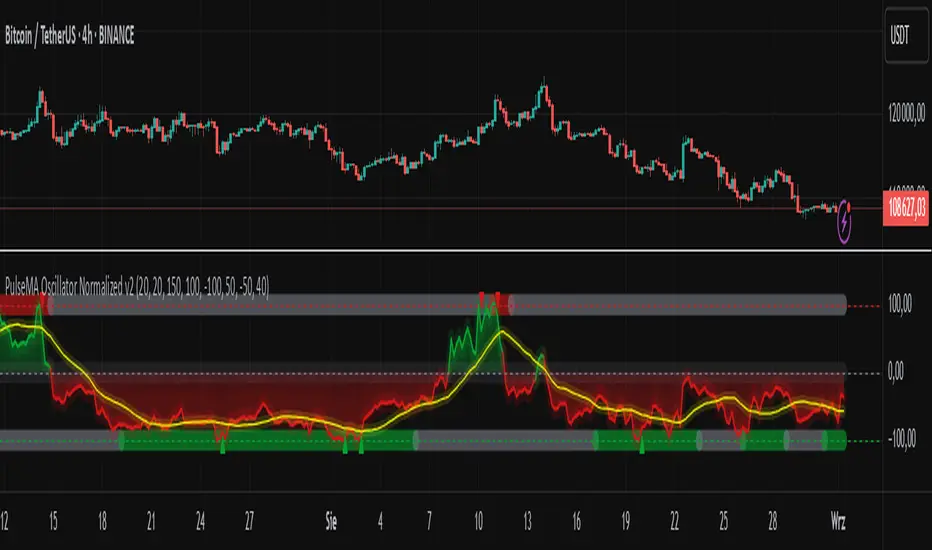
PulseMA Oscillator Normalized v2█ OVERVIEW
PulseMA Oscillator Normalized v2 is a technical indicator designed for the TradingView platform, assisting traders in identifying potential trend reversal points based on price dynamics derived from moving averages. The indicator is normalized for easier interpretation across various market conditions, and its visual presentation with gradients and signals facilitates quick decision-making.
█ CONCEPTS
The core idea of the indicator is to analyze trend dynamics by calculating an oscillator based on a moving average (EMA), which is then normalized and smoothed. It provides insights into trend strength, overbought/oversold levels, and reversal signals, enhanced by gradient visualizations.
Why use it?
Identifying reversal points: The indicator detects overbought and oversold levels, generating buy/sell signals at their crossovers.
Price dynamics analysis: Based on moving averages, it measures how long the price stays above or below the EMA, incorporating trend slope.
Visual clarity: Gradients, fills, and colored lines enable quick chart analysis.
Flexibility: Configurable parameters, such as moving average lengths or normalization period, allow adaptation to various strategies and markets.
How it works?
Trend detection: Calculates a base exponential moving average (EMA with PulseMA Length) and measures how long the price stays above or below it, multiplied by the slope for the oscillator.
Normalization: The oscillator is normalized based on the minimum and maximum values over a lookback period (default 150 bars), scaling it to a range from -100 to 100: (oscillator - min) / (max - min) * 200 - 100. This ensures values are comparable across different instruments and timeframes.
Smoothing: The main line (PulseMA) is the normalized oscillator (oscillatorNorm). The PulseMA MA line is a smoothed version of PulseMA, calculated using an SMA with the PulseMA MA length. As PulseMA MA is smoothed, it reacts more slowly and can be used as a noise filter.
Signals: Generates buy signals when crossing the oversold level upward and sell signals when crossing the overbought level downward. Signals are stronger when PulseMA MA is in the overbought or oversold zone (exceeding the respective thresholds for PulseMA MA).
Visualization: Draws lines with gradients for PulseMA and PulseMA MA, levels with gradients, gradient fill to the zero line, and signals as triangles.
Alerts: Built-in alerts for buy and sell signals.
Settings and customization
PulseMA Length: Length of the base EMA (default 20).
PulseMA MA: Length of the SMA for smoothing PulseMA MA (default 20).
Normalization Lookback Period: Normalization period (default 150, minimum 10).
Overbought/Oversold Levels: Levels for the main line (default 100/-100) and thresholds for PulseMA MA, indicating zones where PulseMA MA exceeds set values (default 50/-50).
Colors and gradients: Customize colors for lines, gradients, and levels; options to enable/disable gradients and fills.
Visualizations: Show PulseMA MA, gradients for overbought/oversold/zero levels, and fills.
█ OTHER SECTIONS
Usage examples
Trend analysis: Observe PulseMA above 0 for an uptrend or below 0 for a downtrend. Use different values for PulseMA Length and PulseMA MA to gain a clearer trend picture. PulseMA MA, being smoothed, reacts more slowly and can serve as a noise filter to confirm trend direction.
Reversal signals: Look for buy triangles when PulseMA crosses the oversold level, especially when PulseMA MA is in the oversold zone. Similarly, look for sell triangles when crossing the overbought level with PulseMA MA in the overbought zone. Such confirmation increases signal reliability.
Customization: Test different values for PulseMA Length and PulseMA MA on a given instrument and timeframe to minimize false signals and tailor the indicator to market specifics.
Notes for users
Combine with other tools, such as support/resistance levels or other oscillators, for greater accuracy.
Test different settings for PulseMA Length and PulseMA MA on the chosen instrument and timeframe to find optimal values.
M-oscillator
Commodity Channel Index DualThe CCI Dual is a custom TradingView indicator built in Pine Script v5, designed to help traders identify potential buy and sell signals using two Commodity Channel Index (CCI) oscillators. It combines a shorter-period CCI (default: 14) for quick momentum detection with a longer-period CCI (default: 50) for confirmation, focusing on mean-reversion opportunities in overbought or oversold conditions.
This setup is particularly suited for volatile markets like cryptocurrencies on higher timeframes (e.g., 3-day charts), where it highlights reversals by requiring both CCIs to cross out of extreme zones within a short window (default: 3 bars).
The indicator plots the CCIs, customizable bands (inner: 100, OB/OS: 175, outer: 200), dynamic fills for visual emphasis, background highlights for signals, and alert conditions for notifications.
How It Works
The indicator calculates two CCIs based on user-defined lengths and source (default: close price):
CCI Calculation: CCI measures price deviation from its average, using the formula: CCI = (Typical Price - Simple Moving Average) / (0.015 * Mean Deviation). The short CCI reacts faster to price changes, while the long CCI provides smoother, trend-aware confirmation.
Overbought/Oversold Levels: Customizable thresholds define extremes (Overbought at +175, Oversold at -175 by default). Bands are plotted at inner (±100), mid (±175 dashed), and outer (±200) levels, with gray fills for the outer zones.
Dynamic Fills: The longer CCI is used to shade areas beyond OB/OS levels in red (overbought) or green (oversold) for quick visual cues.
Signals:
Buy Signal: Triggers when both CCIs cross above the Oversold level (-175) within the signal window (3 bars). This suggests a potential upward reversal from an oversold state.
Sell Signal: Triggers when both cross below the Overbought level (+175) within the window, indicating a possible downward reversal.
Visuals and Alerts: Buy signals highlight the background green, sells red. Separate alertconditions allow setting TradingView alerts for buys or sells independently.
Customization: Adjust lengths, levels, and window via inputs to fit your timeframe or asset—e.g., higher OB/OS for crypto volatility.
This logic reduces noise by requiring dual confirmation, but like all oscillators, it can produce false signals in strong trends where prices stay extended.
To mitigate false signals (e.g., in trending markets), layer the CCI Dual with MACD (default: 12,26,9) and RSI (default: 14) for multi-indicator confirmation:
With MACD: Only take CCI buys if the MACD line is above the signal line (or histogram positive), confirming bullish momentum. For sells, require MACD bearish crossover. This filters counter-trend signals by aligning with trend strength—e.g., ignore CCI sells if MACD shows upward momentum.
With RSI: Confirm CCI oversold buys only if RSI is below 30 and rising (or shows bullish divergence). For overbought sells, RSI above 70 and falling. This adds overextension validation, reducing whipsaws in crypto trends.
I made this customizable for you to find what works best for your asset you are trading. I trade the 6 hour and 3 day timeframe mainly on major cryptocurrency pairs. I hope you enjoy this script and it serves you well.

ZLEMA Trend Index 2.0ZTI — ZLEMA Trend Index 2.0 (0–1000)
Overview
Price Mapped ZTI v2.0 - Enhanced Zero-Lag Trend Index.
This indicator is a significant upgrade to the original ZTI v1.0, featuring enhanced resolution from 0-100 to 0-1000 levels for dramatically improved price action accuracy. The Price Mapped ZTI uses direct price-to-level mapping to eliminate statistical noise and provide true proportional representation of market movements.
Key Innovation: Instead of statistical normalization, this version maps current price position within a user-defined lookback period directly to the ZTI scale, ensuring perfect correlation with actual price movements. I believe this is the best way to capture trends instead of directly on the charts using a plethora of indicators which introduces bad signals resulting in drawdowns. The RSI-like ZTI overbought and oversold lines filter valid trends by slicing through the current trading zone. Unlike RSI that can introduce false signals, the ZTI levels 1 to 1000 is faithfully mapped to the lowest to highest price in the current trading zone (lookback period in days) which can be changed in the settings. The ZTI line will never go off the beyond the ZTI levels in case of extreme trend continuation as the trading zone is constantly updated to reflect only the most recent bars based on lookback days.
Core Features
✅ 10x Higher Resolution - 0-1000 scale provides granular movement detection
✅ Adjustable Trading Zone - Customizable lookback period from 1-50 days
✅ Price-Proportional Mapping - Direct correlation between price position and ZTI level
✅ Zero Statistical Lag - No rolling averages or standard deviation calculations
✅ Multi-Strategy Adaptability - Single parameter adjustment for different trading styles
Trading Zone Optimization
📊 Lookback Period Strategies
Short-term (1-3 days):
Ultra-responsive to recent price action
Perfect for scalping and day trading
Tight range produces more sensitive signals
Medium-term (7-14 days):
Balanced view of recent trading range
Ideal for swing trading
Captures meaningful support/resistance levels
Long-term (21-30 days):
Broader market context
Excellent for position trading
Smooths out short-term market noise
⚡ Market Condition Adaptation
Volatile Markets: Use shorter lookback (3-5 days) for tighter ranges
Trending Markets: Use longer lookback (14-21 days) for broader context
Ranging Markets: Use medium lookback (7-10 days) for clear boundaries
🎯 Timeframe Optimization
1-minute charts: 1-2 day lookback
5-minute charts: 2-5 day lookback
Hourly charts: 7-14 day lookback
Daily charts: 21-50 day lookback
Trading Applications
Scalping Setup (2-day lookback):
Super tight range for quick reversals
ZTI 800+ = immediate short opportunity
ZTI 200- = immediate long opportunity
Swing Trading Setup (10-day lookback):
Meaningful swing levels captured
ZTI extremes = high-probability reversal zones
More stable signals, reduced whipsaws
Advanced Usage
🔧 Real-Time Adaptability
Trending days: Increase to 14+ days for broader perspective
Range-bound days: Decrease to 3 days for tighter signals
High volatility: Shorter lookback for responsiveness
Low volatility: Longer lookback to avoid false signals
💡 Multi-Timeframe Approach
Entry signals: Use 7-day ZTI on main timeframe
Trend confirmation: Use 21-day ZTI on higher timeframe
Exit timing: Use 3-day ZTI for precise exits
🌐 Session Optimization
Asian session: Shorter lookback (3-5 days) for range-bound conditions
London/NY session: Longer lookback (7-14 days) for trending conditions
How It Works
The indicator maps the current price position within the specified lookback period directly to a 0-1000 scale and plots it using ZLEMA (Zero Lag Exponential Moving Average) which has the least lag of the available popular moving averages:
Price at recent high = ZTI at 1000
Price at recent low = ZTI at 1
Price at mid-range = ZTI at 500
This creates perfect proportional representation where every price movement translates directly to corresponding ZTI movement, eliminating the false signals common in traditional oscillators.
This single, versatile indicator adapts to any market condition, timeframe, or trading style through one simple parameter adjustment, making it an essential tool for traders at every level.
Credits
ZLEMA techniques widely attributed to John Ehlers.
Disclaimer
This tool is for educational purposes only and is not financial advice. Backtest and forward‑test before live use, and always manage risk.
Please note that I set this as closed source to prevent source code cloning by others, repackaging and republishing which results in multiple confusing choices of the same indicator.

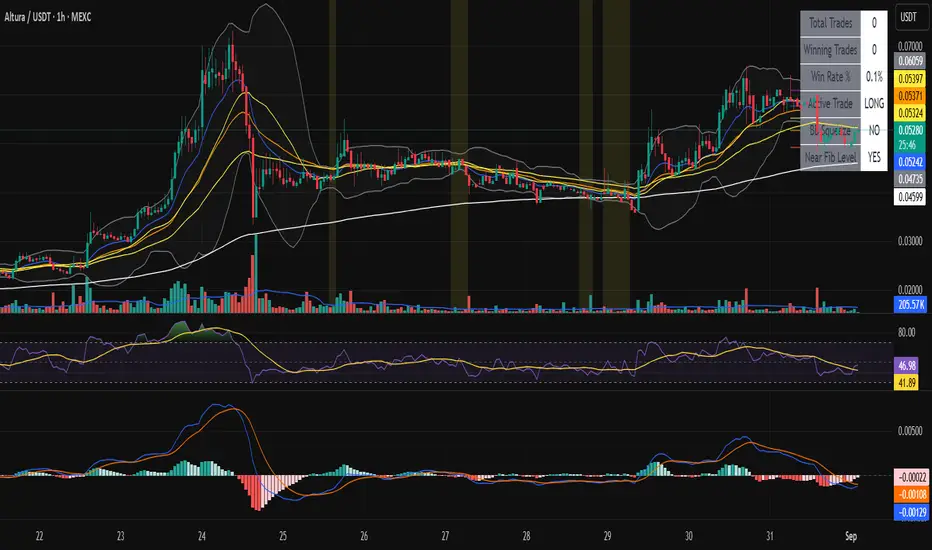
B@dshah Indicator🚀 Advanced Multi-Indicator Trading System
A comprehensive trading indicator that combines multiple technical analysis tools for high-probability signal generation:
📊 CORE FEATURES:
- EMA Trend Analysis (Fast/Slow crossovers)
- RSI Momentum Detection
- MACD Signal Confirmation
- Bollinger Bands (Squeeze & Mean Reversion)
- Fibonacci Retracement Levels
- Volume & ATR Filtering
- Multi-Confluence Scoring System (0-10 scale)
🎯 SIGNAL QUALITY:
- Non-repainting signals (confirmed at bar close)
- Minimum 60% strength threshold for trades
- Dynamic TP/SL based on market structure
- Real-time win rate tracking
- Signal strength percentage display
⚙️ UNIQUE FEATURES:
- BB Squeeze detection for volatility breakouts
- Fibonacci level confluence analysis
- Smart position sizing recommendations
- Visual TP/SL lines with outcome tracking
- Comprehensive statistics table
🔔 ALERTS INCLUDED:
- Buy/Sell signals with strength ratings
- TP/SL hit notifications
- BB squeeze/expansion alerts
- Fibonacci level touches
Best used on 1H+ timeframes for optimal results.
Perfect for swing trading and position entries.
Quad Stochastic OscillatorThis is my take on the "Quad Rotation Strategy". It's a simple but powerful indicator once you know what to look for. I combined the four different periods into one script, which makes seeing the rotation, and other cues, easier. I suggest changing the %K line to dotted or off, so it doesn't clutter the view.

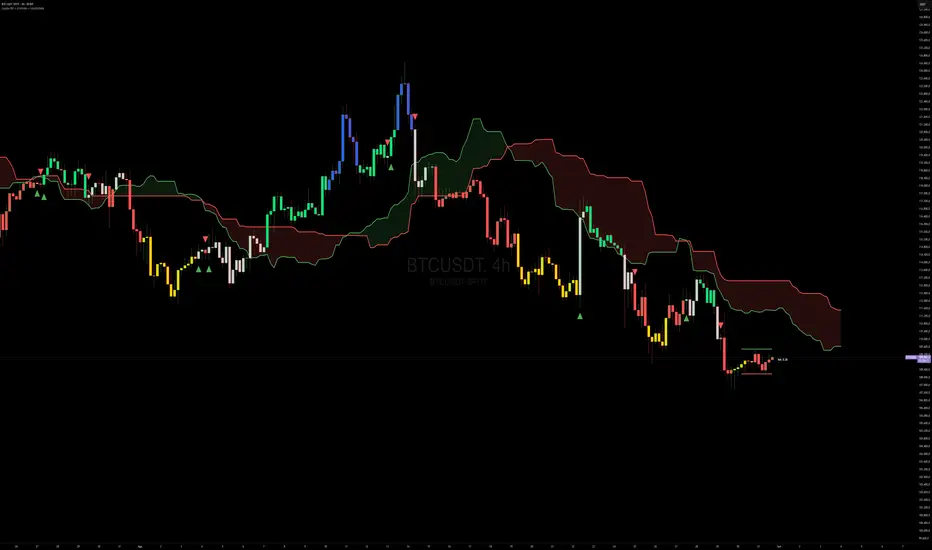
Capiba RSI + Ichimoku + VolatilidadeThe "Capiba RSI + Ichimoku + Volatility" indicator is a powerful, all-in-one technical analysis tool designed to provide traders with a comprehensive view of market dynamics directly on their price chart. This multi-layered indicator combines a custom Relative Strength Index (RSI), the trend-following Custom Ichimoku Cloud, and dynamic volatility lines to help identify high-probability trading setups.
How It Works
This indicator functions by overlaying three distinct, yet complementary, analysis systems onto a single chart, offering a clear and actionable perspective on a wide range of market conditions, from strong trends to periods of consolidation.
1. Custom RSI & Momentum Signals
The core of this indicator is a refined version of the Relative Strength Index (RSI). It calculates a custom Ultimate RSI that is more sensitive to price movements, offering a quicker response to potential shifts in momentum. The indicator also plots a moving average of this RSI, allowing for the generation of clear trading signals. Use RMAs.
Bar Coloring: The color of the price bars on your chart dynamically changes to reflect the underlying RSI momentum.
Blue bars indicate overbought conditions, suggesting trend and a potential short-term reversal.
Yellow bars indicate oversold conditions, hinting at a potential bounce.
Green bars signal bullish momentum, where the Custom RSI is above both 50 and its own moving average.
Red bars indicate bearish momentum, as the Custom RSI is below both 50 and its moving average.
Trading Signals: The indicator plots visual signals directly on the chart in the form of triangles to highlight key entry and exit points. A green triangle appears when the Custom RSI crosses above its moving average (a buy signal), while a red triangle marks a bearish crossunder (a sell signal).
2. Custom Ichimoku Cloud for Trend Confirmation
This component plots a standard Ichimoku Cloud directly on the chart, providing a forward-looking view of trend direction, momentum, and dynamic support and resistance levels.
The cloud’s color serves as a strong visual cue for the prevailing trend: a green cloud indicates a bullish trend, while a red cloud signals a bearish trend.
The cloud itself acts as a dynamic support or resistance zone. For example, in an uptrend, prices are expected to hold above the cloud, which provides a strong support level for the market.
3. Dynamic Volatility Lines
This final layer is a dynamic volatility channel that automatically plots the highest high and lowest low from a user-defined period. These lines create a visual representation of the recent price range, helping traders understand the current market volatility.
Volatility Ratio: A label is displayed on the chart showing a volatility ratio, which compares the current price range to a historical average. A high ratio indicates increasing volatility, while a low ratio suggests a period of price consolidation or lateral movement, a valuable insight for day traders.
The indicator is highly customizable, allowing you to adjust parameters like RSI length, overbought/oversold levels, Ichimoku periods, and volatility lookback periods to suit your personal trading strategy. It is an ideal tool for traders who rely on a combination of momentum, trend, and volatility to make well-informed decisions.
AlphaFlow — Direcional ProThe AlphaFlow — Direcional Pro is a complete trading suite designed to give traders a clear, structured view of market direction, volatility, and momentum.
📌 Key Features:
Trend Detection with Dual EMAs: Fast and slow EMAs for directional bias, plus an optional 200 EMA filter for long-term context.
Volatility Regime Filter (ATR): Confirms market conditions by comparing current ATR with its average.
RSI Confirmation: Adaptive RSI filter to validate bullish and bearish regimes.
Directional Signals (BUY/SELL): Clear chart markers with bar coloring for instant trend visualization.
Swing Structure with Star Markers: Automatic detection of HH, HL, LH, LL swings, highlighted with color-coded ★ stars.
RSI Divergences: Automatic bullish/bearish divergence spotting for early trend reversal signals.
VWAP Levels: Daily, Weekly, and Anchored VWAP for institutional reference points.
Trade Management Tools: Automatic plotting of Entry, Stop-Loss, TP1, and TP2 levels, with optional trailing ATR stop.
Multi-Timeframe Support: Generate signals from a higher timeframe and confirm on chart close.
Alerts: Pre-configured alerts for entries, SL, TP1, TP2, and divergences.
✨ With its combination of trend, volatility, swing structure, and divergence analysis, AlphaFlow provides both short-term signals and long-term directional context — making it a versatile tool for intraday traders, swing traders, and investors.

CandelaCharts - Vertex Oscillator 📝 Overview
The Vertex Oscillator is a proprietary momentum-based oscillator designed to detect periods of deep undervaluation (accumulation) and excessive euphoria (distribution) in markets.
By combining price deviation, volume normalization, and volatility scaling, the indicator identifies extreme conditions and provides actionable signals for both traders and analysts.
📦 Features
Volume-normalized momentum – integrates price deviations with relative volume weighting.
Adaptive volatility scaling – reduces distortion from sudden spikes and low-volume noise.
Z-score normalization – standardizes readings into intuitive zones.
Accumulation & Euphoria detection – highlights market extremes with color-coded zones.
Built-in alerts – instantly notify traders when critical thresholds are crossed.
⚙️ Settings
Source: The input price source.
Lookback: Number of bars used for deviation & volatility calculation.
Smoothing: Smoothing length applied to oscillator.
Colors: Customize bullish, bearish, and neutral oscillator line colors.
Zones: Set shading colors for accumulation (≤ -2) and euphoria (≥ +2).
Line: Choose oscillator line width and color.
⚡️ Showcase
≤ -2 (Green Zone)
Market undervaluation / accumulation opportunities.
≥ +2 (Red Zone)
Market euphoria / overheated conditions.
0 (Neutral Line)
Balanced state.
Divergences
📒 Usage
The Vertex Oscillator is most effective when interpreted through its key zones, helping traders quickly spot undervaluation, euphoria, or neutral market conditions.
Identify Accumulation – When the oscillator drops below -2, markets may be undervalued.
Spot Euphoria – When the oscillator rises above +2, markets may be overheated.
Neutral Zone – Around 0, conditions are balanced with no strong bias.
Best Practice – Use alongside trend, support/resistance, or volume tools to confirm signals.
🚨 Alerts
The Vertex Oscillator includes built-in alerts to help traders react instantly when the market enters extreme conditions. Instead of constantly monitoring the chart, alerts notify you in real time when accumulation or euphoria thresholds are triggered.
Deep Accumulation – triggers when the oscillator crosses below -2, signaling undervaluation.
Euphoria Triggered – triggers when the oscillator crosses above +2, signaling overheated conditions.
⚠️ Disclaimer
These tools are exclusively available on the TradingView platform.
Our charting tools are intended solely for informational and educational purposes and should not be regarded as financial, investment, or trading advice. They are not designed to predict market movements or offer specific recommendations. Users should be aware that past performance is not indicative of future results and should not rely on these tools for financial decisions. By using these charting tools, the purchaser agrees that the seller and creator hold no responsibility for any decisions made based on information provided by the tools. The purchaser assumes full responsibility and liability for any actions taken and their consequences, including potential financial losses or investment outcomes that may result from the use of these products.
By purchasing, the customer acknowledges and accepts that neither the seller nor the creator is liable for any undesired outcomes stemming from the development, sale, or use of these products. Additionally, the purchaser agrees to indemnify the seller from any liability. If invited through the Friends and Family Program, the purchaser understands that any provided discount code applies only to the initial purchase of Candela's subscription. The purchaser is responsible for canceling or requesting cancellation of their subscription if they choose not to continue at the full retail price. In the event the purchaser no longer wishes to use the products, they must unsubscribe from the membership service, if applicable.
We do not offer reimbursements, refunds, or chargebacks. Once these Terms are accepted at the time of purchase, no reimbursements, refunds, or chargebacks will be issued under any circumstances.
By continuing to use these charting tools, the user confirms their understanding and acceptance of these Terms as outlined in this disclaimer.

AnalistAnka FlowScore Pro (v8.2)AnalistAnka FlowScore Pro – User Guide (EN)
1) What it is
AnalistAnka FlowScore Pro aggregates money flow into a single scale.
Components:
SMF-Z: Z-score of (log return × volume)
OBV-Z: Z-score of OBV (cumulative volume flow)
MFI-Z (optional): Z-score of Money Flow Index
Combined into FlowScore, then smoothed by EMA.
Core signal:
FlowScore > +0.5 → strong long bias
FlowScore < −0.5 → strong short bias
Optional HTF EMA filter keeps you trading with the higher-timeframe trend.
2) Inputs (summary)
FlowScore & Signal: wSMF, wOBV, wMFI, smoothFS, enterBand, exitBand, cooldownBars
HTF Filter: useHTF, htf (e.g., 60/240/1D), htfEmaLen (default 200)
MFI: useMfi, mfiLen, mfiSmooth, mfiZwin
Spike: spWin, spK (σ threshold), minVolPct (volume MA threshold)
Fills: fillSMF, fillOBV with separate positive/negative colors
Divergences: showDiv, divLeft/right, divShowLines, divShowLabels, colors
3) How to read
A) FlowScore (primary)
Long setup: FlowScore crosses above enterBand (+)
Short setup: FlowScore crosses below −exitBand
Hysteresis (±bands) reduces whipsaws; cooldown throttles repeats.
B) HTF trend filter (recommended)
With useHTF=true: only longs above HTF EMA, only shorts below it.
Example: trade 15-min, filter with 1-hour EMA200.
C) Spike IN/OUT (confirmation)
Detects statistical surges in OBV derivative plus volume threshold.
Use as confirmation, not as a standalone trigger.
D) Divergence (pivot-based)
Bearish: price HH while FlowScore prints LH
Bullish: price LL while FlowScore prints HL
Tune pivots via divLeft/right; toggle lines/labels in the panel.
4) Timeframes & suggested presets
Profile Chart HTF (Filter) Band (±) Cooldown Notes
Scalp 1–5m 15–60m 0.7 5–8 Fewer, cleaner signals
Intraday 5–15m 60–240m 0.5 8–12 Solid default
Swing 1–4h 1D 0.4 12–20 Patient entries
Daily usage:
On a daily chart, nothing extra is needed.
On intraday but want daily filter → set htf=1D.
5) Example playbook
Long:
useHTF=true and price above HTF EMA
FlowScore crosses above +band
Optional confirmations: recent Spike IN, SMF-Z & OBV-Z aligned positive
Stop: below last swing low or ATR(14)×1.5
Exit: partial on FlowScore below 0; full on below −band or at 1R/2R
Short: mirror logic (below HTF EMA, break under −band, Spike OUT, etc.).
6) Alerts
FlowScore LONG / SHORT → immediate signal notification
Spike IN / OUT → money-in/out warnings
7) Tips
Too many signals → widen bands (0.6–0.7), increase cooldown, raise smoothFS (6–9).
Too slow → lower smoothFS (3–4), reduce bands to 0.4–0.5.
Thin liquidity → reduce minVolPct, also reduce position size.
Best reliability when SMF-Z & OBV-Z share the same polarity.
8) Disclaimer
For educational purposes only. Not financial advice. Always apply risk management.

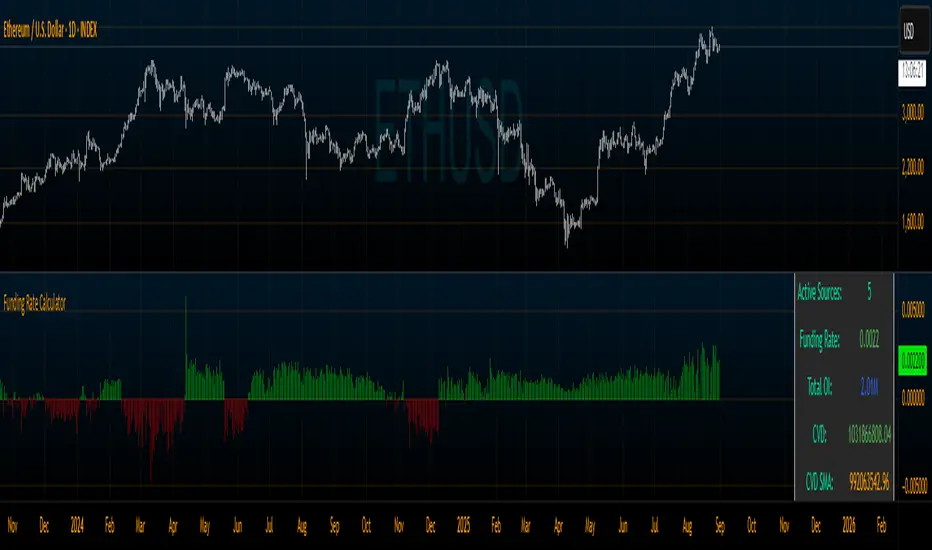
Derivative Dynamics Indicator [MarktQuant]The Derivative Dynamics Indicator is a versatile technical indicator that combines several critical metrics used in cryptocurrency and derivatives trading. It helps traders understand the relationship between spot prices, perpetual contract prices, trading volume pressure, and open interest across multiple exchanges. This indicator provides real-time visualizations of:
Funding Rate : The cost traders pay or receive to hold perpetual contracts, indicating market sentiment.
Open Interest (OI) : The total value of outstanding derivative contracts, showing market activity.
Cumulative Volume Delta (CVD) : A measure of buying vs. selling pressure over time.
Additional Data: Includes customizable options for volume analysis, smoothing, and reset mechanisms.
Key Features & How It Works
1. Metric Selection
You can choose which main metric to display:
Funding Rate: Shows the current funding fee, reflecting market sentiment (positive or negative).
CVD: Tracks buying vs. selling pressure, helping identify trend strength.
Open Interest: Displays total outstanding contracts, indicating market activity levels.
2. Volume Data Validation
The script checks if the selected chart includes volume data, which is essential for accurate calculations, especially for CVD. If volume data is missing or zero for multiple bars, it warns you to verify your chart setup.
3. CVD Calculation Methods
You can select how the CVD (Cumulative Volume Delta) is calculated:
Basic: Uses candle open and close to estimate whether buying or selling pressure dominates.
Advanced: Uses a money flow multiplier considering price position within high-low range, generally more accurate.
Tick Estimation: Uses percentage price change to estimate pressure.
You can also choose to display a smoothed version of CVD via a Simple Moving Average (SMA) to better visualize overall trends.
4. CVD Reset Option
To prevent the CVD value from becoming too large over long periods, you can set the indicator to reset periodically after a specified number of bars.
5. CVD Scaling
Adjust the scale of CVD values for better visibility:
Auto: Automatically adjusts based on magnitude.
Raw: Shows raw numbers.
Thousands/Millions: Divides the CVD values for easier reading.
Funding Rate Calculation
The indicator fetches data from multiple popular exchanges (e.g., Binance, Bybit, OKX, MEXC, Bitget, BitMEX). You can select which exchanges to include.
It calculates the funding rate by taking the mean of spot and perpetual prices across selected exchanges.
Open interest is fetched similarly and scaled according to user preferences (auto, millions, billions). It indicates the total amount of open contracts, providing insight into market activity intensity.
Visualizations & Data Presentation
Funding Rate: Shown as colored columns—green for positive (bullish sentiment), red for negative (bearish sentiment).
Open Interest: Displayed as a line, showing overall market activity.
CVD & SMA: Plotted as lines to visualize buying/selling pressure and its smoothed trend.
Information Table: Located at the top right, summarizes:
Current base currency
Number of active sources (exchanges)
Calculated funding rate
Total open interest
Current CVD and its SMA
Last delta (buy vs. sell pressure)
How to Use It
Select Metrics & Exchanges: Choose which data you want to see and from which exchanges.
Adjust Settings: Tweak CVD calculation method, SMA length, reset interval, and scaling options.
Interpret Visuals:
A positive funding rate suggests traders are paying long positions, often indicating bullish sentiment.
Negative funding rates can indicate bearish market sentiment.
Rising CVD indicates increasing buying pressure.
Open interest spikes typically mean increased market participation.
Important Notes
The indicator relies on the availability of volume data for accurate CVD calculation.
Always verify that the exchanges and symbols are correctly set and supported on your chart.
Use the combined insights from funding rates, CVD, and open interest for a comprehensive market view. This tool is designed for research purposes only.
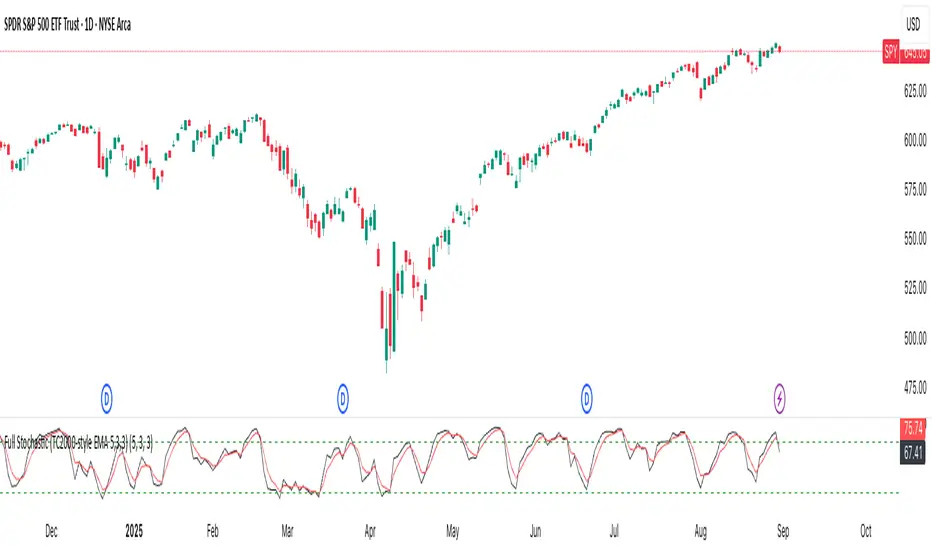
Full Stochastic (TC2000-style EMA 5,3,3)Full Stochastic (TC2000-style EMA 5,3,3) computes a Full Stochastic oscillator matching TC2000’s settings with Average Type = Exponential.
Raw %K is calculated over K=5, then smoothed by an EMA with Slowing=3 to form the Full %K, and %D is an EMA of Full %K with D=3.
Plots:
%K in black, %D in red, with 80/20 overbought/oversold levels in green.
This setup emphasizes momentum shifts while applying EMA smoothing at both stages to reduce noise and maintain responsiveness. Inputs are adjustable to suit different symbols and timeframes.
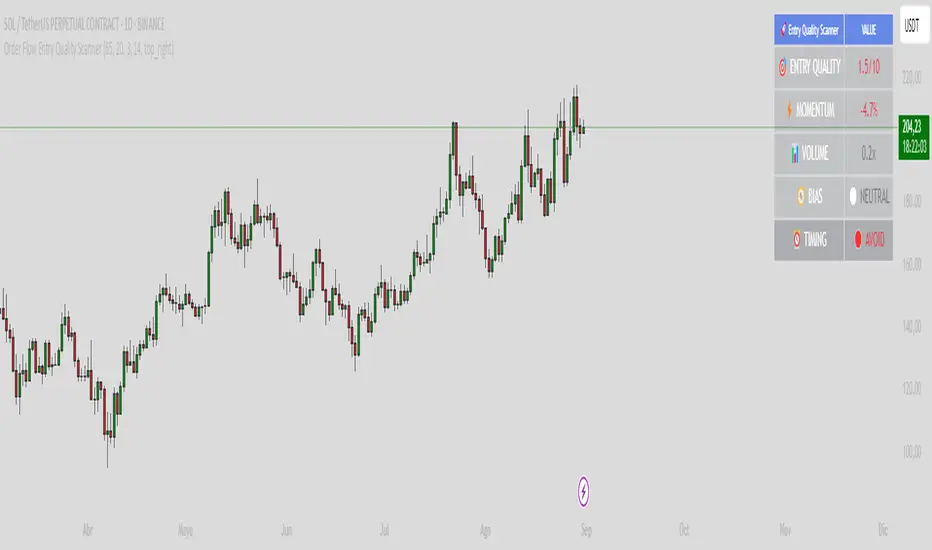
Order Flow Entry Quality ScannerOrder Flow Entry Quality Scanner
The order flow entry quality scanner is an educational technical analysis indicator designed to help traders evaluate the quality of potential entry points based on multiple technical factors. This indicator combines momentum, volume, delta analysis, and trend evaluation to provide an objective scoring system for market conditions.
Key Features
Comprehensive scoring system (0-10)
- momentum analysis: Evaluates price acceleration over recent bars
- volume delta: Measures buying vs selling pressure
- volume analysis: Compares current volume with historical averages
- vwap position: Determines price position relative to vwap
Advanced filters
- rsi filter: Optional to avoid overbought/oversold conditions
- value area filter: Helps identify fair price zones
- confluence analysis: Detects when multiple factors align
Clear visualization
- information table: Shows key metrics in real-time
- color coding: Intuitive system (green=favorable, yellow=caution, red=avoid)
- timing signals: Indicates when to consider, wait, or avoid entries
Configurable Parameters
Main configuration
- signal sensitivity (0-100): Adjusts overall scanner sensitivity
- volume periods(5-50): Defines period for volume analysis
- momentum bar (2-10): Number of bars for momentum calculation
Advanced filters
- rsi filter: Enable/disable rsi filtering
- rsi period (5-30): rsi period configuration
- value area filter: Enable value area analysis
Visual options
- show table: Enable/disable information table
- table position: Select chart location
Technical Calculations
Delta analysis
Calculates the difference between bullish and bearish volume based on tick direction to estimate buying/selling pressure.
Momentum acceleration
Measures the rate of price change over a specific period to identify acceleration or deceleration in movement.
Relative volume
Compares current volume with moving average to identify unusual activity.
Price efficiency
Evaluates how efficiently price moves within the bar's range.
Alert System
The indicator includes alerts for:
- High-quality bullish entries
- High-quality bearish entries
- Bullish factor confluence
- Bearish factor confluence
Recommended Usage
This indicator is an educational tool for technical analysis. It does not constitute financial advice nor guarantees results. Users should:
- Use it as part of a broader trading strategy
- Combine with other analysis methods
- Practice proper risk management
- Perform backtesting before live use
- Consider market conditions and fundamental news
Disclaimer
- educational purposes only: This indicator is designed for technical analysis learning
- no guarantees: Past results do not guarantee future performance
- risk warning: Trading involves risk of capital loss
- own decision: Trading decisions are solely the user's responsibility
- complementary analysis: Should be used alongside other analysis methods
- Works on all timeframes
- Compatible with all financial instruments
Always remember to do your own research and consult with financial professionals before making investment decisions.
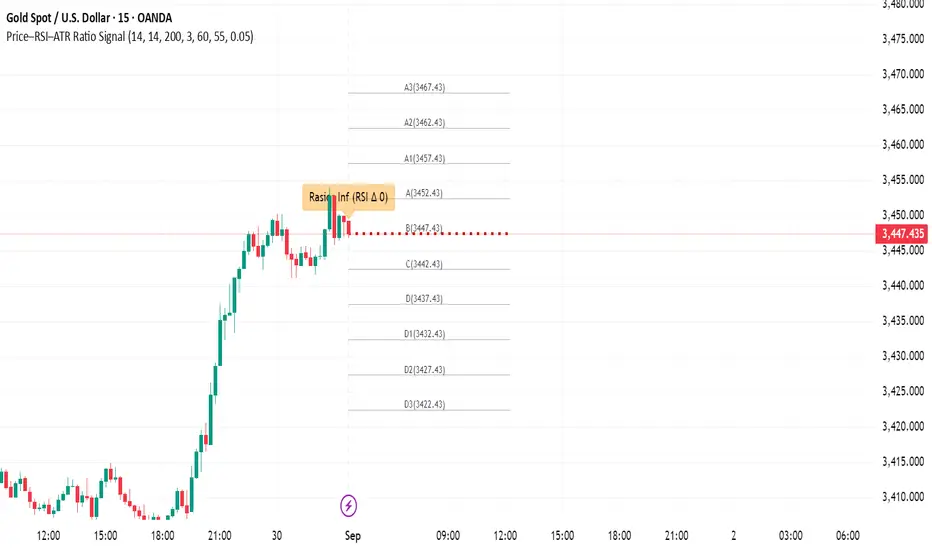
MO and Stoch GOLD H4 V.s.1 – Kim Trading MO and Stoch GOLD H4 V.s.1 – Kim Trading
Market: XAUUSD • Timeframe: H4 (4h)
Signal tiers.
B/S (basic), B1★/S1★ (MO + Stoch RSI), B2★/S2★ (with-trend filter), B3★/S3★ (plus divergence).
Trade only when one of the four labels appears. Consider DCA with the prevailing trend and add other confluences (levels, candles, volume, timing) for optimal setups.
Notes. Use Alerts → Once Per Bar Close. Educational tool, not financial advice. Source code Protected.
Author: Kim Trading • Version: V1 • Date: 2025-08-25
#XAUUSD #Gold #H4 #MO #Stoch #KimTrading

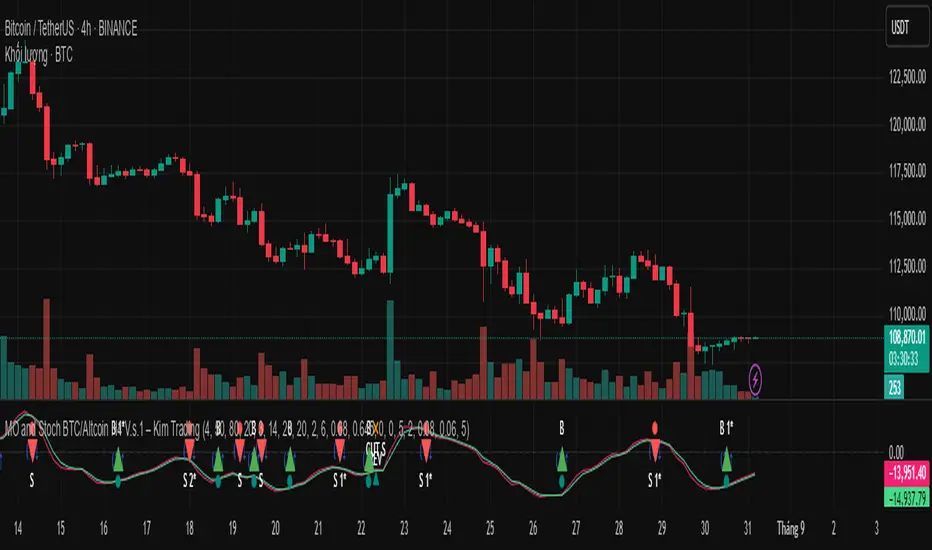
MO and Stoch BTC/Altcoin H4 V.s.1 – Kim TradingMO and Stoch BTC/Altcoin H4 V.s.1 – Kim Trading
Market: BTCUSD + major USDT altcoins (e.g., ETH, SOL, …) • Timeframe: H4 (4h)
Signal tiers.
B/S (basic), B1★/S1★ (MO + Stoch RSI), B2★/S2★ (with-trend filter), B3★/S3★ (plus divergence).
Trade only when one of the four labels appears. Consider DCA with the prevailing trend and add other confluences (levels, candles, volume, timing) for optimal setups.
Notes. Use Alerts → Once Per Bar Close. Educational tool, not financial advice. Source code Protected.
Author: Kim Trading • Version: V1 • Date: 2025-08-25
#BTC #Bitcoin #Altcoins #Crypto #H4 #MO #Stoch #KimTrading
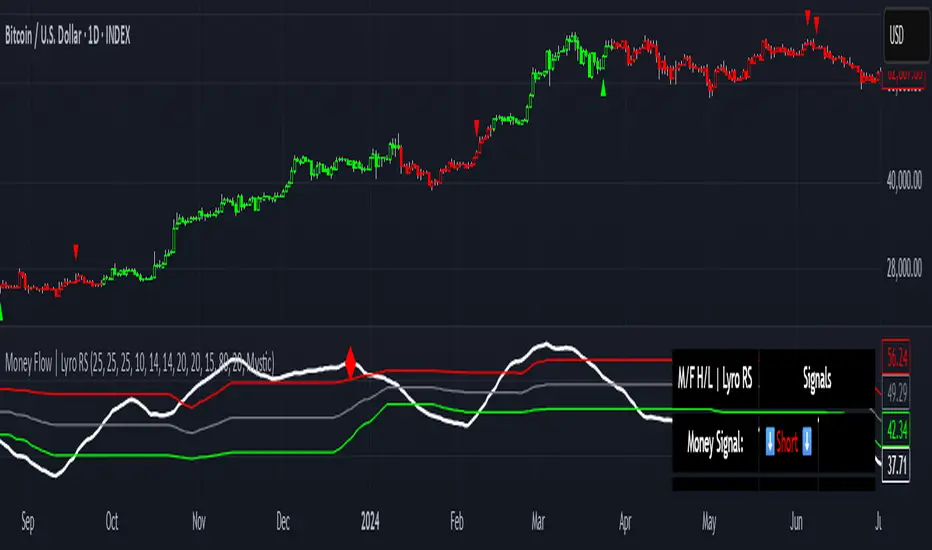
Money Flow | Lyro RSMoney Flow | Lyro RS
The Money Flow is a momentum and volume-driven oscillator designed to highlight market strength, exhaustion, and potential reversal points. By combining smoothed Money Flow Index readings with volatility, momentum, and RVI-based logic, it offers traders a deeper perspective on money inflow/outflow, divergences, and overbought/oversold dynamics.
Key Features
Smoothed Money Flow Line
EMA-smoothed calculation of the MFI for noise reduction.
Clear thresholds for overbought and oversold zones.
Normalized Histogram
Histogram plots show bullish/bearish money flow pressure.
Color-coded cross logic for quick trend assessment.
Relative Volatility Index (RVI) Signals
Detects overbought and oversold conditions using volatility-adjusted RVI.
Plots ▲ and ▼ markers at exhaustion points.
Momentum Strength Gauge
Calculates normalized momentum strength from ROC and volume activity.
Displays percentage scale of current momentum force.
Divergence Detection
Bullish divergence: Price makes lower lows while money flow makes higher lows.
Bearish divergence: Price makes higher highs while money flow makes lower highs.
Plotted as diamond markers on the oscillator.
Signal Dashboard (Table Overlay)
Displays real-time status of Money Flow signals, volatility, and momentum.
Color-coded readouts for instant clarity (Long/Short/Neutral + Momentum Bias).
How It Works
Money Flow Calculation – Applies EMA smoothing to MFI values.
Normalization – Scales oscillator between relative high/low values.
Trend & Signals – Generates bullish/bearish signals based on midline and histogram cross logic.
RVI Integration – Confirms momentum exhaustion with overbought/oversold markers.
Divergences – Identifies hidden market imbalances between price and money flow.
Practical Use
Trend Confirmation – Use midline crossovers with histogram direction for money flow bias.
Overbought/Oversold Reversals – Watch RVI ▲/▼ markers for exhaustion setups.
Momentum Tracking – Monitor momentum percentage to gauge strength of current trend.
Divergence Alerts – Spot early reversal opportunities when money flow diverges from price action.
Customization
Adjust length, smoothing, and thresholds for different markets.
Enable/disable divergence detection as needed.
Personalize visuals and dashboard display for cleaner charts.
⚠️ Disclaimer
This indicator is a tool for technical analysis and does not provide guaranteed results. It should be used alongside other methods and proper risk management. The creator is not responsible for financial decisions made using this script.
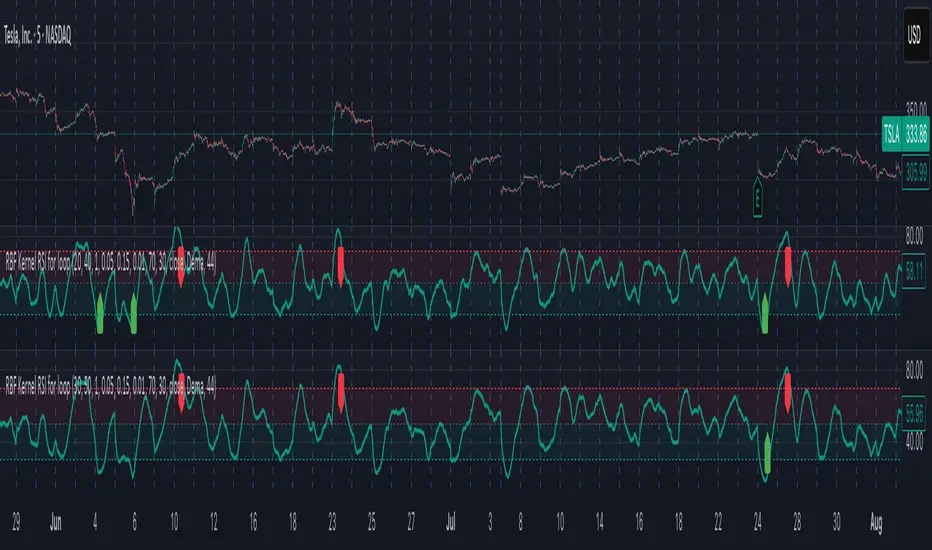
Radial Basis Kernel RSI for LoopRadial Basis Kernel RSI for Loop
What it is
An RSI-style oscillator that uses a radial basis function (RBF) kernel to compute a similarity-weighted average of gains and losses across many lookback lengths and kernel widths (γ). By averaging dozens of RSI estimates—each built with different parameters—it aims to deliver a smoother, more robust momentum signal that adapts to changing market conditions.
How it works
The script measures up/down price changes from your chosen Source (default: close).
For each combination of RSI length and Gamma (γ) in your ranges, it builds an RSI where recent bars that look most similar (by price behavior) get more weight via an RBF kernel.
It averages all those RSIs into a single value, then smooths it with your selected Moving Average type (SMA, EMA, WMA, HMA, DEMA) and a light regression-based filter for stability.
Inputs you can tune
Min/Max RSI Kernel Length & Step: Range of RSI lookbacks to include in the ensemble (e.g., 20→40 by 1) or (e.g., 30→50 by 1).
Min/Max Gamma & Step: Controls the RBF “width.” Lower γ = broader similarity (smoother); higher γ = more selective (snappier).
Source: Price series to analyze.
Overbought / Oversold levels: Defaults 70 / 30, with a midline at 50. Shaded regions help visualize extremes.
MA Type & Period (Confluence): Final smoothing on the averaged RSI line (e.g., DEMA(44) by default).
Red “OB” labels when the line crosses down from extreme highs (~80) → potential overbought fade/exit areas.
Green “OS” labels when the line crosses up from extreme lows (~20) → potential oversold bounce/entry areas.
How to use it
Treat it like RSI, but expect fewer whipsaws thanks to the ensemble and kernel weighting.
Common approaches:
Look for crosses back inside the bands (e.g., down from >70 or up from <30).
Use the 50 midline for directional bias (above = bullish momentum tilt; below = bearish).
Combine with trend filters (e.g., your chart MA) for higher-probability signals.
Performance note: This is really heavy and depending on how much time your subscription allows you could experience this timing out. Increasing the step size is the easiest way to reduce the load time.
Works on any symbol or timeframe. Like any oscillator, best used alongside price action and risk management rather than in isolation.
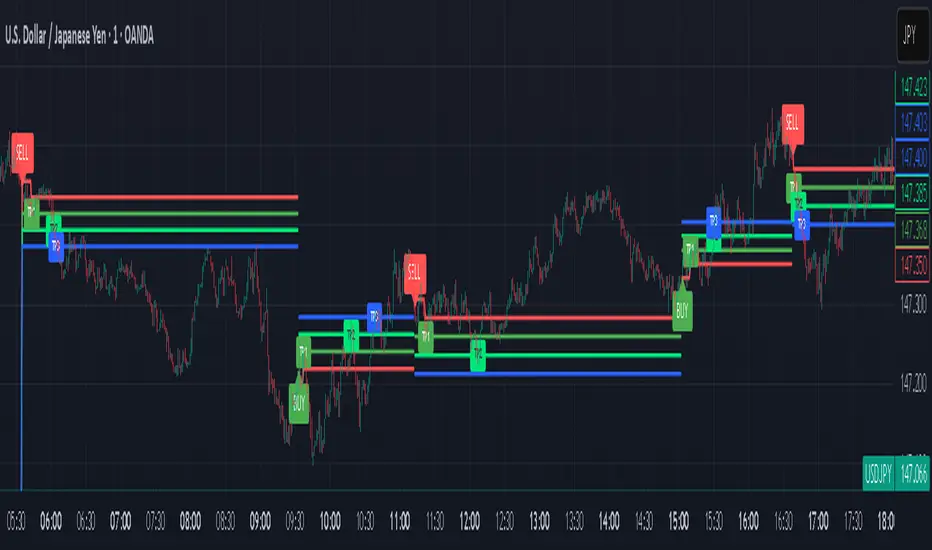
Signalgo VSignalgo V: Technical Overview and Unique Aspects
Signalgo V is a technical indicator for TradingView that integrates multiple layers of analysis: moving averages, MACD, Bollinger Bands and RSI to deliver buy and sell signals. Below is an informational breakdown of how the indicator functions, its input parameters, signal logic, exit methodology, and how it stands apart from traditional moving average (MA) tools, without disclosing specifics that allow for code duplication.
How Signalgo V Works
1. Multi-Layered Technical Synthesis
Signalgo V processes several technical studies simultaneously:
Fast/Slow Moving Averages: Uses either EMA or SMA (user-selected) with adjustable periods. These are central to initial trend detection through crossovers.
MACD Filter: MACD line vs. signal line cross-check ensures trend direction is supported by both momentum and MA structure.
RSI Confirmation: The RSI is monitored to verify that signals are not excessively overbought or oversold, tuning the system to changing momentum regimes.
Bollinger Bands Context: Entry signals are only considered when price action is beyond the Bollinger Bands envelope, which further filters for unusually strong movements.
These strict, multi-indicator entry criteria are designed to ensure only the most robust signals are surfaced, each is contingent on the presence of aligned trend, momentum and volatility.
2. Exit Methodology
Take-Profit Levels: After entering a trade, the strategy automatically sets three predefined profit targets (TP1, TP2, TP3). If the price reaches any of these targets, the system marks it, helping you lock in profits at different stages.
Stop-Loss System: Simultaneously, a stop-loss (SL) value is set, protecting you from significant losses if the market moves against your position.
Dynamic Adjustment: When the first profit target (TP1) is hit, the system can automatically move the stop-loss to your entry price. This means your worst-case outcome is break-even from that point, reducing downside risk.
Trailing Stop-Loss: After TP1 is reached, a dynamic trailing stop can activate. This allows the stop-loss to follow the price as it moves in your favor, aiming to capture more profit if the trend continues, while still protecting your gains if the price reverses.
Visual Markers: The system plots all important exit levels (profit targets, stop-loss, trailing stop) directly on the chart. Optional labels also appear whenever a target or stop-loss is hit, making it easy to see progress.
Visual cues (labels) are plotted directly on the bar where a buy or sell signal triggers, clarifying entry points and aiding manual exit/risk management decisions.
Input Parameters
rsiLen: Lookback period for RSI calculation.
rsiOB and rsiOS: Overbought/oversold thresholds, adaptive to the indicator’s multi-layered logic.
maFastLen and maSlowLen: Periods for fast and slow MAs.
maType: EMA or SMA selectable for both MAs.
bbLen: Length for Bollinger Bands mean calculation.
bbMult: Standard deviation multiplier for BB width.
macdFast, macdSlow, macdSig: Standard MACD parameterization for nuanced momentum oversight.
What Separates Signalgo V from Traditional Moving Average Indicators
Composite Signal Architecture: Where traditional MA systems generate signals solely on MA crossovers, Signalgo V requires layered, cross-confirmational logic across trend (MAs), momentum (MACD), volatility (Bollinger Bands), and market strength (RSI).
Adaptive Volatility Context: MA signals only “count” when price is meaningfully breaking out of its volatility envelope, filtering out most unremarkable crosses that plague basic MA strategies.
Integrated Multi-Factor Filters: Strict compliance with all layers of signal logic is enforced. A marked improvement over MA strategies that lack secondary or tertiary confirmation.
Non-Redundant Event Limiting: Each entry is labeled as a unique event. The indicator does not repeat signals on subsequent bars unless all entry conditions are freshly met.
Trading Strategy Application
Trend Identification: By requiring concurrence among MA, MACD, RSI, and BB, this tool identifies only those trends with robust, multifactor support.
Breakout and Momentum Entry: Signals are bias-toward trades that initiate at likely breakout points (outside BB range), combined with fresh momentum and trend alignment.
Manual Discretion for Exits: The design is to empower traders with high-confidence entries and leave risk management or partial profit-taking adaptive to trader style, using visual cues from all component indicators.
Alert Generation: Each buy/sell event optionally triggers an alert, supporting systematic monitoring without constant chart watching.
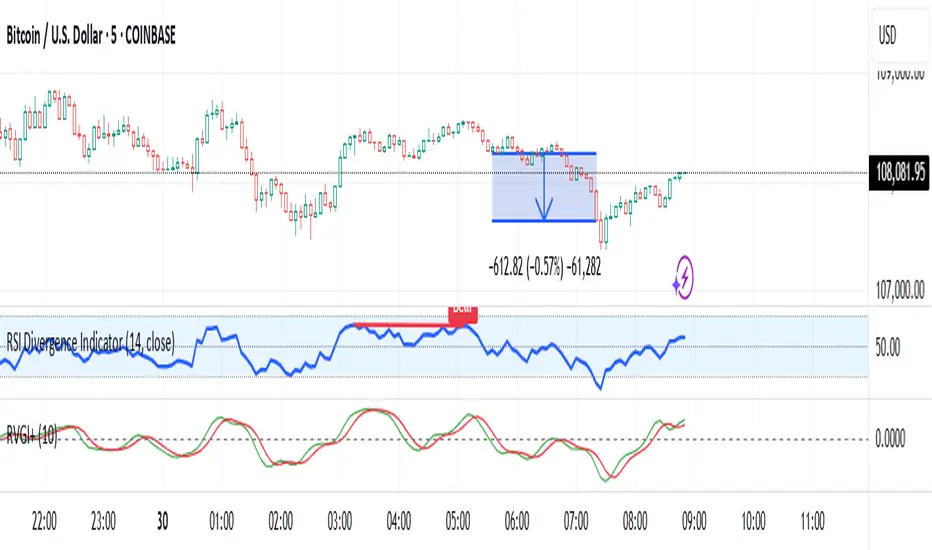
Custom RVGI with Zero Lineits only traditional RVGI available in trading view and its not my own. I just adding zero line for visible comfort. I am not the creater or owner of this RVGI.
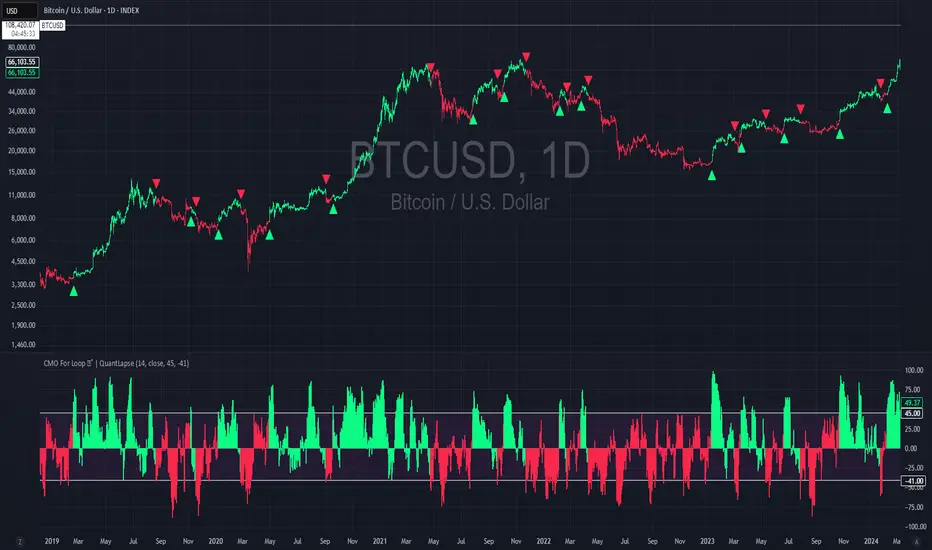
CMO For Loop | QuantLapseCMO For Loop Indicator
The CMO For Loop indicator, inspired by Alex Orekhov's, "Chande Momentum Oscillator," and indicator originally made by Tushar Chande, the CMO designed as a fast and responsive tool to capture quick price movements in financial markets. This oscillator leverages Momentum to measure price deviations, providing a concise yet powerful framework for identifying potential trade entry and exit points. What makes this
"enhanced" CMO indicator special is its ability to identify trending periods more accurately. By using thresholds, this allows the script to enter accurate long and short conditions extremely quickly.
Intended Uses:
Used to capture long-term trends:
Used to identify quick reversals:
Recommended Uses
Best suited for higher timeframes (8H+) to improve accuracy of signals.
Designed for strategies that require fast entries and exits.
Can also be applied to scalping approaches.
Not Recommended For
Should not be used as a mean reversion tool.
Should not be interpreted as a valuation indicator (overbought/oversold levels).
Key Features
Rapid Market Reaction
Built to prioritize speed over smoothing, making it ideal for traders who want to take advantage of quick price shifts in trending or highly volatile markets.
Flexible Thresholds
Users can customize the upper and lower CMO levels to trigger long or short conditions, allowing the indicator to adapt to different assets and trading styles.
Embracing the Noise
Signals may appear frequently, but this is intentional. The tool is optimized for traders who thrive on fast rotations, using the “noise” to catch short-lived yet impactful moves.
Clear Visual Feedback
Plots key oscillator levels and provides dynamic, color-coded candles and shapes that make it easy to identify bias and react quickly.
How It Works
Oscillator Calculation
The CMO (Chande Momentum Oscillator) is derived from comparing the source price’s deviations relative to its momentum. This approach emphasizes trend-driven price shifts.
Signal Triggers
When the oscillator rises above the upper threshold, a long bias is triggered and remains until the CMO drops below the lower threshold.
When the oscillator falls below the lower threshold, a short bias is triggered and remains until the CMO crosses back above the upper threshold.
No bias is active when the oscillator is between thresholds.
Visual Signals
Green candles = long bias
Red candles = short bias
Gray candles = neutral/no signal
Triangles mark points of change in signal direction.
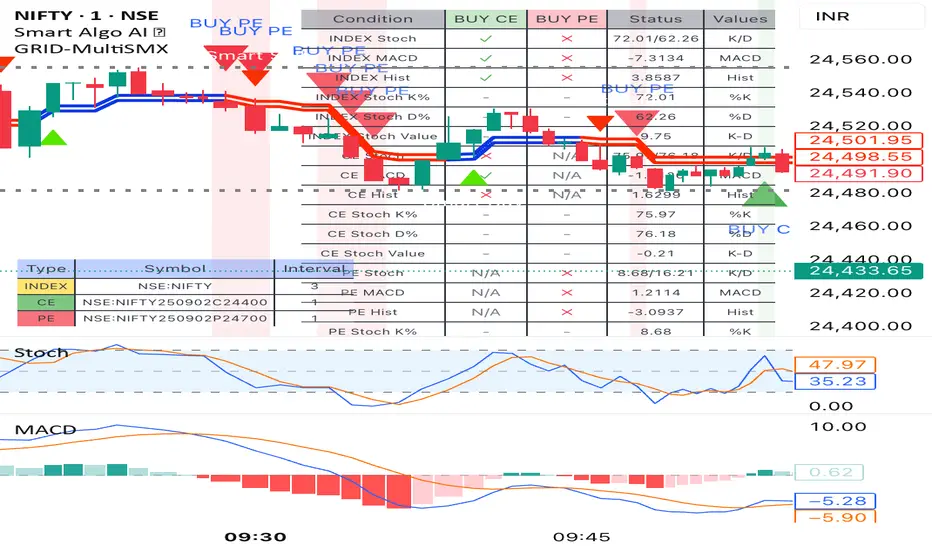
Multi-Symbol Options Trading IndicatorSymbol Configuration: User can input three different symbols (INDEX, CE, PE) with individual timeframes
Customizable Settings: Fully editable MACD and Stochastic parameters
Signal Generation:
BUY CE: When INDEX shows bullish signals AND CE option shows bullish signals
BUY PE: When INDEX shows bearish signals AND PE option shows bullish signals
Signal Conditions:
BUY CE Signal (all must be true):
INDEX: Stochastic %K > %D
INDEX: MACD line > Signal line
INDEX: Histogram shows bullish trend over specified bars
CE: Stochastic %K > %D
CE: MACD line > Signal line
CE: Histogram shows bullish trend over specified bars
BUY PE Signal (all must be true):
INDEX: Stochastic %K < %D
INDEX: MACD line < Signal line
INDEX: Histogram shows bearish trend over specified bars
PE: Stochastic %K > %D
PE: MACD line > Signal line
PE: Histogram shows bullish trend over specified bars
Visual Elements:
Green triangle up with "BUY CE" text when CE signal triggers
Red triangle down with "BUY PE" text when PE signal triggers
Background coloring on signal candles
Conditions table showing real-time status of all conditions
Alerts for both signal types
Usage Instructions:
Add the indicator to your chart
Configure your three symbols (INDEX, CE option, PE option)
Set timeframes for each symbol
Adjust MACD and Stochastic parameters as needed
Set the number of histogram bars for trend analysis
Enable/disable the conditions table and choose its position
The table will show you exactly which conditions are met (✓) or not met (✗) for both signal types, making it easy to monitor the setup in real-time.
Snapfront Coherence Engine (Entropy + Resonance) LiteSnapfront Coherence Engine (SCE) — Lite
The SCE Lite measures when markets shift from chaotic noise into coherent, tradable phases. It blends entropy (Shannon + Tsallis), WCTφ stability, and resonance into a single clarity score.
What it does:
Tracks disorder vs order using entropy math
Highlights trend stability via WCTφ
Detects resonance in market structure
Provides a composite Coherence Score (0–100)
✅ Use it to spot when noise collapses into tradeable clarity.
⚡ Upgrade to SCE Pro (invite-only) for deeper regime filters, custom phase diagnostics, and advanced HUD analytics.

Confluence StackPlease read the instructions below. The code was mostly written using AI so may contain errors. Happy trading all and good luck. ATB Richard
INTENDED USE
This indicator is designed for technical traders who want to move beyond simple buy/sell signals and gain a deeper understanding of the underlying market dynamics. It is ideal for trend followers, swing traders, and anyone looking to confirm the quality of a trend.
WHO IS THIS FOR?
Traders who want to differentiate between strong, sustainable trends and weak, unreliable moves.
Analysts looking to identify high-conviction setups backed by multiple factors (e.g., momentum confirmed by volume).
Discretionary traders who need a quick, visual tool to gauge market sentiment and avoid choppy conditions.
WHY USE IT?
Traditional indicators often give conflicting signals. The Confluence Stack solves this by aggregating multiple perspectives into one clear visual. It helps you answer not just "Is the market going up?" but "WHY is it going up, and how strong is the conviction?". This allows for more informed decision-making and helps filter out low-probability trades.
DISCLAIMER AND LICENSE
This script is for educational purposes only and is not a recommendation to buy or sell any financial instrument. All trading and investment decisions are the sole responsibility of the user. Trading involves significant risk.
This source code is subject to the terms of the Mozilla Public License 2.0 at www.mozilla.org
HOW TO USE THIS INDICATOR
This indicator is designed to show the 'character' of a market move by grouping signals into distinct categories. Instead of seeing many individual signals, you see the strength of the underlying forces driving the price.
1. READ THE HEIGHT (Strength of Confluence)
The total height of the stack shows the strength of agreement. A tall stack means many signals are aligned, indicating a high-conviction move. A short stack means weak agreement and a choppy, indecisive market.
2. READ THE COLOR (Character of the Move)
The colors tell you WHY the market is moving.
BLUE (Momentum): A stack of mostly blue shades indicates a trend driven by pure momentum. This is the 'speed' of the market.
RSI (Relative Strength Index): Measures the magnitude of recent price gains versus losses. A smooth measure of trend strength.
Stochastic Oscillator: Measures the current closing price's position within the recent high-low range. More sensitive to immediate price action.
CCI (Commodity Channel Index): Measures the price's deviation from its moving average. Excels at identifying cyclical turns.
MACD (Moving Average Convergence Divergence): A trend-following momentum indicator showing the relationship between two moving averages. Excellent for identifying the start and end of trends.
YELLOW (Volume): The appearance of yellow shades confirms the move is supported by high market participation. This is the 'fuel' for the trend.
Volume Ratio: A custom signal that triggers when buy or sell volume is unusually high compared to its recent average.
CRV (Candle Range Volume): A custom signal that looks for candles with significant price range and volume.
OBV (On-Balance Volume): A cumulative indicator that adds volume on up days and subtracts it on down days. It shows the long-term flow of money.
FUCHSIA (Volatility): A fuchsia block signals a volatility breakout. This adds a sense of urgency and confirms the price is moving with exceptional force.
Bollinger Bands: A signal triggers when the price closes outside of the upper or lower standard deviation bands.
ORANGE (Price Action): An orange block is a pure price structure signal. It's a raw statement of intent from the market.
Price Gap: A signal that triggers when there's a gap up or gap down between candles.
3. READ THE TRANSITION (Shift in Sentiment)
The most important signal from the stacks is the flip from one side of the zero line to the other.
Flipping from Negative to Positive: A bearish stack disappears and is replaced by a bullish stack. This indicates market sentiment is shifting from bearish to bullish.
Flipping from Positive to Negative: A bullish stack disappears and is replaced by a bearish stack. This warns of a potential top or the start of a new downtrend.
4. FILTER FOR NOISE (Plot Threshold)
In choppy markets, the stack can flicker with low signal counts (e.g., +1 or -1). To focus only on high-conviction moves, go to the indicator settings and increase the "Plot Threshold". A setting of 2 or 3 will hide all stacks that don't have at least 2 or 3 agreeing signals, effectively filtering out market noise and keeping your chart clean.
5. CUSTOMIZE YOUR SIGNALS (Enable/Disable)
This indicator is fully customizable. In the settings, you can enable or disable each of the 9 indicators individually. For example, if you are a pure momentum trader, you could disable all Volume, Volatility, and Price Action signals to focus only on the blue stacks. Tailor it to fit your specific trading style.
EXAMPLE INTERPRETATIONS
Strong, Confirmed Trend: A tall stack of mostly blue (Momentum) and yellow (Volume) indicates a high-quality trend backed by both speed and market participation.
Momentum-Only Trend: A tall stack of only blue is a strong momentum move, but the lack of yellow (Volume) is a warning that the move may lack the "fuel" to be sustained.
Choppy/Indecisive Market: A short, mixed-color stack flickering around the zero line means the market is choppy with no clear conviction. It's often best to stay out.
Volatility Breakout: A new stack that appears suddenly with a fuchsia (Bollinger Bands) block on its first bar suggests a volatility-driven breakout is initiating.
Exhaustion Move: An orange (Price Gap) block appearing at the peak of a tall, long-standing stack can signal an exhaustion gap, potentially marking the end of the trend.
Weakening Conviction (Divergence): If price makes a new high but the positive stack is visibly shorter than the stack at the previous price high, it suggests underlying conviction is weakening.
