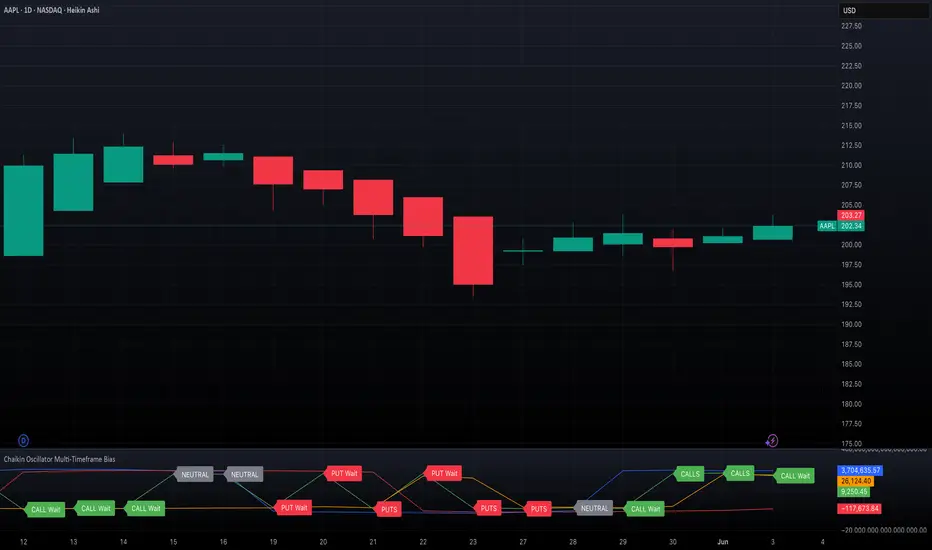
Chaikin Oscillator Multi-Timeframe BiasOverview
Chaikin Oscillator Multi-Timeframe Bias is an indicator designed to help traders align with institutional buying and selling activity by analyzing Chaikin Oscillator signals across two timeframes—a higher timeframe (HTF) for trend bias and a lower timeframe (LTF) for timing. This dual-confirmation model helps traders avoid false breakouts and trade in sync with market momentum and accumulation or distribution dynamics.
Core Concepts
The Chaikin Oscillator measures the momentum of accumulation and distribution based on price and volume. Institutional traders typically accumulate slowly and steadily, and the Chaikin Oscillator helps reveal this pattern. Multi-timeframe analysis confirms whether short-term price action supports the longer-term trend. This indicator applies a smoothing EMA to each Chaikin Oscillator to help confirm direction and reduce noise.
How to Use the Indicator
Start by selecting your timeframes. The higher timeframe, set by default to Daily, establishes the broader directional bias. The lower timeframe, defaulted to 30 minutes, identifies short-term momentum confirmation. The indicator displays one of five labels: CALL Bias, CALL Wait, PUT Bias, PUT Wait, or NEUTRAL. CALL Bias means both HTF and LTF are bullish, signaling a potential opportunity for long or call trades. CALL Wait indicates that the HTF is bullish, but the LTF hasn’t confirmed yet. PUT Bias signals bearish alignment in both HTF and LTF, while PUT Wait indicates HTF is bearish and LTF has not yet confirmed. NEUTRAL means there is no alignment between timeframes and directional trades are not advised.
Interpretation
When the Chaikin Oscillator is above zero and also above its EMA, this indicates bullish momentum and accumulation. When the oscillator is below zero and below its EMA, it suggests bearish momentum and distribution. Bias labels identify when both timeframes are aligned for a higher-probability directional setup. When a “Wait” label appears, it means one timeframe has confirmed bias but the other has not, suggesting the trader should monitor closely but delay entry.
Notes
This indicator includes alerts for both CALL and PUT bias confirmation when both timeframes are aligned. It works on all asset classes, including stocks, ETFs, cryptocurrencies, and futures. Timeframes are fully customizable, and users may explore combinations such as 1D and 1H, or 4H and 15M depending on their strategy. For best results, consider pairing this tool with volume, volatility, or price action analysis.
M-oscillator
QG-Particle OscillatorThis is an advanced oscillator based on auxiliary particle filter. It separates signal from noise and uses smoothing algorithm similar to JMA.
The main oscillator line is a smoothed and detrended version of the price series similar to detrended oscillator line. The purple/aqua lines are a prediction based on an additional adaptive smoothing technique and current volatility.
The prediction is smoothed twice and is supposed to represent the true signal without any noise, thus the prediction should always be less than the raw detrend line. However, certain volatile conditions will cause the prediction to cross above/below the detrend line. When this happens the likelihood of a reversal or pullback is extremely high.
There are 3 dots on the zero line- Red, Green and Yellow. The yellow dots warn of an eminent pullback 2 bars before it actually occurs. This is a non-repainting indicator.
One can also use this indicator to trade CCI signals, similar to zero line rejection in existing trend.
The indicator has 2 settings- Period and Phase. The phase represents cycle phase and Period represents oscillator period.
Credits: This indicator has been originally published for Ninjatrader and this is conversion into pinescript.

CNN Statistical Trading System [PhenLabs]📌 DESCRIPTION
An advanced pattern recognition system utilizing Convolutional Neural Network (CNN) principles to identify statistically significant market patterns and generate high-probability trading signals.
CNN Statistical Trading System transforms traditional technical analysis by applying machine learning concepts directly to price action. Through six specialized convolution kernels, it detects momentum shifts, reversal patterns, consolidation phases, and breakout setups simultaneously. The system combines these pattern detections using adaptive weighting based on market volatility and trend strength, creating a sophisticated composite score that provides both directional bias and signal confidence on a normalized -1 to +1 scale.
🚀 CONCEPTS
• Built on Convolutional Neural Network pattern recognition methodology adapted for financial markets
• Six specialized kernels detect distinct price patterns: upward/downward momentum, peak/trough formations, consolidation, and breakout setups
• Activation functions create non-linear responses with tanh-like behavior, mimicking neural network layers
• Adaptive weighting system adjusts pattern importance based on current market regime (volatility < 2% and trend strength)
• Multi-confirmation signals require CNN threshold breach (±0.65), RSI boundaries, and volume confirmation above 120% of 20-period average
🔧 FEATURES
Six-Kernel Pattern Detection:
Simultaneous analysis of upward momentum, downward momentum, peak/resistance, trough/support, consolidation, and breakout patterns using mathematically optimized convolution kernels.
Adaptive Neural Architecture:
Dynamic weight adjustment based on market volatility (ATR/Price) and trend strength (EMA differential), ensuring optimal performance across different market conditions.
Professional Visual Themes:
Four sophisticated color palettes (Professional, Ocean, Sunset, Monochrome) with cohesive design language. Default Monochrome theme provides clean, distraction-free analysis.
Confidence Band System:
Upper and lower confidence zones at 150% of threshold values (±0.975) help identify high-probability signal areas and potential exhaustion zones.
Real-Time Information Panel:
Live display of CNN score, market state with emoji indicators, net momentum, confidence percentage, and RSI confirmation with dynamic color coding based on signal strength.
Individual Feature Analysis:
Optional display of all six kernel outputs with distinct visual styles (step lines, circles, crosses, area fills) for advanced pattern component analysis.
User Guide
• Monitor CNN Score crossing above +0.65 for long signals or below -0.65 for short signals with volume confirmation
• Use confidence bands to identify optimal entry zones - signals within confidence bands carry higher probability
• Background intensity reflects signal strength - darker backgrounds indicate stronger conviction
• Enter long positions when blue circles appear above oscillator with RSI < 75 and volume > 120% average
• Enter short positions when dark circles appear below oscillator with RSI > 25 and volume confirmation
• Information panel provides real-time confidence percentage and momentum direction for position sizing decisions
• Individual feature plots allow granular analysis of specific pattern components for strategy refinement
💡Conclusion
CNN Statistical Trading System represents the evolution of technical analysis, combining institutional-grade pattern recognition with retail accessibility. The six-kernel architecture provides comprehensive market pattern coverage while adaptive weighting ensures relevance across all market conditions. Whether you’re seeking systematic entry signals or advanced pattern confirmation, this indicator delivers mathematically rigorous analysis with intuitive visual presentation.

RSI-Adaptive T3 [ChartPrime]The RSI-Adaptive T3 is a precision trend-following tool built around the legendary T3 smoothing algorithm developed by Tim Tillson , designed to enhance responsiveness while reducing lag compared to traditional moving averages. Current implementation takes it a step further by dynamically adapting the smoothing length based on real-time RSI conditions — allowing the T3 to “breathe” with market volatility. This dynamic length makes the curve faster in trending moves and smoother during consolidations.
To help traders visualize volatility and directional momentum, adaptive volatility bands are plotted around the T3 line, with visual crossover markers and a dynamic info panel on the chart. It’s ideal for identifying trend shifts, spotting momentum surges, and adapting strategy execution to the pace of the market.
HOIW IT WORKS
At its core, this indicator fuses two ideas:
The T3 Moving Average — a 6-stage recursively smoothed exponential average created by Tim Tillson , designed to reduce lag without sacrificing smoothness. It uses a volume factor to control curvature.
A Dynamic Length Engine — powered by the RSI. When RSI is low (market oversold), the T3 becomes shorter and more reactive. When RSI is high (overbought), the T3 becomes longer and smoother. This creates a feedback loop between price momentum and trend sensitivity.
// Step 1: Adaptive length via RSI
rsi = ta.rsi(src, rsiLen)
rsi_scale = 1 - rsi / 100
len = math.round(minLen + (maxLen - minLen) * rsi_scale)
pine_ema(src, length) =>
alpha = 2 / (length + 1)
sum = 0.0
sum := na(sum ) ? src : alpha * src + (1 - alpha) * nz(sum )
sum
// Step 2: T3 with adaptive length
e1 = pine_ema(src, len)
e2 = pine_ema(e1, len)
e3 = pine_ema(e2, len)
e4 = pine_ema(e3, len)
e5 = pine_ema(e4, len)
e6 = pine_ema(e5, len)
c1 = -v * v * v
c2 = 3 * v * v + 3 * v * v * v
c3 = -6 * v * v - 3 * v - 3 * v * v * v
c4 = 1 + 3 * v + v * v * v + 3 * v * v
t3 = c1 * e6 + c2 * e5 + c3 * e4 + c4 * e3
The result: an evolving trend line that adapts to market tempo in real-time.
KEY FEATURES
⯁ RSI-Based Adaptive Smoothing
The length of the T3 calculation dynamically adjusts between a Min Length and Max Length , based on the current RSI.
When RSI is low → the T3 shortens, tracking reversals faster.
When RSI is high → the T3 stretches, filtering out noise during euphoria phases.
Displayed length is shown in a floating table, colored on a gradient between min/max values.
⯁ T3 Calculation (Tim Tillson Method)
The script uses a 6-stage EMA cascade with a customizable Volume Factor (v) , as designed by Tillson (1998) .
Formula:
T3 = c1 * e6 + c2 * e5 + c3 * e4 + c4 * e3
This technique gives smoother yet faster curves than EMAs or DEMA/Triple EMA.
⯁ Visual Trend Direction & Transitions
The T3 line changes color dynamically:
Color Up (default: blue) → bullish curvature
Color Down (default: orange) → bearish curvature
Plot fill between T3 and delayed T3 creates a gradient ribbon to show momentum expansion/contraction.
Directional shift markers (“🞛”) are plotted when T3 crosses its own delayed value — helping traders spot trend flips or pullback entries.
⯁ Adaptive Volatility Bands
Optional upper/lower bands are plotted around the T3 line using a user-defined volatility window (default: 100).
Bands widen when volatility rises, and contract during compression — similar to Bollinger logic but centered on the adaptive T3.
Shaded band zones help frame breakout setups or mean-reversion zones.
⯁ Dynamic Info Table
A live stats panel shows:
Current adaptive length
Maximum smoothing (▲ MaxLen)
Minimum smoothing (▼ MinLen)
All values update in real time and are color-coded to match trend direction.
HOW TO USE
Use T3 crossovers to detect trend transitions, especially during periods of volatility compression.
Watch for volatility contraction in the bands — breakouts from narrow band periods often precede trend bursts.
The adaptive smoothing length can also be used to assess current market tempo — tighter = faster; wider = slower.
CONCLUSION
RSI-Adaptive T3 modernizes one of the most elegant smoothing algorithms in technical analysis with intelligent RSI responsiveness and built-in volatility bands. It gives traders a cleaner read on trend health, directional shifts, and expansion dynamics — all in a visually efficient package. Perfect for scalpers, swing traders, and algorithmic modelers alike, it delivers advanced logic in a plug-and-play format.

Candle Count RSI📈 Candle Count RSI — A Dual-Perspective Momentum Engine
The Candle Count RSI is a custom-built momentum oscillator that expands on the classic Relative Strength Index (RSI) by introducing a directional-only variant that tracks the frequency of bullish or bearish closes, rather than price magnitude. It gives traders a second lens through which to evaluate momentum, trend conviction, and subtle divergences—often invisible to traditional price-based RSI.
💡 What Makes It Unique?
While the standard RSI is sensitive to the size of price changes, the Candle Count RSI is magnitude-blind. It counts candle closes above/below open over a lookback period, generating a purer signal of directional consistency. To enhance signal fidelity, it includes a streak amplifier, dynamically weighting extended runs of green or red candles to reflect intensity of market bias—without introducing artificial price sensitivity.
This dual-RSI approach allows for:
- Divergence detection between directional bias and price magnitude.
- Smoother trend confirmation in choppy markets.
- Cleaner visual cues using dynamic glow and background logic.
📐 How Standard RSI Actually Works (Not What You Think)
RSI doesn’t just check if price went up or down over a span—it checks each individual candle and tracks whether it closed higher or lower than the one before. Here's how it works under the hood:
1.) For each bar, it calculates the change from the previous close.
2.) It separates those changes into gains (upward moves) and losses (downward moves).
3.) Then it computes a smoothed average of those gains and losses (usually using an RMA).
4.) It calculates the Relative Strength (RS) as:
RS = AvgGain / AvgLoss
5.) Finally, it plugs that into the RSI formula:
RSI = 100 - (100 / (1 + RS))
⚖️ What Does the 50 Line Mean?
- The RSI scale runs from 0 to 100, but 50 is the true neutral zone:
- RSI > 50 means average gains outweigh average losses over the period.
- RSI < 50 means losses dominate.
- RSI ≈ 50? The market is balanced—momentum is indecisive, no clear trend bias.
- This makes 50 a powerful midline for trend filters, directional bias tools, and divergence detection—especially when paired with alternative RSI logic like Candle Count RSI.
🔧 Inputs and Customization
- Everything is fully modular and customizable:
🧠 Core Settings
- RSI Length: Used for both the standard RSI and Candle Count RSI.
📉 Standard RSI
- Classic RSI calculation based on price changes.
- Optional WMA smoothing to reduce noise.
- Glow effect toggle with custom intensity.
🕯 Candle Count RSI
- Computes RSI using only the count of up/down candles.
- Optional smoothing for stability.
- Amplifies streaks (e.g., multiple consecutive bullish candles increase strength).
- Glow effect toggle with adjustable strength.
🎇 Glow Visuals
- Background glow (subpane and/or main chart).
- Fades based on RSI distance from the 50 midpoint.
- Independent color settings for bull and bear bias.
🧬 Divergence Zones
- Detects when Candle RSI and Standard RSI diverge.
- Highlights:
- Bullish Divergence: Candle RSI > 50, Standard RSI < threshold.
- Bearish Divergence: Candle RSI < 50, Standard RSI > threshold.
- Background fill optionally shown in subpane and/or main chart.
📊 Directional Histogram
- MACD-style histogram showing the difference between the two RSI lines.
- Color-coded based on directional agreement:
- Both rising → green.
- Both falling → red.
- Conflict → yellow.
🧠 Under the Hood — How It Works
🔹 Standard RSI
- Classic ta.rsi() applied to close prices, optionally WMA-smoothed.
🔹 Candle Count RSI (CCR)
- Counts how many candles closed up/down over the period.
- Computes a magnitude-free RSI from these counts.
- Applies a streak-based multiplier to exaggerate trend strength during consecutive green/red runs.
- Optionally smoothed with WMA to create a clean signal line.
- This makes CCR ideal for detecting true directional bias without being faked out by volatile price spikes.
🔹 Divergence Logic
- When Candle RSI and Standard RSI disagree strongly across defined thresholds, background fills highlight early signs of momentum decay or hidden accumulation/distribution.
🔹 Glow Logic
- Glow zones are controlled by a master toggle and drawn with dynamic transparency:
- Further from 50 = stronger conviction = darker glow.
- Shows up in subpane and/or main chart depending on user preference.
📷 Suggested Use Case / Visual Setup
- Use in conjunction with your primary price action system.
- Watch for divergences between the Candle Count RSI and Standard RSI for early trend reversals.
- Use glow bias zones on the main chart to get subconscious directional cues during fast scalping.
- Histogram helps you confirm when both RSI variants agree—useful during strong trending conditions.
🛠️ Tip for Traders
- This tool isn’t trying to “predict” price. It’s designed to visualize hidden market psychology—when buyers are showing up with consistent pressure, or when momentum has a disconnect between conviction and magnitude. Use this to filter entries, spot weak rallies, or sense when a trend is about to break down.
⚠️ WARNING
- Not for use with Heikin Ashi, Renko, etc.).
🧠 Summary
Candle Count RSI is not just another mashup—it's a precision-built, dual-perspective oscillator that captures directional conviction using real candle behavior. Whether you're scalping intraday or swing trading momentum, this script helps clarify trend integrity and exposes hidden weaknesses with elegance and clarity.
—
🛠️ Built by: Sherlock_MacGyver
Feel free to share feedback or reach out if you'd like to collaborate on custom features.

Demand Index (Hybrid Sibbet) by TradeQUODemand Index (Hybrid Sibbet) by TradeQUO \
\Overview\
The Demand Index (DI) was introduced by James Sibbet in the early 1990s to gauge “real” buying versus selling pressure by combining price‐change information with volume intensity. Unlike pure price‐based oscillators (e.g. RSI or MACD), the DI highlights moves backed by above‐average volume—helping traders distinguish genuine demand/supply from false breakouts or low‐liquidity noise.
\Calculation\
\
\ \Step 1: Weighted Price (P)\
For each bar t, compute a weighted price:
```
Pₜ = Hₜ + Lₜ + 2·Cₜ
```
where Hₜ=High, Lₜ=Low, Cₜ=Close of bar t.
Also compute Pₜ₋₁ for the prior bar.
\ \Step 2: Raw Range (R)\
Calculate the two‐bar range:
```
Rₜ = max(Hₜ, Hₜ₋₁) – min(Lₜ, Lₜ₋₁)
```
This Rₜ is used indirectly in the exponential dampener below.
\ \Step 3: Normalize Volume (VolNorm)\
Compute an EMA of volume over n₁ bars (e.g. n₁=13):
```
EMA_Volₜ = EMA(Volume, n₁)ₜ
```
Then
```
VolNormₜ = Volumeₜ / EMA_Volₜ
```
If EMA\_Volₜ ≈ 0, set VolNormₜ to a small default (e.g. 0.0001) to avoid division‐by‐zero.
\ \Step 4: BuyPower vs. SellPower\
Calculate “raw” BuyPowerₜ and SellPowerₜ depending on whether Pₜ > Pₜ₋₁ (bullish) or Pₜ < Pₜ₋₁ (bearish). Use an exponential dampener factor Dₜ to moderate extreme moves when true range is small. Specifically:
• If Pₜ > Pₜ₋₁,
```
BuyPowerₜ = (VolNormₜ) / exp
```
otherwise
```
BuyPowerₜ = VolNormₜ.
```
• If Pₜ < Pₜ₋₁,
```
SellPowerₜ = (VolNormₜ) / exp
```
otherwise
```
SellPowerₜ = VolNormₜ.
```
Here, H₀ and L₀ are the very first bar’s High/Low—used to calibrate the scale of the dampening. If the denominator of the exponential is near zero, substitute a small epsilon (e.g. 1e-10).
\ \Step 5: Smooth Buy/Sell Power\
Apply a short EMA (n₂ bars, typically n₂=2) to each:
```
EMA_Buyₜ = EMA(BuyPower, n₂)ₜ
EMA_Sellₜ = EMA(SellPower, n₂)ₜ
```
\ \Step 6: Raw Demand Index (DI\_raw)\
```
DI_rawₜ = EMA_Buyₜ – EMA_Sellₜ
```
A positive DI\_raw indicates that buying force (normalized by volume) exceeds selling force; a negative value indicates the opposite.
\ \Step 7: Optional EMA Smoothing on DI (DI)\
To reduce choppiness, compute an EMA over DI\_raw (n₃ bars, e.g. n₃ = 1–5):
```
DIₜ = EMA(DI_raw, n₃)ₜ.
```
If n₃ = 1, DI = DI\_raw (no further smoothing).
\
\Interpretation\
\
\ \Crossing Zero Line\
• DI\_raw (or DI) crossing from below to above zero signals that cumulative buying pressure (over the chosen smoothing window) has overcome selling pressure—potential Long signal.
• Crossing from above to below zero signals dominant selling pressure—potential Short signal.
\ \DI\_raw vs. DI (EMA)\
• When DI\_raw > DI (the EMA of DI\_raw), bullish momentum is accelerating.
• When DI\_raw < DI, bullish momentum is weakening (or bearish acceleration).
\ \Divergences\
• If price makes new highs while DI fails to make higher highs (DI\_raw or DI declining), this hints at weakening buying power (“bearish divergence”), possibly preceding a reversal.
• If price makes new lows while DI fails to make lower lows (“bullish divergence”), this may signal waning selling pressure and a potential bounce.
\ \Volume Confirmation\
• A strong price move without a corresponding rise in DI often indicates low‐volume “fake” moves.
• Conversely, a modest price move with a large DI spike suggests true institutional participation—often a more reliable breakout.
\
\Usage Notes & Warnings\
\
\ \Never Use DI in Isolation\
It is a \filter\ and \confirmation\ tool—combine with price‐action (trendlines, support/resistance, candlestick patterns) and risk management (stop‐losses) before executing trades.
\ \Parameter Selection\
• \Vol EMA length (n₁)\: Commonly 13–20 bars. Shorter → more responsive to volume spikes, but noisier.
• \Buy/Sell EMA length (n₂)\: Typically 2 bars for fast smoothing.
• \DI smoothing (n₃)\: Usually 1 (no smoothing) or 3–5 for moderate smoothing. Long DI\_EMA (e.g. 20–50) gives a slower signal.
\ \Market Adaptation\
Works well in liquid futures, indices, and heavily traded stocks. In thinly traded or highly erratic markets, adjust n₁ upward (e.g., 20–30) to reduce noise.
---
\In Summary\
The Demand Index (James Sibbet) uses a three‐stage smoothing (volume → Buy/Sell Power → DI) to reveal true demand/supply imbalance. By combining normalized volume with price change, Sibbet’s DI helps traders identify momentum backed by real participation—filtering out “empty” moves and spotting early divergences. Always confirm DI signals with price action and sound risk controls before trading.

Adaptive Volume‐Demand‐Index (AVDI)Demand Index (according to James Sibbet) – Short Description
The Demand Index (DI) was developed by James Sibbet to measure real “buying” vs. “selling” strength (Demand vs. Supply) using price and volume data. It is not a standalone trading signal, but rather a filter and trend confirmer that should always be used together with chart structure and additional indicators.
---
\ 1. Calculation Basis\
1. Volume Normalization
$$
\text{normVol}_t
= \frac{\text{Volume}_t}{\mathrm{EMA}(\text{Volume},\,n_{\text{Vol}})_t}
\quad(\text{e.g., }n_{\text{Vol}} = 13)
$$
This smooths out extremely high volume spikes and compares them to the average (≈ 1 means “average volume”).
2. Price Factor
$$
\text{priceFactor}_t
= \frac{\text{Close}_t - \text{Open}_t}{\text{Open}_t}.
$$
Positive values for bullish bars, negative for bearish bars.
3. Component per Bar
$$
\text{component}_t
= \text{normVol}_t \times \text{priceFactor}_t.
$$
If volume is above average (> 1) and the price rises slightly, this yields a noticeably positive value; conversely if the price falls.
4. Raw DI (Rolling Sum)
Over a window of \$w\$ bars (e.g., 20):
$$
\text{RawDI}_t
= \sum_{i=0}^{w-1} \text{component}_{\,t-i}.
$$
Alternatively, recursively for \$t \ge w\$:
$$
\text{RawDI}_t
= \text{RawDI}_{t-1}
+ \text{component}_t
- \text{component}_{\,t-w}.
$$
5. Optional EMA Smoothing
An EMA over RawDI (e.g., \$n\_{\text{DI}} = 50\$) reduces short-term fluctuations and highlights medium-term trends:
$$
\text{EMA\_DI}_t
= \mathrm{EMA}(\text{RawDI},\,n_{\text{DI}})_t.
$$
6.Zero Line
Handy guideline:
RawDI > 0: Accumulated buying power dominates.
RawDI < 0: Accumulated selling power dominates.
2. Interpretation & Application
Crossing Zero
RawDI above zero → Indication of increasing buying pressure (potential long signal).
RawDI below zero → Indication of increasing selling pressure (potential short signal).
Not to be used alone for entry—always confirm with price action.
RawDI vs. EMA_DI
RawDI > EMA\_DI → Acceleration of demand.
RawDI < EMA\_DI → Weakening of demand.
Divergences
Price makes a new high, RawDI does not make a higher high → potential weakness in the uptrend.
Price makes a new low, RawDI does not make a lower low → potential exhaustion of the downtrend.
3. Typical Signals (for Beginners)
\ 1. Long Setup\
RawDI crosses zero from below,
RawDI > EMA\_DI (acceleration),
Price closes above a short-term swing high or resistance.
Stop-Loss: just below the last swing low, Take-Profit/Trailing: on reversal signals or fixed R\:R.
2. Short Setup
RawDI crosses zero from above,
RawDI < EMA\_DI (increased selling pressure),
Price closes below a short-term swing low or support.
Stop-Loss: just above the last swing high.
---
4. Notes and Parameters
Recommended Values (Beginners):
Volume EMA (n₍Vol₎) = 13
RawDI window (w) = 20
EMA over DI (n₍DI₎) = 50 (medium-term) or 1 (no smoothing)
Attention:\
NEVER use in isolation. Always in combination with price action analysis (trendlines, support/resistance, candlestick patterns).
Especially during volatile news phases, RawDI can fluctuate strongly → EMA\_DI helps to avoid false signals.
---
Conclusion The Demand Index by James Sibbet is a powerful filter to assess price movements by their volume backing. It shows whether a rally is truly driven by demand or merely a short-term volume anomaly. In combination with classic chart analysis and risk management, it helps to identify robust entry points and potential trend reversals earlier.

TrendMaster Pro 2.3 with Alerts
Hello friends,
A member of the community approached me and asked me how to write an indicator that would achieve a particular set of goals involving comprehensive trend analysis, risk management, and session-based trading controls. Here is one example method of how to create such a system:
Core Strategy Components
Multi-Moving Average System - Uses configurable MA types (EMA, SMA, SMMA) with short-term (9) and long-term (21) periods for primary signal generation through crossovers
Higher Timeframe Trend Filter - Optional trend confirmation using a separate MA (default 50-period) to ensure trades align with broader market direction
Band Power Indicator - Dynamic high/low bands calculated using different MA types to identify price channels and volatility zones
Advanced Signal Filtering
Bollinger Bands Volatility Filter - Prevents trading during low-volatility ranging markets by requiring sufficient band width
RSI Momentum Filter - Uses customizable thresholds (55 for longs, 45 for shorts) to confirm momentum direction
MACD Trend Confirmation - Ensures MACD line position relative to signal line aligns with trade direction
Stochastic Oscillator - Adds momentum confirmation with overbought/oversold levels
ADX Strength Filter - Only allows trades when trend strength exceeds 25 threshold
Session-Based Trading Management
Four Trading Sessions - Asia (18:00-00:00), London (00:00-08:00), NY AM (08:00-13:00), NY PM (13:00-18:00)
Individual Session Limits - Separate maximum trade counts for each session (default 5 per session)
Automatic Session Closure - All positions close at specified market close time
Risk Management Features
Multiple Stop Loss Options - Percentage-based, MA cross, or band-based SL methods
Risk/Reward Ratio - Configurable TP levels based on SL distance (default 1:2)
Auto-Risk Calculation - Dynamic position sizing based on dollar risk limits ($150-$250 range)
Daily Limits - Stop trading after reaching specified TP or SL counts per day
Support & Resistance System
Multiple Pivot Types - Traditional, Fibonacci, Woodie, Classic, DM, and Camarilla calculations
Flexible Timeframes - Auto-adjusting or manual timeframe selection for S/R levels
Historical Levels - Configurable number of past S/R levels to display
Visual Customization - Individual color and display settings for each S/R level
Additional Features
Alert System - Customizable buy/sell alert messages with once-per-bar frequency
Visual Trade Management - Color-coded entry, SL, and TP levels with fill areas
Session Highlighting - Optional background colors for different trading sessions
Comprehensive Filtering - All signals must pass through multiple confirmation layers before execution
This approach demonstrates how to build a professional-grade trading system that combines multiple technical analysis methods with robust risk management and session-based controls, suitable for algorithmic trading across different market sessions.
Good luck and stay safe!

Momentum Fusion v1Momentum Fusion v1
Overview
Momentum Fusion v1 (MFusion) is a multi-oscillator indicator that combines several components to analyze market momentum and trend strength. It incorporates modified versions of classic indicators such as PVI (Positive Volume Index), NVI (Negative Volume Index), MFI (Money Flow Index), RSI, Stochastic, and Bollinger Bands Oscillator. The indicator displays a histogram that changes color based on momentum strength and includes "FUSION🔥" signal labels when extreme values are reached.
Indicator Settings
Parameters:
EMA Length – Smoothing period for the moving average (default: 255).
Smoothing Period – Internal calculation smoothing parameter (default: 15).
BB Multiplier – Standard deviation multiplier for Bollinger Bands (default: 2.0).
Show verde / marron / media lines – Toggles the display of auxiliary lines.
Show FUSION🔥 label – Enables/disables signal labels.
Indicator Components
1. PVI (Positive Volume Index)
Formula:
pvi := volume > volume ? nz(pvi ) + (close - close ) / close * sval : nz(pvi )
Description:
PVI increases when volume rises compared to the previous bar and accounts for price percentage change. The stronger the price movement with increasing volume, the higher the PVI value.
2. NVI (Negative Volume Index)
Formula:
nvi := volume < volume ? nz(nvi ) + (close - close ) / close * sval : nz(nvi )
Description:
NVI tracks price movements during declining volume. If the price rises on low volume, it may indicate a "stealth" trend.
3. Money Flow Index (MFI)
Formula:
100 - 100 / (1 + up / dn)
Description:
An oscillator measuring money flow strength. Values above 80 suggest overbought conditions, while values below 20 indicate oversold conditions.
4. Stochastic Oscillator
Formula:
k = 100 * (close - lowest(low, length)) / (highest(high, length) - lowest(low, length))
Description:
A classic stochastic oscillator showing price position relative to the selected period's range.
5. Bollinger Bands Oscillator
Formula:
(tprice - BB midline) / (upper BB - lower BB) * 100
Description:
Indicates the price position relative to Bollinger Bands in percentage terms.
Key Lines & Histogram
1. Verde (Green Line)
Calculation:
verde = marron + oscp (normalized PVI)
Interpretation:
Higher values indicate stronger bullish momentum. A FUSION🔥 signal appears when the value reaches 750+.
2. Marron (Brown Line)
Calculation:
marron = (RSI + MFI + Bollinger Osc + Stochastic / 3) / 2
Interpretation:
A composite oscillator combining multiple indicators. Higher values suggest overbought conditions.
3. Media (Red Line)
Calculation:
media = EMA of marron with smoothing period
Interpretation:
Acts as a signal line for trend confirmation.
4. Histogram
Calculation:
histo = verde - marron
Colors:
Bright green (>100) – Strong bullish momentum.
Light green (>0) – Moderate bullish momentum.
Orange (<0) – Bearish momentum.
Red (<-100) – Strong bearish momentum.
Signals & Alerts
1. FUSION🔥 (Strong Momentum)
Condition:
verde >= 750
Visualization:
A "FUSION🔥" label appears below the chart.
Alert:
Can be set to trigger notifications when the condition is met.
2. Background Aura
Condition:
verde > 850
Visualization:
The chart background turns teal, indicating extreme momentum.
Usage Recommendations
FUSION🔥 Signal – Can be used as a long entry point when confirmed by other indicators.
Histogram:
1. Green bars – Potential long entry.
2. Red/orange bars – Potential short entry.
3. Media & Marron Crossover – Can serve as an additional trend filter.
4. Suitable for a 5-15 minute time frame
Conclusion
Momentum Fusion v1 is a powerful tool for momentum analysis, combining multiple indicators into a unified system. It is suitable for:
Trend traders (catching strong movements).
Scalpers (identifying short-term impulses).
Swing traders (filtering entry points).
The indicator features customizable settings and visual signals, making it adaptable to various trading styles.

HARSI PRO v2 - Advanced Adaptive Heikin-Ashi RSI OscillatorThis script is a fully re-engineered and enhanced version of the original Heikin-Ashi RSI Oscillator created by JayRogers. While it preserves the foundational concept and visual structure of the original indicatorusing Heikin-Ashi-style candles to represent RSI movementit introduces a range of institutional-grade engines and real-time analytics modules.
The core idea behind HARSI is to visualize the internal structure of RSI behavior using candle representations. This gives traders a clearer sense of trend continuity, exhaustion, and momentum inflection. In this upgraded version, the system is extended far beyond basic visualization into a comprehensive diagnostic and context-tracking tool.
Core Enhancements and Features
1. Heikin-Ashi RSI Candles
The base HARSI logic transforms RSI values into open, high, low, and close components, which are plotted as Heikin-Ashi-style candles. The open values are smoothed with a user-controlled bias setting, and the high/low are calculated from zero-centered RSI values.
2. Smoothed RSI Histogram and Plot
A secondary RSI plot and histogram are available for traditional RSI interpretation, optionally smoothed using a custom midpoint EMA process.
3. Dynamic Stochastic RSI Ribbon
The indicator optionally includes a smoothed Stochastic RSI ribbon with directional fill to highlight acceleration and reversal zones.
4. Real-Time Meta-State Engine
This engine determines the current market environmentneutral, breakout, or reversalbased on multiple adaptive conditions including volatility compression, momentum thrust, volume behavior, and composite reversal scoring.
5. Adaptive Overbought/Oversold Zone Engine
Instead of using fixed RSI thresholds, this engine dynamically adjusts OB/OS boundaries based on recent RSI range and normalized price volatility. This makes the OB/OS levels context-sensitive and more accurate across different instruments and regimes.
6. Composite Reversal Score Engine
A real-time score between 0 and 5 is generated using four components:
* OB/OS proximity (zone score)
* RSI slope behavior
* Volume state (burst or exhaustion)
* Trend continuation penalty based on position versus trend bias
This score allows for objective filtering of reversal zones and breakout traps.
7. Kalman Velocity Filter
A Kalman-style adaptive smoothing filter is applied to RSI for calculating velocity and acceleration. This allows for real-time detection of stalls and thrusts in RSI behavior.
8. Predictive Breakout Estimator
Uses ATR compression and RSI thrusting conditions to detect likely breakout environments. This logic contributes to the Meta-State Engine and the Breakout Risk dashboard metric.
9. Volume Acceleration Model
Real-time detection of volume bursts and fades based on VWMA baselines. Volume exhaustion warnings are used to qualify or disqualify reversals and breakouts.
10. Trend Bias and Regime Detection
Uses RSI slope, HARSI body impulse, and normalized ATR to classify the current trend state and directional bias. This forms the basis for filtering false reversals during strong trends.
11. Dashboard with Tooltips
A clean, table displays six key metrics in real time:
* Meta State
* Reversal Score
* Trend Bias
* Volume State
* Volatility Regime
* Breakout Risk
Each cell includes a descriptive tooltip explaining why the value is being shown based on internal state calculations.
How It Works Internally
* The system calculates a zero-centered RSI and builds candle structures using high, low, and smoothed open/close values.
* Volatility normalization is used throughout the script, including ATR-based thresholds and dynamic scaling of OB/OS zones.
* Momentum is filtered through smoothed slope calculations and HARSI body size measurements.
* Volume activity is compared against VWMA using configurable multipliers to detect institutional-level activity or exhaustion.
* Each regime detection module contributes to a centralized metaState classifier that determines whether the environment is conducive to reversal, breakout, or neutral action.
* All major signal and context values are continuously updated in a dashboard table with logic-driven color coding and tooltips.
Based On and Credits
This script is based on the original Heikin-Ashi RSI Oscillator by JayRogers . All visual elements from the original version, including candle plotting and color configurations, have been retained and extended. Significant backend enhancements were added by AresIQ for the 2025 release. The script remains open-source under the original attribution license. Credit to JayRogers is preserved and required for any derivative versions.

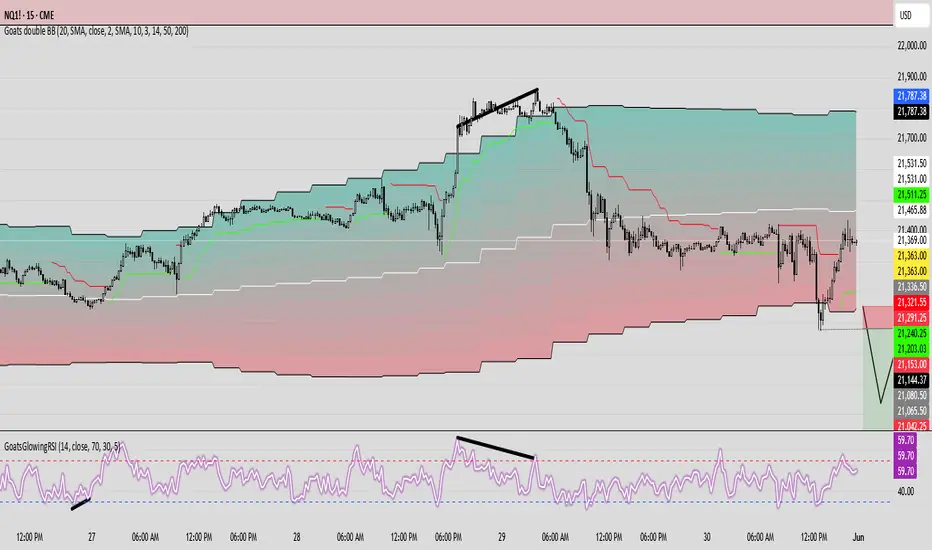
GoatsGlowingRSIGoatsGlowingRSI is a visually enhanced and feature-rich RSI (Relative Strength Index) indicator designed for deeper market insight and clearer signal visualization. It combines standard RSI analysis with gradient-colored backgrounds, glowing effects, and automated divergence detection to help traders spot potential reversals and momentum shifts more effectively.
Key Features:
✅ Multi-Timeframe RSI:
Calculate RSI from any timeframe using the custom input. Leave it blank to use the current chart's timeframe.
✅ Dynamic Gradient Background:
A smooth gradient fill is applied between RSI levels from the lower band (30) to the upper band (70). The gradient shifts from blue (oversold) to red (overbought), visually highlighting the RSI's position and strength.
✅ Glowing RSI Line:
A three-layered glow effect surrounds the main RSI line, creating a striking white core with a purple aura that enhances visibility against dark or light chart themes.
✅ Custom RSI Levels:
Dashed horizontal lines at RSI 70 (overbought), RSI 30 (oversold), and a dotted midline at 50 help you interpret trend momentum and strength.
✅ Automatic Divergence Detection:
Built-in logic identifies bullish and bearish divergences by comparing RSI and price pivot points:
🟢 Bullish Divergence: RSI makes a higher low while price makes a lower low.
🔴 Bearish Divergence: RSI makes a lower high while price makes a higher high.
Divergences are marked on the RSI line with colored lines and labels ("Bull"/"Bear").
✅ Alerts Ready:
Get notified in real-time with alert conditions for both bullish and bearish divergence setups.
RSI Multi-TF TabRSI Multi-Timeframe Table 📊
A tool for multi-timeframe RSI analysis with visual overbought/oversold level highlighting.
Description
This indicator calculates the Relative Strength Index (RSI) for the current chart and displays RSI values across five additional timeframes (15m, 1h, 4h, 1d, 1w) in a dynamic table. The color-coded system simplifies identifying overbought (>70), oversold (<30), and neutral zones. Visual signals on the chart enhance analysis for the current timeframe.
Key Features
✅ Multi-Timeframe Analysis :
Track RSI across 15m, 1h, 4h, 1d, and 1w in a compact table.
Color-coded alerts:
🔴 Red — Overbought (potential pullback),
🔵 Blue — Oversold (potential rebound),
🟡 Yellow — Neutral zone.
✅ Visual Signals :
Background shading for oversold/overbought zones on the main chart.
Horizontal lines at 30 and 70 levels for reference.
✅ Customizable Settings :
Adjust RSI length (default: 14), source (close, open, high, etc.), and threshold levels.
How to Use
Table Analysis :
Compare RSI values across timeframes to spot divergences (e.g., overbought on 15m vs. oversold on D).
Use colors for quick decisions.
Chart Signals :
Blue background suggests bullish potential (oversold), red hints at bearish pressure (overbought).
Always confirm with other tools (volume, trends, or candlestick patterns).
Examples :
RSI(1h) > 70 while RSI(4h) < 30 → Possible reversal upward.
Sustained RSI(1d) above 50 may indicate a bullish trend.
Settings
RSI Length : Period for RSI calculation (default: 14).
RSI Source : Data source (close, open, high, low, hl2, hlc3, ohlc4).
Overbought/Oversold Levels : Thresholds for alerts (default: 70/30).
Important Notes
No direct trading signals : Use this as an analytical tool, not a standalone strategy.
Test strategies historically and consider market context before trading.

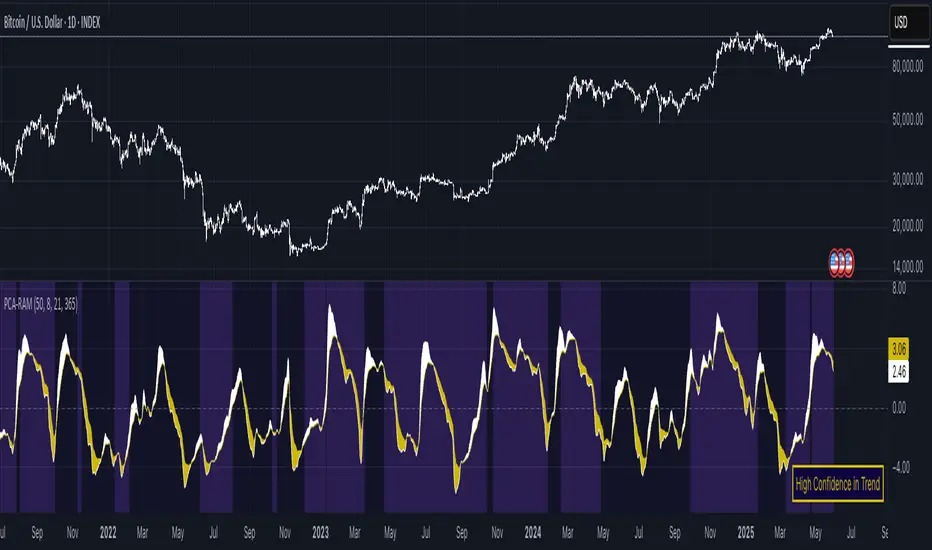
PCA Regime-Adjusted MomentumSummary
The PCA Regime-Adjusted Momentum (PCA-RAM) is an advanced market analysis tool designed to provide nuanced insights into market momentum and structural stability. It moves beyond traditional indicators by using Principal Component Analysis (PCA) to deconstruct market data into its most essential patterns.
The indicator provides two key pieces of information:
A smoothed momentum signal based on the market's dominant underlying trend.
A dynamic regime filter that gauges the stability and clarity of the market's structure, advising you when to trust or fade the momentum signals.
This allows traders to not only identify potential shifts in momentum but also to understand the context and confidence behind those signals.
Core Concepts & Methodology
The strength of this indicator lies in its sound, data-driven methodology.
1. Principal Component Analysis (PCA)
At its core, the indicator analyzes a rolling window (default 50 periods) of standardized market data (Open, High, Low, Close, and Volume). PCA is a powerful statistical technique that distills this complex, 5-dimensional data into its fundamental, uncorrelated components of variance. We focus on the First Principal Component (PC1), which represents the single most dominant pattern or "theme" driving the market's behavior in the lookback window.
2. The Momentum Signal
Instead of just looking at price, we project the current market data onto this dominant underlying pattern (PC1). This gives us a raw "projection score" that measures how strongly the current bar aligns with the historically dominant market structure. This raw score is then smoothed using two an exponential moving averages (a fast and a slow line) to create a clear, actionable momentum signal, similar in concept to a MACD.
3. The Dynamic Regime Filter
This is arguably the indicator's most powerful feature. It answers the question: "How clear is the current market picture?"
It calculates the Market Concentration Ratio, which is the percentage of total market variance explained by PC1 alone.
A high ratio indicates that the market is moving in a simple, one-dimensional way (e.g., a clear, strong trend).
A low ratio indicates the market is complex, multi-dimensional, and choppy, with no single dominant theme.
Crucially, this filter is dynamic. It compares the current concentration ratio to its own recent average, allowing it to adapt to any asset or timeframe. It automatically learns what "normal" and "choppy" look like for the specific chart you are viewing.
How to Interpret the Indicator
The indicator is displayed in a separate pane with two key visual elements:
The Momentum Lines (White & Gold)
White Line: The "Fast Line," representing the current momentum.
Gold Line: The "Slow Line," acting as the trend confirmation.
Bullish Signal: A crossover of the White Line above the Gold Line suggests a shift to positive momentum.
Bearish Signal: A crossover of the White Line below the Gold Line suggests a shift to negative momentum.
The Regime Filter (Purple & Dark Red Background)
This is your confidence gauge.
Navy Blue Background (High Concentration): The market structure is stable, simple, and trending. Momentum signals are more reliable and should be given higher priority.
Dark Red Background (Low Concentration): The market structure is complex, choppy, or directionless. Momentum signals are unreliable and prone to failure or "whipsaws." This is a signal to be cautious, tighten stops, or potentially stay out of the market.
Potential Trading Strategies
This tool is versatile and can be used in several ways:
1. Primary Signal Strategy
Condition: Wait for the background to turn Purple, confirming a stable, high-confidence regime.
Entry: Take the next crossover signal from the momentum lines (White over Gold for long, White under Gold for short).
Exit/Filter: Consider exiting positions or ignoring new signals when the background turns Navy.
2. As a Confirmation or Filter for Your Existing Strategy
Do you have a trend-following system? Only enable its long and short signals when the PCA-RAM background is Purple.
Do you have a range-trading or mean-reversion system? It might be most effective when the PCA-RAM background is Navy, indicating a lack of a clear trend.
3. Advanced Divergence Analysis
Look for classic divergences between price and the momentum lines. For example, if the price is making a new high, but the Gold Line is making a lower high, it may indicate underlying weakness in the trend, even on a Purple background. This divergence signal is more powerful because it shows that the new price high is not being confirmed by the market's dominant underlying pattern.
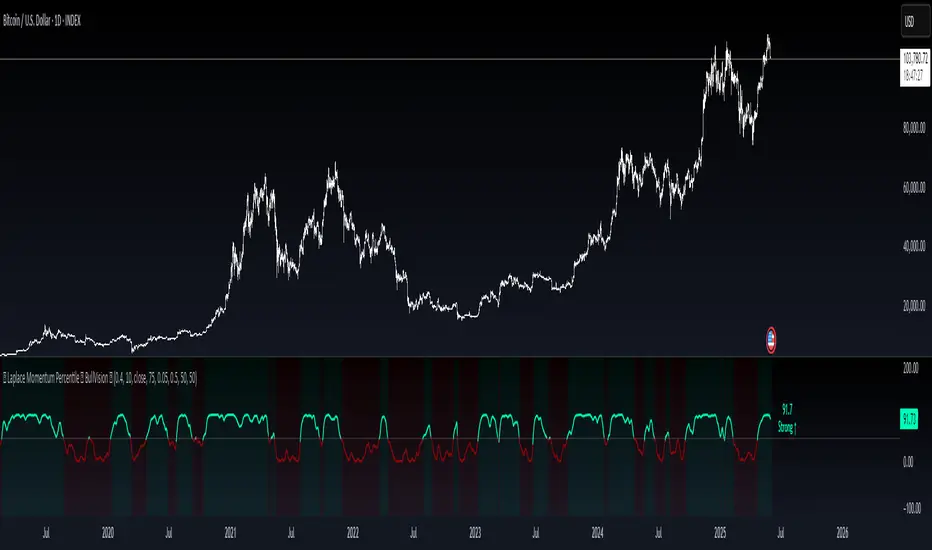
Laplace Momentum Percentile ║ BullVision 🔬 Overview
Laplace Momentum Percentile ║ BullVision is a custom-built trend analysis tool that applies Laplace-inspired smoothing to price action and maps the result to a historical percentile scale. This provides a contextual view of trend intensity, with optional signal refinement using a Kalman filter.
This indicator is designed for traders and analysts seeking a normalized, scale-independent perspective on market behavior. It does not attempt to predict price but instead helps interpret the relative strength or weakness of recent movements.
⚙️ Key Concepts
📉 Laplace-Based Smoothing
The core signal is built using a Laplace-style weighted average, applying an exponential decay to price values over a specified length. This emphasizes recent movements while still accounting for historical context.
🎯 Percentile Mapping
Rather than displaying the raw output, the filtered signal is converted into a percentile rank based on its position within a historical lookback window. This helps normalize interpretation across different assets and timeframes.
🧠 Optional Kalman Filter
For users seeking additional smoothing, a Kalman filter is included. This statistical method updates signal estimates dynamically, helping reduce short-term fluctuations without introducing significant lag.
🔧 User Settings
🔁 Transform Parameters
Transform Parameter (s): Controls the decay rate for Laplace weighting.
Calculation Length: Sets how many candles are used for smoothing.
📊 Percentile Settings
Lookback Period: Defines how far back to calculate the historical percentile ranking.
🧠 Kalman Filter Controls
Enable Kalman Filter: Optional toggle.
Process Noise / Measurement Noise: Adjust the filter’s responsiveness and tolerance to volatility.
🎨 Visual Settings
Show Raw Signal: Optionally display the pre-smoothed percentile value.
Thresholds: Customize upper and lower trend zone boundaries.
📈 Visual Output
Main Line: Smoothed percentile rank, color-coded based on strength.
Raw Line (Optional): The unsmoothed percentile value for comparison.
Trend Zones: Background shading highlights strong upward or downward regimes.
Live Label: Displays current percentile value and trend classification.
🧩 Trend Classification Logic
The indicator segments percentile values into five zones:
Above 80: Strong upward trend
50–80: Mild upward trend
20–50: Neutral zone
0–20: Mild downward trend
Below 0: Strong downward trend
🔍 Use Cases
This tool is intended as a visual and contextual aid for identifying trend regimes, assessing historical momentum strength, or supporting broader confluence-based analysis. It can be used in combination with other tools or frameworks at the discretion of the trader.
⚠️ Important Notes
This script does not provide buy or sell signals.
It is intended for educational and analytical purposes only.
It should be used as part of a broader decision-making process.
Past signal behavior should not be interpreted as indicative of future results.
Strategy Builder With IndicatorsThis strategy script is designed for traders who enjoy building systems using multiple indicators.
Please note: This script does not include any built-in indicators. Instead, it works by referencing the plot outputs of the indicators you’ve already added to your chart.
For example, if you add a MACD and an ATR indicator to your chart, you can assign their plot values as inputs in the settings panel of this strategy.
• MACD as a trigger
• ATR as a filter
How Filters Work
Filters check whether certain conditions are met before a trade can be opened. For instance, if you set a filter like ATR > 30, then no trade will be executed unless that condition is true — even if the trigger fires.
All filters are linked, meaning every active filter must be satisfied for a trade to occur.
How Triggers Work
Triggers are what actually fire a trade signal — such as a moving average crossover or RSI breaking above a specific level. Unlike filters, triggers are independent. Only one active trigger needs to be true for the trade to execute.
Thanks to its modular structure, this strategy can be used with any indicator of your choice.
⸻
Risk Management Features
In the settings, you’ll find flexible options for:
• Stop Loss (SL)
• Trailing Stop Loss (TSL)
• Multi Take-Profit (TP)
These features enhance trade safety and let you tailor your risk management.
SL types available:
• Tick-based SL
• Percent-based SL
• ATR-based SL
Once you select your preferred SL type, you can fine-tune its distance using the offset field.
Trailing SL allows your stop to follow price as it moves in your favor — helping to lock in profits.
Multi-TP lets you take profits at two different levels, helping you secure gains while leaving room for extended moves.
Breakeven option is also available to automatically move your SL to entry after reaching a profit threshold.
⸻
How to Build a Solid Strategy
Let’s break down a good setup into three key components:
1. Trend Filter
Avoid trading against the trend — that’s like swimming against the current.
Use a filter like:
• Supertrend
• Momentum indicators
• Candlestick bias, etc.
Example: In this case, I used Supertrend and filtered for trades only if the price is above the uptrend line.
2. Trigger Condition
Once we confirm the trend is on our side, we need a trigger to execute at the right moment. This can be:
• RSI cross
• Candlestick patterns
• Trendline breaks
• Moving average crossovers, etc.
Example: I used RSI crossing above 50 as the entry trigger.
3. Risk Management
Even in the right trend at the right time — anything can happen. That’s why you should always define Stop Loss and Take Profit levels.
⸻
And there you have it! Your strategy is ready to backtest, refine, and deploy with alerts for live trading.
Questions or suggestions? Feel free to reach out

Commodity Trend Reactor [BigBeluga]
🔵 OVERVIEW
A dynamic trend-following oscillator built around the classic CCI, enhanced with intelligent price tracking and reversal signals.
Commodity Trend Reactor extends the traditional Commodity Channel Index (CCI) by integrating trend-trailing logic and reactive reversal markers. It visualizes trend direction using a trailing stop system and highlights potential exhaustion zones when CCI exceeds extreme thresholds. This dual-level system makes it ideal for both trend confirmation and mean-reversion alerts.
🔵 CONCEPTS
Based on the CCI (Commodity Channel Index) oscillator, which measures deviation from the average price.
Trend bias is determined by whether CCI is above or below user-defined thresholds.
Trailing price bands are used to lock in trend direction visually on the main chart.
Extreme values beyond ±200 are treated as potential reversal zones.
🔵 FEATURES\
CCI-Based Trend Shifts:
Triggers a bullish bias when CCI crosses above the upper threshold, and bearish when it crosses below the lower threshold.
Adaptive Trailing Stops:
In bullish mode, a trailing stop tracks the lowest price; in bearish mode, it tracks the highest.
Top & Bottom Markers:
When CCI surpasses +200 or drops below -200, it plots colored squares both on the oscillator and on price, marking potential reversal zones.
Background Highlights:
Each time a trend shift occurs, the background is softly colored (lime for bullish, orange for bearish) to highlight the change.
🔵 HOW TO USE
Use the oscillator to monitor when CCI crosses above or below threshold values to detect trend activation.
Enter trades in the direction of the trailing band once the trend bias is confirmed.
Watch for +200 and -200 square markers as warnings of potential mean reversals.
Use trailing stop areas as dynamic support/resistance to manage stop loss and exit strategies.
The background color changes offer clean confirmation of trend transitions on chart.
🔵 CONCLUSION
Commodity Trend Reactor transforms the simple CCI into a complete trend-reactive framework. With real-time trailing logic and clear reversal alerts, it serves both momentum traders and contrarian scalpers alike. Whether you’re trading breakouts or anticipating mean reversions, this indicator provides clarity and structure to your decision-making.

Session-Based Sentiment Oscillator [TradeDots]Track, analyze, and monitor market sentiment across global trading sessions with this advanced multi-session sentiment analysis tool. This script provides session-specific sentiment readings for Asian (Tokyo), European (London), and US (New York) markets, combining price action, volume analysis, and volatility factors into a comprehensive sentiment oscillator. It is an original indicator designed to help traders understand regional market psychology and capitalize on cross-session sentiment shifts directly on TradingView.
📝 HOW IT WORKS
1. Multi-Component Sentiment Engine
Price Action Momentum : Calculates normalized price movement relative to recent trading ranges, providing directional sentiment readings.
Volume-Weighted Analysis : When volume data is available, incorporates volume flow direction to validate price-based sentiment signals.
Volatility-Adjusted Factors : Accounts for changing market volatility conditions by comparing current ATR against historical averages.
Weighted Combination : Merges all components using optimized weightings (Price: 1.0, Volume: 0.3, Volatility: 0.2) for balanced sentiment readings.
2. Session-Segregated Tracking
Automatic Session Detection : Precisely identifies active trading sessions based on user-configured time parameters.
Independent Calculations : Maintains separate sentiment accumulation for each major session, updated only during respective active hours.
Historical Preservation : Stores session-specific sentiment values even when sessions are closed, enabling cross-session comparison.
Real-Time Updates : Continuously processes sentiment during active sessions while preserving inactive session data.
3. Cross-Session Transition Analysis
Sentiment Differential Detection : Monitors sentiment changes when transitioning between trading sessions.
Configurable Thresholds : Generates signals only when sentiment shifts exceed user-defined minimum thresholds.
Directional Signals : Provides distinct bullish and bearish transition alerts with visual markers.
Smart Filtering : Applies smoothing algorithms to reduce false signals from minor sentiment variations.
⚙️ KEY FEATURES
1. Session-Specific Dashboard
Real-Time Status Display : Shows current session activity (ACTIVE/CLOSED) for all three major sessions.
Sentiment Percentages : Displays precise sentiment readings as percentages for easy interpretation.
Strength Classification : Automatically categorizes sentiment as HIGH (>50%), MEDIUM (20-50%), or LOW (<20%).
Customizable Positioning : Place dashboard in any corner with adjustable size options.
2. Advanced Signal Generation
Transition Alerts : Triangle markers indicate significant sentiment shifts between sessions.
Extreme Conditions : Diamond markers highlight overbought/oversold threshold breaches.
Configurable Sensitivity : Adjust signal thresholds from 0.05 to 0.50 based on trading style.
Alert Integration : Built-in TradingView alert conditions for automated notifications.
3. Forex Currency Strength Analysis
Base/Quote Decomposition : For forex pairs, separates sentiment into individual currency strength components.
Major Currency Support : Analyzes USD, EUR, GBP, JPY, CHF, CAD, AUD, NZD strength relationships.
Relative Strength Display : Shows which currency is driving pair movement during active sessions.
4. Visual Enhancement System
Session Background Colors : Distinct background shading for each active trading session.
Overbought/Oversold Zones : Configurable extreme sentiment level visualization with colored zones.
Multi-Timeframe Compatibility : Works across all timeframes while maintaining session accuracy.
Customizable Color Schemes : Full color customization for dashboard, signals, and plot elements.
🚀 HOW TO USE IT
1. Add the Script
Search for "Session-Based Sentiment Oscillator " in the Indicators tab or manually add it to your chart. The indicator will appear in a separate pane below your main chart.
2. Configure Session Times
Asian Session : Set Tokyo market hours (default: 00:00-09:00) based on your chart timezone.
European Session : Configure London market hours (default: 07:00-16:00) for European analysis.
US Session : Define New York market hours (default: 13:00-22:00) for American markets.
Timezone Adjustment : Ensure session times match your broker's specifications and account for daylight saving changes.
3. Optimize Analysis Parameters
Sentiment Period : Choose 5-50 bars (default: 14) for sentiment calculation lookback period.
Smoothing Settings : Select 1-10 bars smoothing (default: 3) with SMA, EMA, or RMA options.
Component Selection : Enable/disable volume analysis, price action, and volatility factors based on available data.
Signal Sensitivity : Adjust threshold from 0.05-0.50 (default: 0.15) for transition signal generation.
4. Interpret Readings and Signals
Positive Values : Indicate bullish sentiment for the active session.
Negative Values : Suggest bearish sentiment conditions.
Dashboard Status : Monitor which session is currently active and their respective sentiment strengths.
Transition Signals : Watch for triangle markers indicating significant cross-session sentiment changes.
Extreme Alerts : Note diamond markers when sentiment reaches overbought (>70%) or oversold (<-70%) levels.
5. Set Up Alerts
Configure TradingView alerts for:
- Bullish session transitions
- Bearish session transitions
- Overbought condition alerts
- Oversold condition alerts
❗️LIMITATIONS
1. Data Dependency
Volume Requirements : Volume-based analysis only functions when volume data is provided by your broker. Many forex brokers do not supply reliable volume data.
Price Action Focus : In absence of volume data, sentiment calculations rely primarily on price movement and volatility factors.
2. Session Time Sensitivity
Manual Adjustment Required : Session times must be manually updated for daylight saving time changes.
Broker Variations : Different brokers may have slightly different session definitions requiring time parameter adjustments.
3. Ranging Market Limitations
Trend Bias : Sentiment calculations may be less reliable during extended sideways or low-volatility market conditions.
Lag Consideration : As with all sentiment indicators, readings may lag during rapid market transitions.
4. Regional Market Focus
Major Session Coverage : Designed primarily for major global sessions; may not capture sentiment from smaller regional markets.
Weekend Gaps : Does not account for weekend gap effects on sentiment calculations.
⚠️ RISK DISCLAIMER
Trading and investing carry significant risk and can result in financial loss. The "Session-Based Sentiment Oscillator " is provided for informational and educational purposes only. It does not constitute financial advice.
- Always conduct your own research and analysis
- Use proper risk management and position sizing in all trades
- Past sentiment patterns do not guarantee future market behavior
- Combine this indicator with other technical and fundamental analysis tools
- Consider overall market context and your personal risk tolerance
This script is an original creation by TradeDots, published under the Mozilla Public License 2.0.
Session-based sentiment analysis should be used as part of a comprehensive trading strategy. No single indicator can predict market movements with certainty. Exercise proper risk management and maintain realistic expectations about indicator performance across varying market conditions.

QQQ Strategy v2 ESL | easy-peasy-x This is a strategy optimized for QQQ (and SPY) for the 1H timeframe. It significantly outperforms passive buy-and-hold approach. With settings adjustments, it can be used on various assets like stocks and cryptos and various timeframes, although the default out of the box settings favor QQQ 1H.
The strategy uses various triggers to take both long and short trades. These can be adjusted in settings. If you try a different asset, see what combination of triggers works best for you.
Some of the triggers employ LuxAlgo's Ultimate RSI - shoutout to him for great script, check it out here .
Other triggers are based on custom signed standard deviation - basically the idea is to trade Bollinger Bands expansions (long to the upside, short to the downside) and fade or stay out of contractions.
There are three key moving averages in the strategy - LONG MA, SHORT MA, BASIC MA. Long and Short MAs are guides to eyes on the chart and also act as possible trend filters (adjustable in settings). Basic MA acts as guide to eye and a possible trade trigger (adjustable in settings).
There are a few trend filters the strategy can use - moving average, signed standard deviation, ultimate RSI or none. The filters act as an additional condition on triggers, making the strategy take trades only if both triggers and trend filter allows. That way one can filter out trades with unfavorable risk/reward (for instance, don't long if price is under the MA200). Different trade filters can be used for long and short trades.
The strategy employs various stop loss types, the default of which is a trailing %-based stop loss type. ATR-based stop loss is also available. The default 1.5% trailing stop loss is suitable for leveraged trading.
Lastly, the strategy can trigger take profit orders if certain conditions are met, adjustable in settings. Also, it can hold onto winning trades and exit only after stop out (in which case, consecutive triggers to take other positions will be ignored until stop out).
Let me know if you like it and if you use it, what kind of tweaks would you like to see.
With kind regards,
easy-peasy-x

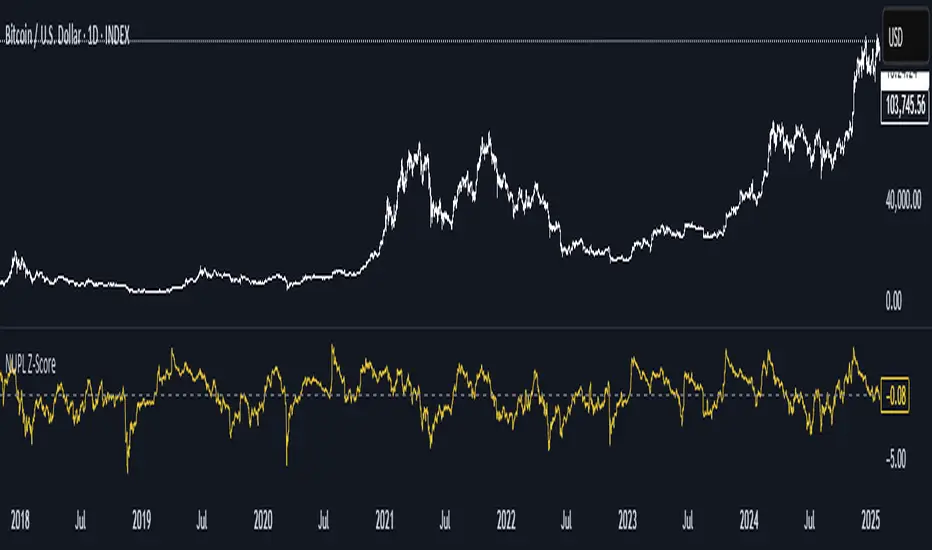
NUPL Z-ScoreThis indicator is derived from Market Value and Realized Value, which can be defined as:
Market Value: The current price of Bitcoin multiplied by the number of coins in circulation. This is like market cap in traditional markets i.e. share price multiplied by number of shares.
Realized Value: Rather than taking the current price of Bitcoin, Realized Value takes the price of each Bitcoin when it was last moved i.e. the last time it was sent from one wallet to another wallet. It then adds up all those individual prices and takes an average of them. It then multiplies that average price by the total number of coins in circulation.
By subtracting Realized Value from Market Value we calculate Unrealized Profit/Loss.
Unrealized Profit/Loss estimates the total paper profits/losses in Bitcoin held by investors. This is interesting to know but of greater value is identifying how this changes relatively over time.
To do this we can divide Unrealized Profit/Loss by Market Cap. This creates Net Unrealized Profit/Loss, sometimes referred to as NUPL, which is very useful to track investor sentiment over time for Bitcoin.
Relative Unrealised Profit/Loss is another name used for this analysis.
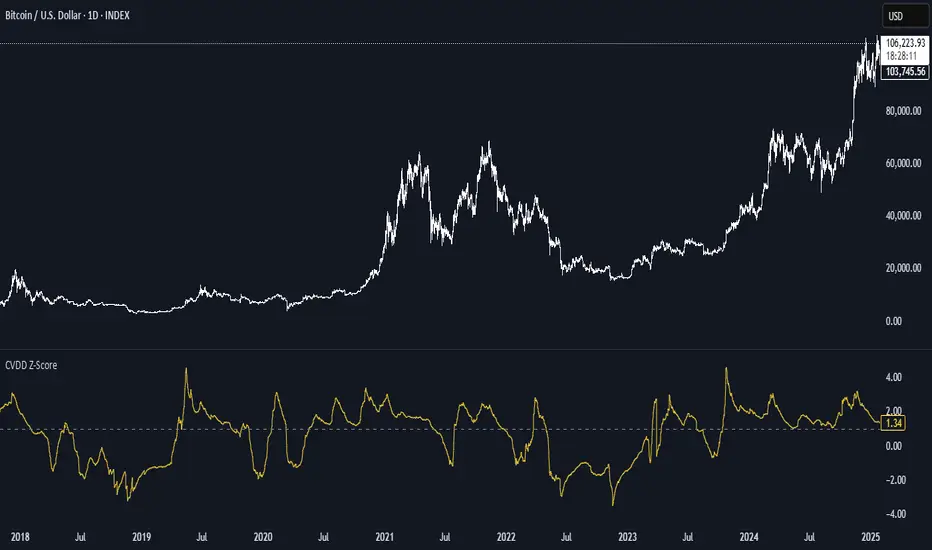
CVDD Z-ScoreCVDD stands for Cumulative Value Coin Days Destroyed.
Coin Days Destroyed is a term used for bitcoin to identify a value of sorts to UTXO’s (unspent transaction outputs). You can learn more about UTXO’s here. They can be thought of as coins moving between wallets.
int this script you have the option to change the Z-Score length.
Supply In Profit Z-ScoreZ-score of BTC Supply in Profit.
Supply in Profit is an On-Chain BTC indicator that shows the percentage of BTC in profit.
In this indicator you can choose to use a Z-Score or not.

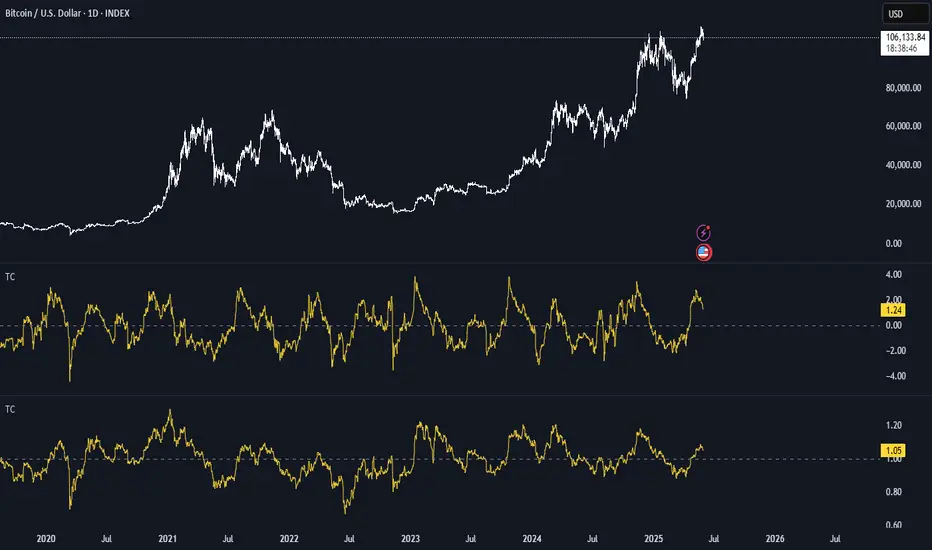
BTC Thermocap Z-ScoreBTC Thermocap Indicator Overview
The BTC Thermocap is a specialized on-chain ratio indicator designed to provide deeper insight into Bitcoin's market valuation relative to its cumulative issuance. By comparing the current market price of Bitcoin to the total value of all BTC ever mined (also known as "thermocap"), this indicator helps identify potential overvaluation or undervaluation periods within the Bitcoin market cycle.
Key Features and Customizable Inputs:
Moving Average Length (MA Length)
Moving Average Type (MA Type) - SMA or EMA
Z-Score Calculation Length
Z-Score Toggle (Use Z-Score)
Average RSI (Daily + Weekly)📈 Average RSI (Relative Strength Index) – Beginner’s Guide
What it is:
The Average RSI is a technical indicator that combines multiple RSI values—such as daily and weekly RSI—into a single, smoothed line. This helps traders get a clearer picture of a stock’s momentum over both short- and medium-term timeframes.
Why it matters:
The RSI tells you whether a stock is potentially overbought (priced too high and due for a pullback) or oversold (priced too low and due for a bounce). Traditional RSI uses a scale from 0 to 100, with key levels at 70 (overbought) and 30 (oversold).
By averaging RSI across different timeframes, you reduce noise and get a better signal for trends and reversals.
How traders use it:
✅ Buy zone: When the average RSI dips below 40, it could signal a good entry point.
⚠️ Neutral zone: Between 40 and 60 means the trend isn’t strong—wait for more confirmation.
🚫 Sell zone: Above 60–70 may indicate the asset is overbought or due for a pullback.
Helpful for:
Spotting better entry/exit points
Filtering out false signals
Staying in trend-following trades longer
