[VJ]Phoenix Force of PSAR +MACD +RSIThis is a simple intraday strategy for working on Stocks or commodities based out on PSAR, MACD , RSI and chop index . You can modify the start time and end time based on your timezones. Session value should be from market start to the time you want to square-off
Important: The end time should be at least 2 minutes before the intraday square-off time set by your broker
Comment below if you get good returns
Strategy: Entry Exits using PSAR and momentum and trend using MACD and RSI. A chop index is used as filtering
Indicators used :
Parabolic SAR is a technical indicator that is used to determine the price direction of stocks and it also draws attention to the traders when the price is changing
PSAR helps you:
Identify when a certain price trend is going to change direction
Indicate the most effective level at which to enter into the trade
Indicate the most effective exit point for the trade
Moving average convergence divergence (MACD) is a trend-following momentum indicator that shows the relationship between two moving averages of a security's price. ... Traders may buy the security when the MACD crosses above its signal line and sell—or short—the security when the MACD crosses below the signal line
RSI is intended to chart the current and historical strength or weakness of a stock or market based on the closing prices of a recent trading period.
Buying/Selling
When trading with the parabolic SAR, you would buy a market when the dots move below the current asset price and are green in colour. Alternatively, you would sell a market when the dots move above the current asset price and are red in colour. We use MACD , RSI to ensure that a right trade is picked when PSAR gives an indication. CI is used to stay away from the range bound market as much as possible.
Usage & Best setting :
Choose a good volatile stock and a time frame - 5m.
MA length : 200
RSI threshold : 50
MACD: 12,26,9
There is stop loss and take profit that can be used to optimise your trade
The template also includes daily square off based on your time.
Moving Average Convergence / Divergence (MACD)

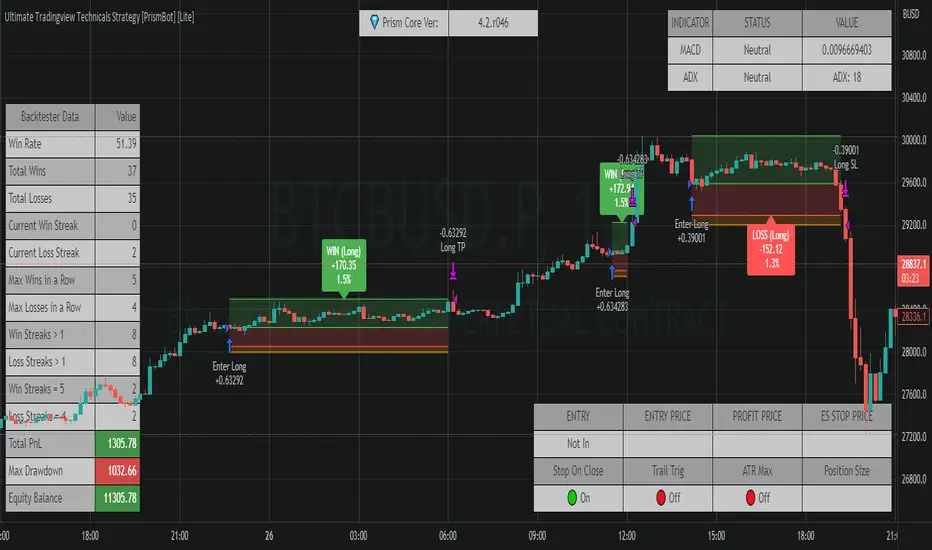
Ultimate Tradingview Technicals Strategy [PrismBot] [Lite]Included in this builder:
MACD
RSI
Tradingview Technical Analysis
Ichimoku
Global Trend Filter
Pullback Filter
Our most robust strategy to date with MACD , RSI , and many other basic strategies included as well as additional filters and alert options.
It is an advanced trading strategy built with the intent to make it easy for anyone to begin trading, but also avoid too much complication of strategy concepts.
For instance, you can change the MACD settings to be "more sensitive" by using a simple dropdown menu, and adjust which strategy you are employing with the MACD on the fly with another.
You can easily enable and disable strategies using the checkbox.
The strategy demo results use 100% equity per trade as an example - the reason for this is that the stop loss is set to 1%, so each trade is risking 1% (give or take slippage). Slippage is set to 5 ticks, and a 0.04% commission (Binance average for market and limit orders)
This strategy incorporates a risk to reward system where the user can select between ATR and Percent based stop losses and take profit targets. This means that the user has much better control over money management when utilizing this strategy and it doesn't require you to babysit the strategy to ensure it's entering and existing strategies in an ideal place.
The status box shows the current state of the various strategies and their values. A red circle indicates the filter / strategy is not valid for entry yet. A green circle indicates that filter / strategy is valid for entry. When all selected strategies are valid simultaneously, the next bar will trigger an entry signal.
If you have any questions about this strategy, please leave them in the comments below, or DM for more details. Thanks!
Additional features in this lite strategy:
✔️ Tweak a multitude of specific settings (MA lengths, R:R, SL distance etc)
✔️ Use money management and risk calculations
✔️ Draw trade info directly to chart (eg. SL size in percent, win rate etc)
✔️ Use various filters (eg. time filter, date filter etc)
✔️ Manage risk per position
✔️ Sync to any bot or algorithmic trading system
Super_Macd_Alerts_EMA_publicQuickly find market caps, risk management and predict the timing of contrarian tensions.
By automatically receiving trend changes, we support trend follow, push and return strategies simply and quickly.
Make the most of this all-in-one system and take your trading style one step further.
・ Main functions
MACD slope change signal (UP / DN)
MACD hidden divergence signal (HL / HS)
Histogram divergence signal (vertical background: blue / pink)
You need to use signals without going against the trend.
·idea
Recommended for use with Elliott Wave, SUPER TREND
・ Chart example
WTI Crude Oil Futures | HS Signal Before Crash
GOLD CFD 1D
2021/7/1
UP signal before returning to the UP trend
2021/8/5
HS signal before the crash
BTCUSD 4H
2021/08/10
Signals to use: UP / HL on uptrend, Histogram divergence (pink)

MACD, EMA, Know sure thing, Chopy Market StrategyHey there :)
This is the free version of the script. The following indicators / settings are missing:
- Support and resistance zones
- dynamic textboxes for alarms when using bots (3 Commas, Alertatron, etc.)
- a table showing the current position, indicators and other important information
With this script there is the possibility to completely customize the MACD . Starting with the MACD and signal line, the histogram and the color of the histogram.
Since the Pinecoders team has previously deleted the script, I will mention the fee settings in a bit more detail:
In this script a fee of 0.01% and a slipage of 15 was used. With each trade the total capital (100%) is used with a risk reward of 1 to 1.5.
The total capital, i.e. the risk, can be changed at any time under the "Settings" tab at "Equity".
I also added an EMA , the Know sure thing indicator and the Chopy Market indicator (by TradingRush) to the script to filter out bad trades.
The EMA:
Since the EMA is very reliable and shows whether there is an upward or downward trend, it should be used with the indicators in any case. It prevents long trades in downward movements and vice versa.
The KST Indicator:
The KST indicator has a similar movement as the MACD , but is by and large a bit more time delayed. It filters out false swings of the MACD and thus prevents bad trades.
The Chopy Market Indicator by Tradingrush:
The Chopy Market indicator, which was introduced by TradingRush in one of its videos, has the ability to detect sideways markets and block zones below this line for trades by means of a fixed value (the line).
To exit the trades, I added the following options:
ATR Exits. Exits based on past candles (lowest low, highest high).
Static exits based on set percentages.
In the next days I will create a tutorial for the script, just have a look on my profile.
If you have any questions about the script, let me know.

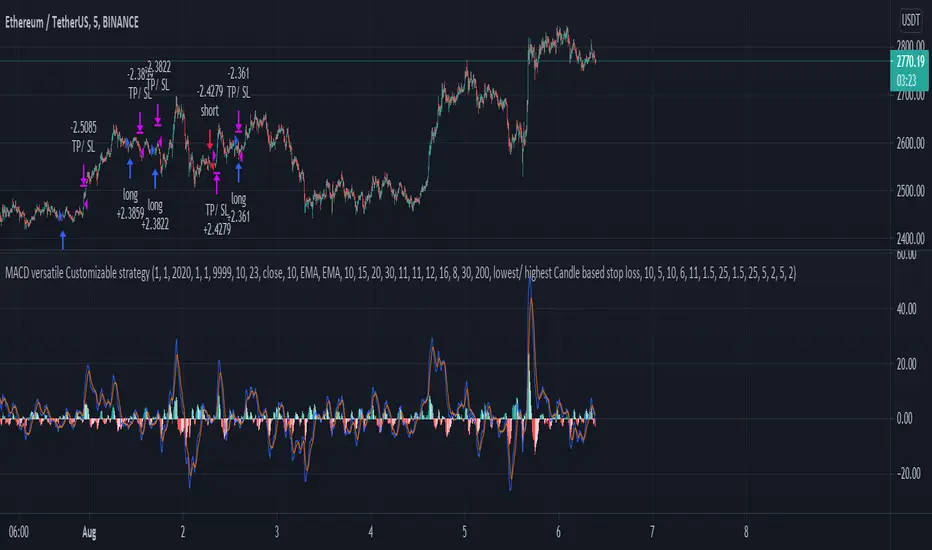
MACD, EMA, Know sure thing, Chopy Market - high adaptabilityHey there :)
This is the free version of the script. The following indicators / settings are missing:
- Support and resistance zones
- dynamic textboxes for alarms when using bots (3 Commas, Alertatron, etc.)
- a table showing the current position, indicators and other important information
With this script there is the possibility to completely customize the MACD . Starting with the MACD and signal line, the histogram and the color of the histogram.
Since the Pinecoders team has previously deleted the script, I will mention the fee settings in a bit more detail:
In this script a fee of 0.01% and a slipage of 15 was used. With each trade the total capital (100%) is used with a risk reward of 1 to 1.5.
The total capital, i.e. the risk, can be changed at any time under the "Settings" tab at "Equity".
I also added an EMA , the Know sure thing indicator and the Chopy Market indicator (by TradingRush) to the script to filter out bad trades.
The EMA:
Since the EMA is very reliable and shows whether there is an upward or downward trend, it should be used with the indicators in any case. It prevents long trades in downward movements and vice versa.
The KST Indicator:
The KST indicator has a similar movement as the MACD, but is by and large a bit more time delayed. It filters out false swings of the MACD and thus prevents bad trades.
The Chopy Market Indicator by Tradingrush:
The Chopy Market indicator, which was introduced by TradingRush in one of its videos, has the ability to detect sideways markets and block zones below this line for trades by means of a fixed value (the line).
To exit the trades, I added the following options:
ATR Exits. Exits based on past candles (lowest low, highest high).
Static exits based on set percentages.
In the next days I will create a tutorial for the script, just have a look on my profile.
If you have any questions about the script, let me know.
Forex bot full strategy with risk managementThis is a full strategy designed for forex major pairs, specially EUR/USD using 1h time frame chart.
Its components are
200 EMA
MACD
OBV
PSAR
RIsk management with tp and sl movements
Rules for entry
For long = Previous histogram from MACD was below 0 and current one is above 0. CLose of a candle is above EMA 200 , OBV oscillator is negative and we have an uptrend from PSAR
For short = Previous histogram from MACD was above 0 and current one is below 0. CLose of a candle is below EMA 200 , OBV oscillator is positive and we have an downtrend from PSAR
Rules for exit
For tp and sl values we calculate the distance from the close of candle until the psar values.
If you have any questions, let me know !

Forex scalper 2xEMA + SRSI + MACDThis is a forex scalping strategy designed for the most liquid pairs, like major forex pairs.
Its made of
1 EMA 50
1 EMA 100
Stochastic RSI
MACD
Rules
For long :close of the candle is above moving average 50, moving average 50> moving average 100, macd histogram is positive and cross over of stochastic rsi with the oversold level.
For short :close of the candle is below moving average 50, moving average 50 < moving average 100, macd histogram is negative and cross under of stochastic rsi with the overbought level.
Exit
For exit we have take profit and stop loss using fixed pip points.
For this example on EURUSD we use 20 pips for both tp and sl
IF you have any questions let me know !

Vortex HeikinThis indicator use macd crossover plus vortex and heikin candle to find the best spot entry.
There a lot to improve if you want, it's only a starting point.
You can change Vortex indicator with ADX indicator to find a better spot, but there could be more false entry.

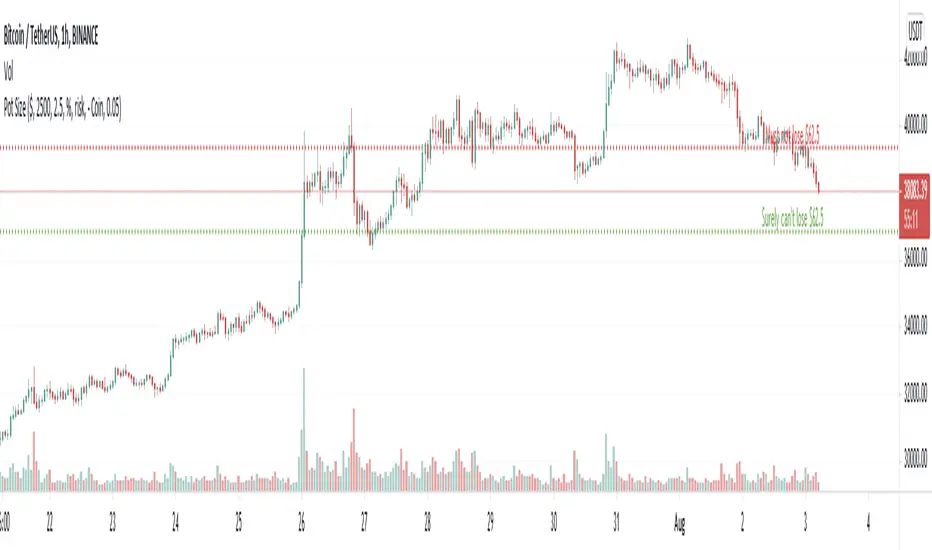
Pot SizeA little FREE script - which may help people set their trade size and stop levels for bitcoin trades.
NOTE :- This script conveys information that requires "indicator arguments" to be turned on.
TO USE :- To adjust to your requirements, click the cog wheel next to the indicator, and adjust "POT SIZE" (how much dollar you have), "RISK %" (the percentage of your dollar portfolio you would like to risk on this trade) and "BITCOIN AMOUNT" - until the short and long 'stop' lines are in the right place in your estimation, for a stop loss that represents the risk you want in relation to the current price for this trade.
The script takes its reference from the closing price; and doesn't include calculations for spread, fees, true range, and volatility etc. That is left open for anyone to add that if they wish. Anyone using this has to make their own adjustments for such considerations not being in this script and therefore make their own compensations.
Anyone wanting to change anything (because values don't go far enough for you) but doesn't know pinescript, can change the numbers next to "defval", "minval", "maxval", and "step" to their suiting in the script itself.
If you use this, you have to work out for yourself if it is useful for you or not. If you depend on it, you must have your own confidence that the calculations in it are acceptable and correct for your use, and you should check yourself and seek advice before trusting it. I convey no confidence in these calculations or this script, and they must be assumed to be acceptable by you if you use it.
Thanks
M
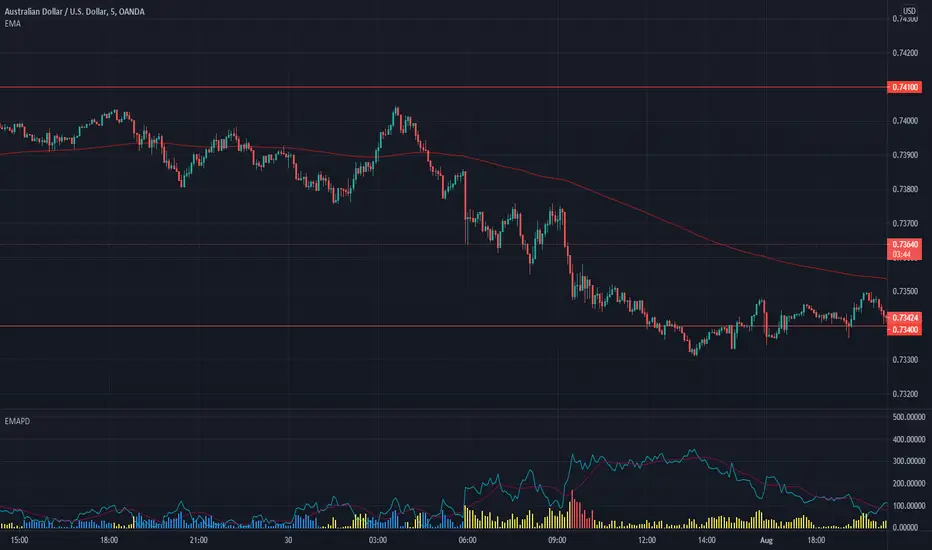
EMA Price DistanceEMA Price Distance, EMAPD for short, is a trend following indicator that can help you predict how price is going to move, in respect to your EMA. It can give overbought and oversold signals, as well as ranging market and retracement signals. The indicator consists of three parts, the Difference Line, the Average Line, and the Histograms.
- The blue line is the Difference Line. It is calculated from difference between the close price and the EMA. An increasing Difference Line indicates price moving further away from the EMA.
- The purple line is the Average Line. It is calculated based on the average of the difference Line for a certain lookback period.
- The Histograms are the difference between the Difference Line and the Average Line
Some basic signals:
- The easiest signal to spot is when the Difference Line is further away from the Average Line than normal. This usually signifies a retracement in the near future.
- Another signal is when the histograms are making smaller peaks or troughs, approaching 0. Signifies that price is retracing towards EMA. This can also be seen when the Difference Line is below the Average Line
How to Use:
The first use case is to detect when the market is ranging. This can be seen when both lines near 0 like so:
Another use case, is to use the indicator to signify how strong the current trend is / how likely it is to continue. This is signified by the Difference Line and Average line making higher highs
We can see that as the trend continues, both lines increase in harmony.
EMAPD can also be used to give easy to see signs of retracement or reversal.
Here we can see that the Difference line made a lower high as well as crossed below the Average Line. Whether this is a retracement or reversal usually depends on how the long the trend has occurred. The longer, the more likely of a trend reversal
One of the best use cases is to keep you out of bad trades. This usually happens right before a trend starts, when the market is choppier. This is when you usually get a lot of fake outs and false signals.
Here are 2 examples of where someone trading Supply and Demand would've been kept out of a losing trade.
In the first purple oval, a supply zone is formed. As price re enters the zone, it would be tempting to go long but the EMAPD is creating lower lowers on the histograms, signifying that price is moving closer to its average instead of expanding. We also get the Difference Line to cross under the average line, signifying price is moving closer to the EMA than it has been recently. These signals tell us that price has a good chance to "re group" with the EMA, which it ends up doing.
This also kept us out of the second trade, signified by the second purple oval. Here, we can see the difference line creating lower lows, signaling that price is moving closer to the EMA.
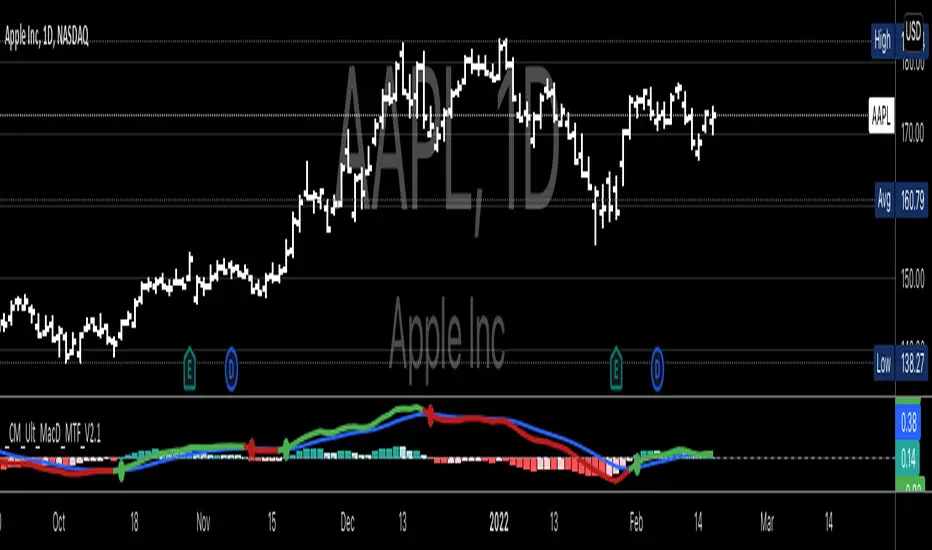
CM MACD Custom Indicator - Multiple Time Frame - V2***For a Detailed Video Overview Showing all of the Settings...
Click HERE to View Video
New _CM_MacD_Ult_MTF _V2 Update 07-28-2021
Thanks to @SKTennis for help in Updating code to V2
Added Groups to Settings Pane.
Added Color Plots to Settings Pane
Switched MTF Logic to turn ON/OFF automatically w/ TradingView's Built in Feature
Updated Color Transparency plots to work in future update
Added Ability to Turn ON/OFF Show MacD & Signal Line
Added Ability to Turn ON/OFF Show Histogram
Added Ability to Change MACD Line Colors Based on Trend
Added Ability to Highlight Price Bars Based on Trend
Added Alerts to Settings Pane.
Customized how Alerts work. Must keep Checked in Settings Pane, and When you go to Alerts Panel, Change Symbol to Indicator (CM_Ult_MacD_MTF_V2)
Customized Alerts to Show Symbol, TimeFrame, Closing Price, MACD Crosses Up & MACD Crosses Down Signals in Alert
Alerts are Pre-Set to only Alert on Bar Close
See Video for Detailed Overview
New Updates Coming Soon!!!
***Please Post Feedback and Any Feature Requests in the Comments Section Below***
Chaikin Money Flow + MACD + ATRHere I present you on of Trade Pro's Trading Idea: Chaikin Money Flow + MACD + ATR.
This strategy is not as profitable as it can be seen in one of his videos. In the forex market, the strategy could reach a maximum of 35% profitability.
I have, as some of my followers have requested, created an overview of the current position, risk and leverage settings in the form of a table.
Furthermore, one can again swap between short and long positions.
It is now possible to select or deselect individual indicators.
I have chosen the ATR alone as a take profit stop loss, as in his strategy.
A position is only triggered as soon as all prerequisites have been fulfilled and a command is executed. This prevents false triggering by bots and repainting.
-----------------------------------------------------------------------------------
How does the strategy work?
ENTRY
Long
The MACD indicator must be above the zero line.
Then the K line must cross the D line.
Finally, when this happens, the Money Flow Index must be above the zero line.
Short
Contrary to the premise of long positions.
EXIT
ATR Exit
The value of ATR at the time of buying is multiplied by the value entered in "Profit factor ATR" and "Stop factor ATR". As soon as the price reaches this value, it is closed.
Important
The script must be optimized for each coin or currency pair.
I will publish a guide to the strategy shortly. There I will explain how the table works and how to set the strategy correctly.
The results of the strategy are without commissions and leverage.
If you have any questions or feedback, please let me know in the comments.

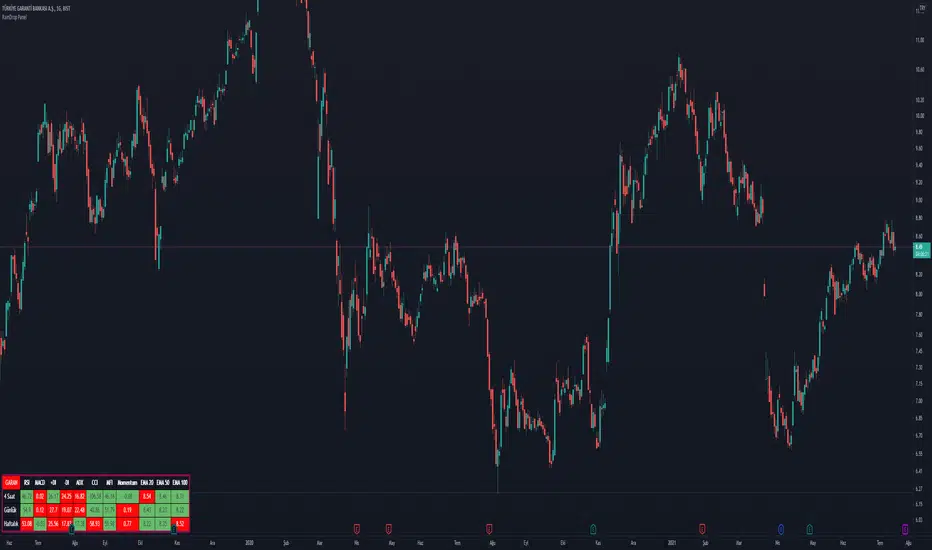
RainDrop PanelHi everyone,
This script shows the Dashboard in a Table. Table.new() is a new feature and released today! Big thanks to Pine Team for adding this great new feature!
This new feature changes the rules of the game! The script shows 3 different time period indicator values for the icon and changes the background color of each cell using the current and last values of the indicators for the icon. The background color is green if the current value is greater than the last value, red if it is less than the last value, and gray if it is equal. You can select the time periods and Indicators to be displayed. You can also change the position, font sizes, title and text colors of the relevant panel on the graphic. The number of columns in the table is dynamic and changes according to the number of indicators. You can choose 1 Symbol, 3 different timeframes, 6 Indicators and 4 Simple or Exponential Moving Averages, specify the type and length of moving averages. You can also set the lengths for each Indicator. Indicators: - RSI – MACD - DMI (+DI and -DI + and ADX) - CCI - MFI - Push - EMA Length 20 (length adjustable) - EMA Length 50 (length adjustable) EMA Length 100 (length adjustable) - EMA Length 200 (length adjustable)
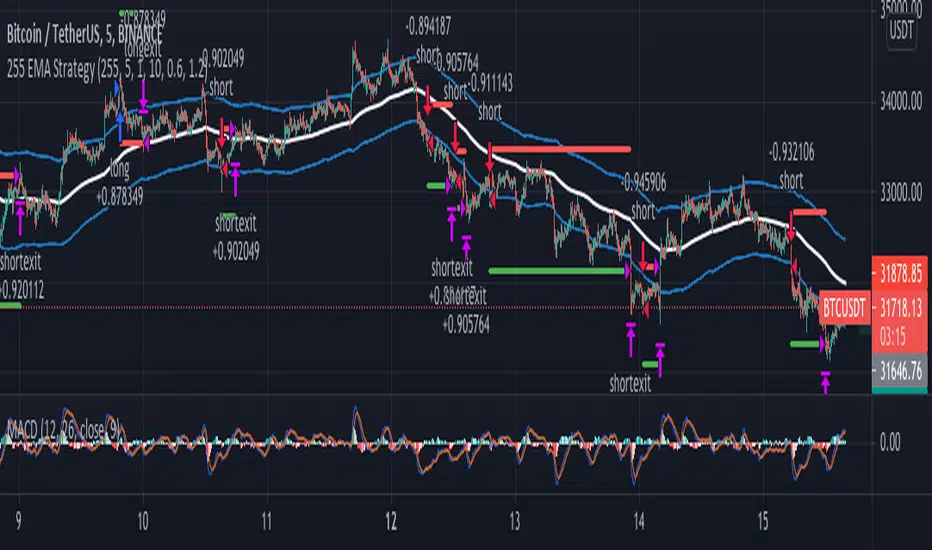
255 EMA Strategy//--- From 15 Trading Examples by Trader Alyx ---
// Seems like this strategy works better if we reverse the EMA filter logic.
// "Description: This basic scalping strategy allows you to enter the market based upon sentiment
// provided by the EMA, set at 255 periods. When price is trading below the 255 EMA, you would
// look to enter a LONG BUY positions, and when price is trading above the 255 EMA, you would
// look to enter a SELL SHORT position. The MACD lagging indicator will show you clear signals for
// when to do this. When the MACD lines cross in a bullish manner and price is below the 255
// EMA, buy. When the MACD lines cross in a bearish manner and price is above the 255 EMA,
// sell.
// NOTE: Make sure that price is trading away from the 255EMA before entering a LONG or SHORT
// position. As you can see in the chart below, the clearest signs for trade entry were presented
// when price was trading AWAY from the 255EMA"
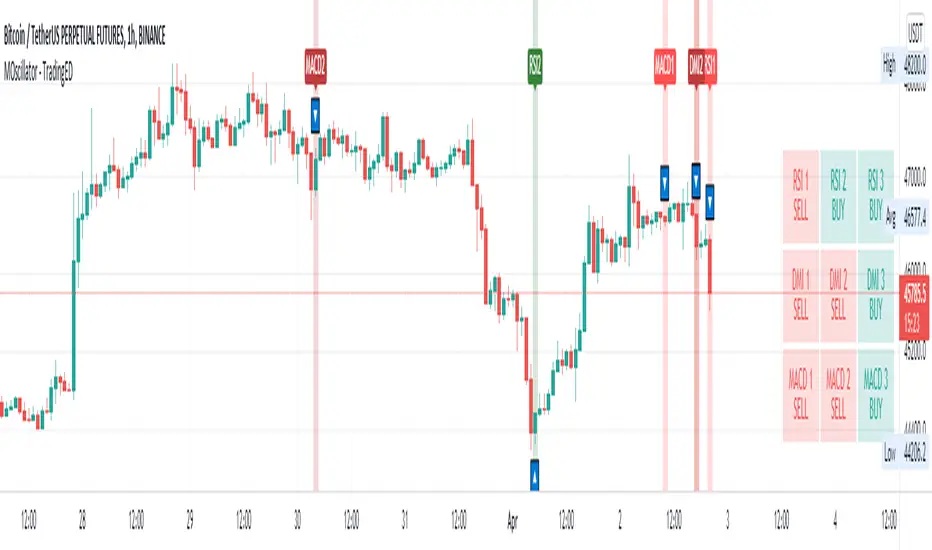
Multiple Oscillator Crossing - TradingEDThis case study is based on different previous studies: ADX Triple , MACD Triple & RSI Triple , with three different counts to compare different oscillations of each indicator. Actually, this indicator is complementary to those previously mentioned . The use of this indicator is restricted to private use, and it can be used only by invitation. Different functionalities have been added to the original codes, such as alerts and signals that seek to make trading much easier to interpret by any type of trading operator of any experience level , from beginner to intermediate and advanced .
Key components of the original ADX indicator:
• The DIRECTIONAL MOVEMENT INDEX (DMI) is a technical indicator that measures both the strength and direction of a price movement and is intended to reduce false signals.
• The DMI uses two standard indicators, one negative ( -DI ) and one positive ( +DI ), in conjunction with a third, the AVERAGE DIRECTIONAL INDEX ( ADX ), which is non-directional but shows momentum.
• The larger the spread between the two primary lines, the stronger the price trend. If +DI is way above -DI the price trend is strongly up. If -DI is way above +DI then the price trend is strongly down.
• ADX measures the strength of the trend, either up or down; a reading above 20 indicates a strong trend.
ADX is plotted as a single line with values ranging from a low of zero to a high of 100. ADX is non-directional; it registers trend strength whether price is trending up or down. The indicator is usually plotted in the same window as the two DMI lines, from which ADX is derived. When +DI is above -DI, there is more upward pressure than downward pressure in the price. Conversely, if -DI is above +DI, then there is more downward pressure on the price. This indicator may help traders assess the trend direction. Crossovers between the lines are also sometimes used as trade signals to buy or sell, theay are the main trade signals. A long trade is taken when the +DI crosses above the -DI and an uptrend could be underway. Meanwhile, a sell signal occurs when the +DI instead crosses below the -DI.
Key components of the original RSI indicator:
● The Relative Strength Index ( RSI ) is a popular momentum oscillator developed in 1978.
● The RSI provides technical traders signals about bullish and bearish price momentum, and it is often plotted beneath the graph of an asset's price.
● An asset is usually considered overbought when the RSI is above 70% and oversold when it is below 30%.
It is a momentum indicator used in technical analysis that measures the magnitude of recent price changes to assess overbought or oversold conditions in the price of an asset. The RSI is displayed as an oscillator (a line chart moving between two extremes) and can read from 0 to 100. Overbought does not necessarily mean that the price will reverse lower, just as oversold does not mean that the price will reverse higher. Rather, the overbought and oversold conditions simply alert traders that the RSI is near the extremes of its recent readings.
Key components of the original MACD indicator:
● The Moving Average Convergence Divergence ( MACD ) is calculated by subtracting a long period (26) Exponential Moving Average ( EMA ) from a short (12) period EMA .
● MACD triggers technical signals when it crosses above (to buy) or below (to sell) its signal line.
● The speed of crossovers is also taken as a signal of a market is overbought or oversold.
● MACD helps traders to understand whether the bullish or bearish movement in the price is strengthening or weakening.
It is a momentum indicator that follows the trend and shows the relationship between two moving averages of the price of a security. It can function as a trigger for buy and sell signals, when you cross above (to buy) or below (to sell) your signal line. It helps to understand if the movement is bullish or bearish , if it is getting stronger or weaker. The further the MACD is above or below its baseline, it indicates that the distance between the two EMAs will be growing, often shown with a histogram that graphically represents the distance between the MACD and its signal line, and It is used to identify when the bullish or bearish momentum.
Main functions of this modified indicator:
1) The SOURCE for the counts can be determined by the trader (close, open, etc).
2) In some cases, you can select the type of MOVING AVERAGE , among many available options ( SMA , EMA , DEMA , HMA , etc.)
3) The MEASURE can be based on a CANDLES count if you are trading OHLC Charts from 1D onwards , or if your trading is intraday, you can also select counts by MINUTES , HOURS or DAYS , depending on your trading style.
4) LENGTH , by default it will be loaded as in the STRATEGY , but considering the previous point, you can modify it according to your convenience.
5) You have the option to hide or show a LABEL at the top of the chart, with respect to the signals: BULLISH green, BEARISH red. *
6) You have the option to hide or show INDICATORS or SIGNALS based on EACH OSCILLATION .
Main performance functions of this modified indicator:
I) In the case of the PERFORMANCE that appears at the right of the chart, you have the option to adjust the WIDTH of each box.
II) The TEXT of the PERFORMANCE is not modifiable, but you can customize the default color. *
III) The BACKGROUND of the PERFORMANCE , you can customize the default color. *
IV) You have the option to hide or show a PERFORMANCE that appears at the right of the chart.
Main functions to customize the style of this indicator:
a) For any type of SIGNAL , it is painted as a VERTICAL LINE in the graph, you can change the color that comes by default. *
b) In the case of the LABELS that appear at the top, the text is not modifiable, but you can customize both the type of label and change the default color. *
c) When you have a SHORT SIGNAL or a LONG SIGNAL , you can change the EMOTICON that comes by default. **
* By default, they are marked as red for downtrends and green for uptrends.
** By default, they are marked with an emoticon indicating the possible direction of the price, down if it is bearish or up if it is bullish .
Iceberg Intraday LearningHOW TO USE?
A setup which contains Most Useful 14 indicators, that any Intraday Trader might require.
Below will see one by one-
1) Trend Following Icebergs - (3 Different Indicators to choose from)
--> The trend following indicators optionally.
--> Very simple to understand, yellow indicating sideways, green - going upside, and red - going downside.
--> Trend Indicator - 1st Iceberg is HMA Crossovers
--> Trend Indicator - 2nd Iceberg is SMA (20). It will change its color according to the trend of the market.
--> Trend Indicator - 3rd Iceberg is RSI(14) in EMA, will be plotted at the bottom of the screen.
2) Classic Pivot Points & Floor Pivot Points: - ( 2 Different Indicators to choose from )
--> Classic Pivot Points having 5 Supports & Resistances on the chart.
--> Floor Pivot Points, At the middle, it is pivot point (PP) level and multiple support and resistance levels
--> Floor Pivot Points is a very known indicator that indicates whether that helps in-stock selection.
--> This is a very crucial indicator as it shows the Floor Pivot Points levels for the next day.
--> One can make a learn by looking at next day's Floor Pivot Points that whether the stock is going to be trendy/sideways the next day.
3) Support/Resistance
--> This indicator is used for finding support and resistance levels on charts.
--> Helps in getting pullbacks and exit levels
--> Lines will change color automatically if any candle closes above the support/resistance line. It will change it's to green.
--> Similarly, it will change its color to red if the price is below the support
4) Highs/lows, SuperTrend Up Down ( 2 Different indicators to use )
--> Plots Highs / Lows in the selected time frame.
--> Added SuperTrend indicator with length 10 with source HL/2 and multiplier to be 2.
5) Dynamic ATR - Average True Range (14 Days)
--> It plots 2 important levels at the starting of the day.
--> 2 bands are plotted in the morning when the market opens, resembling strong support/resistance zones.
6) First Candle
--> This will highlight the first candle that is formed of the selected time interval.
7) Bollinger Band
--> Bollinger band is also added for better catching the momentum as seen on chart.
--> The Upper and Lower Bands are used as a way to measure volatility by watching the relationship between the Bands and price
8) VWAP
--> VWAP is useful for learning trend direction in any market conditions.
9) RSI & MACD
--> Plots label indicating the status of RSI and MACD.
This works for Intraday Trades - when the resolution is kept to less than 1 hour ( Say 3 , 5 , 10 , 15 Mins), This works well when the resolution is kept to 1 Day - Good for Swing Trades spanning over a few days, This works well when the resolution is kept to 1 Day or Week - Good for Investments.
Trend Indicator - 3rd Iceberg Is a repainted based on the hybrid RSI Logic
Stop Loss - That should be done by following ones risk appetite , Ideally the open/close of the previous candle should be the stop loss for the buy/sell but everyone has their own Risk Management Strategies based on the capital deployed.
If you like it and find it useful or if you find a defect or bug , Please let us know in the comments .. that would encouraging !! for us to develop it further
Coded for learning INDIAN Markets.
CAUTION:: There could be scenarios when the breakout/breakdown candle is rejected , especially when it is long one
so it is always recommended to have a confirmation candle that open-closes above the breakout candle / open-closes below the breakdown candle.
Disclaimer: No Investment Advice Provided , You should always understand that P AST PERFORMANCE IS NOT NECESSARILY INDICATIVE OF FUTURE RESULTS.
Inspiring to learn the Pine making market learnings easier.
Thanks & Regards,
Iceberg Intraday Learning.

MC Pro | BMS V3Published 10 July 2021
MC Pro (Momentum Compressor) with Fast MACD
Detects buying selling momentum & consolidation
suitable for Swing & Day Trading.
Check settings option switch to FIFO setup.
Histogram
Green = Buying momentum firing up (good for swing trade)
Red = Pullback (Red below histogram line is Downtrend)
Pink = Rebound (good for bottom catch / FIFO trade)
Dots
Gray = Expansion (can fire up or fire down)
Light Blue = Low compression
Dark Blue = Medium compression
Purple = High compression (sideways consolidation)
Fast MACD & Signal line crossover Green dot & cross-down Purple dot

MACD hist divergence strategy with switch v2
sum Macd hist to compare their strength,the DIAMOND means total strength , if the strength divergence, the trend may change
Macd 面積比較力度, 鑽石代表總力度, 力度背離即可能發生反轉
for the bullish market, I will suggest you to close the sw of buying energy divergence ex:btc
對於大牛市會建議您將買點能量背離關掉ex 比特幣
this strategy only have long order by now
目前此策略只支援做多
按鈕簡介
switch info
1.macd 面積背離時價格是否有背離的開關
1.A divergence switch btw price and MACD hist
2.macd 快線下穿0軸賣出的選項
2. Once MACD fast_line crossunder 0 stop loss switch
3.the setting logic and method is like this
設定如下
A1. 大牛股 for bullish market
B1. 高勝率低利潤 for high winning rate but lower profit
C1 高頻適合小級別 for high frq trading, useful in low period
D1 極小級別 for extremeness low period

MACD ReLoadedA different approach to Gerald Appel's classical Moving Average Convergence Divergence.
Appel originaly set MACD with exponential moving averages.
In this version users can apply 11 different types of moving averages which they can benefit from their smoothness and vice versa sharpnesses...
Built in Moving Average type defaultly set as VAR but users can choose from 11 different Moving Average types like:
SMA : Simple Moving Average
EMA : Exponential Moving Average
WMA : Weighted Moving Average
DEMA : Double Exponential Moving Average
TMA : Triangular Moving Average
VAR : Variable Index Dynamic Moving Average a.k.a. VIDYA
WWMA : Welles Wilder's Moving Average
ZLEMA : Zero Lag Exponential Moving Average
TSF : True Strength Force
HULL : Hull Moving Average
TILL : Tillson T3 Moving Average
In shorter time frames backtest results shows us TILL, WWMA, VIDYA (VAR) could be used to overcome whipsaws because they have less numbers of signals.
In longer time frames like daily charts WMA, Volume Weighted MACD V2, and MACDAS and SMA are more accurate according to backtest results.
My interpretation of Buff Dormeier's Volume Weighted MACD V2:
Thomas Aspray's MACD: (MACDAS)

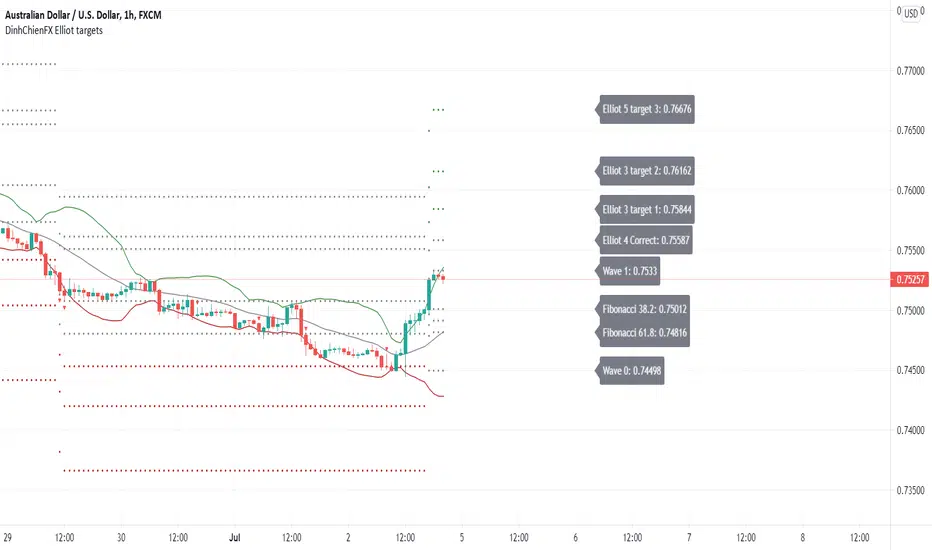
DinhChienFX Elliot targets 1.1We need to make things better and to solve the struggles of traders conquering this ventures capital arena.
I present my new Elliot targets script.
Anyone learning the Elliot wave is very difficult and difficult to understand.
I would like to take a few parts of the Elliot wave theory that is how to calculate the retracement area
and price levels according to the Fibonacci ratio of the Elliot wave. A Then combine the basic indicators Bollinger Band, MACD-H and RSI
to predict the future of the market. And try to automate the above.
The idea in the Elliot targets scenario is to combine:
+ Oscillators indicator (Rsi - Relative Strength Index)
+ Center Oscillators indicator (MACD - Moving Average convergence Divergence)
+ Volatility indicator (BB - Bollinger Band).
There are some option in the script, let see:
- Bollinger Band: calculates trend with signal combination from Bollinger Band indicator.
- RSI: calculates trend with signal combination from RSI.
- MACD: Main indicator of Elliot targets script, with option Histogram highest or lowest
in a week, a month, quarter, year depending on timeframe H1, H4 or Daily... I will show with pictures following photo.
- Label: Option to display the price notice board:
1 - Main bulletins board (default: off): showing all prices at Fibonacci levels (38.2, 50, 61.8, 161.8, 200, 261.8).
2 - Separate bulletin board for 2 trends (up - down): current price at Fibonacci levels (38.2, 50, 61.8, 161.8, 200, 261.8).
- Generate Alerts: 1. Uptrend triggered. 2. Downtrend activated.
Here are a few examples of how the editor uses the above indicators to predict goals:
- The signal is with only MACD:
- The signals combine MACD and Bollinger Band:
- The signals combine MACD and RSI:
- The signals combine MACD + Bollinger band + RSI:
* The label shows:
- Main label is at Uptrend:
- Main label is at Downtrend:
- The separate labels is at Uptrend:
- The separate labels is at Downtrend:
CryptoSignalScanner - MACD Multiple Time FramesDESCRIPTION:
After receiving some multiple request to provide a MACD indicator that displays multiple timeframes at the same time I created this simple script.
You can use this script for free and adjust it as much you like.
With this script you can plot 6 MACD lines & 6 Signal lines.
• Current Timeframe MACD Line
• Current Timeframe Signal Line
• 15 minute candle MACD Line
• 15 minute candle Signal Line
• 30 minute candle MACD Line
• 30 minute candle Signal Line
• 1 hour candle MACD Line
• 1 hour candle Signal Line
• 2 hour candle MACD Line
• 2 hour candle Signal Line
• 4 hour candle MACD Line
• 4 hour candle Signal Line
HOW TO USE:
• When multiple MACD lines on an uptrend are grouped together it is time to SELL.
• When multiple MACD lines on a downtrend are grouped together it is time to BUY.
• The higher to length of the MACD lines the stronger the BUY/SELL signal.
FEATURES:
• You can show/hide the preferred MACD lines.
• You can show/hide the preferred Signal lines.
How MACD works
The MACD indicator is generated by subtracting two exponential moving averages (EMAs) to create the main line (MACD line), which is then used to calculate another EMA that represents the signal line. In addition, there is the MACD histogram, which is calculated based on the differences between those two lines. The histogram, along with the other two lines, fluctuates above and below a center line, which is also known as the zero line.
The MACD indicator consists of three elements moving around the zero line:
• The MACD line. By default the MACD line is calculated by subtracting the 26-day EMA from the 12-day EMA.
MACD line = 12d EMA - 26d EMA
• The signal line. By default the signal line is calculated from a 9-day EMA of the MACD line.
Signal line = 9d EMA of MACD line
• Histogram. The histogram is nothing more than a visual record of the relative movements of the MACD line and the signal line.
It is simply calculated as: MACD line - signal line
REMARKS:
• This advice is NOT financial advice.
• We do not provide personal investment advice and we are not a qualified licensed investment advisor.
• All information found here, including any ideas, opinions, views, predictions, forecasts, commentaries, suggestions, or stock picks, expressed or implied herein, are for informational, entertainment or educational purposes only and should not be construed as personal investment advice.
• We will not and cannot be held liable for any actions you take as a result of anything you read here.
• We only provide this information to help you make a better decision.
• While the information provided is believed to be accurate, it may include errors or inaccuracies.
Good Luck,
SEOCO

Micro MACDMicro version of the MACD
Positioning
ATR - uses ATR to position indicator 1.5x above high of the Nth bar (needs improvement)
Absolute - allows you to specify the zero line position using price on the chart.

[Sidders] MACDEMASAR IndicatorCame across a cool idea for a strategy that couldn't find in the indicator database, so decided to code it up myself for your pleasure.
Indicators consists of 3 indicators: EMA(200) to determine the overall trend, and the MACD & Parabolic SAR to determine entries (and exits).
Long entry contains 4 conditions and is generated when price is above the 200EMA (1), the MACD crosses above the signal line (2), while they are both below 0 line (3) and when the parabolic SAR is below the closing price of the bar (4).
Short entry is build up the same but in reverse: price is below the 200EMA(1), signal line crosses below the MACD line (2), while they are both above the 0 line (3) and when the parabolic SAR is above the closing price of the bar (4).
Place the stoploss on the parabolic SAR dot below/above the candle that created the signal. Profit target 1:1 risk:reward ratio, but can ofcourse be changed according to your risk apetite. Might add automatically drawn SL/TPs in a later update.
Concept behind the strategy should work on all timeframes, but will require proper backtesting. I think with additional filters the strategy can also be way more finetuned and profitable, personally haven't had the time yet to dive into that.
Have also added alerts for your convenience.
Enjoy!
