New RenaissancePrelim version of MACD long entry and exit with custom time frame selector. To do: Add Stoch and Stoch RSI criteria.Strategi Pine Script®oleh CranialNerve75
MACD 4H StrategyThis strategy is a basic example of using MACD AND the instrument must be found an appropriate timeframe (4H recommended) before being tested with.Strategi Pine Script®oleh acolyteeTelah dikemas kini 63
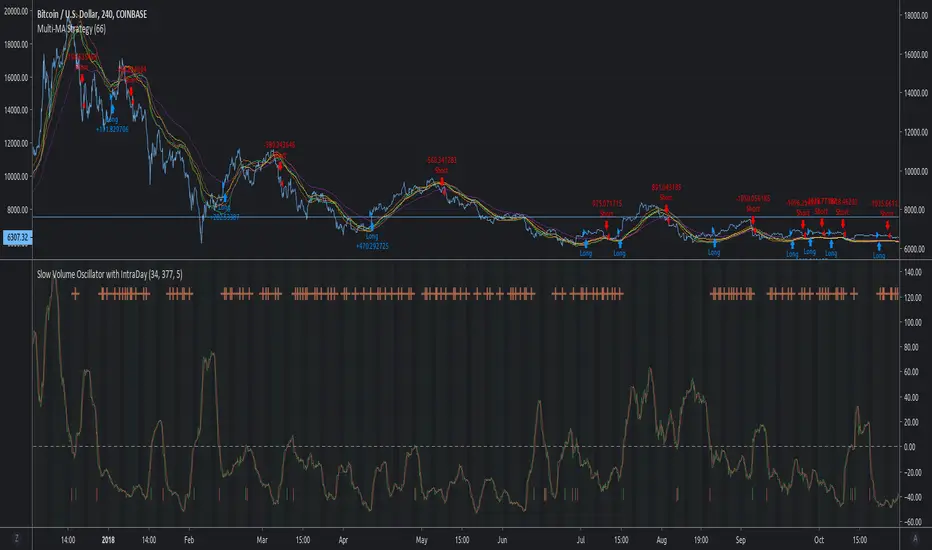
MACD Multi-MA StrategyThis script applies the average of each major MA (SMA, RMA, EMA, WVMA, WMA) to the MACD formula. The logic is simple. When all 5 MA's are in agreement in direction, then then script will notify users of change. I posted this as a strategy to help show how logic does in back test. If you use my simple yet effective solution to find take profit locations, you can blow this back testing out of the water!!! To set alerts simply turn script into study //@version=2 study(title="MACD Multi-MA Study", overlay=false) src = close len1 = input(8, "FAST LOOKBACK") len2 = input(144, "SLOW LOOKBACK") ///////////////////////////////////////////// length = len2-len1 ma = vwma(src, length) plot(ma, title="VWMA", color=lime) length1 = len2-len1 ma1 = rma(src, length1) plot(ma1, title="RMA", color=purple) length2 = len2-len1 ma2 = sma(src, length2) plot(ma2, title="SMA", color=red) length3 = len2-len1 ma3 = wma(src, length3) plot(ma3, title="WMA", color=orange) length4 = len2-len1 ma4 = ema(src, length4) plot(ma4, title="EMA", color=yellow) long = ma > ma and ma1 > ma1 and ma2 > ma2 and ma3 > ma3 and ma4 > ma4 short = ma < ma and ma1 < ma1 and ma2 < ma2 and ma3 < ma3 and ma4 < ma4 alertcondition(long == true, title='MACD LONG SIGNAL', message='MACD LONG!') alertcondition(short == true, title='MACD SHORT SIGNAL', message='MACD SHORT!') Strategi Pine Script®oleh Craig_ClaussenTelah dikemas kini 1313692
EVWMA VWAP MACD Strategy [QuantNomad]Based on comment of @coondawg71 I tried to compare VWAP and EVWMA. Both are sort of moving averages so I decided to create a MACD based on these 2 indicators. In parameters you can set EVWMA Length and 2 smoothing lengths for "macd" and "signal". Strategy seems to work pretty good at 2h-8h timeframes for crypto. What do you thing about it? Strategi Pine Script®oleh QuantNomad2222 3.5 K
QuantNomad - EVWMA MACD StrategyPretty simple EVWMA (Elastic Volume Weighted Moving Average ) MACD Strategy. EVWMA is a quite interesting moving average where the period of the MA is defined from the volume itself. It incorporates volume information in a natural and logical way. The EVWMA can be looked at as an approximation to the average price paid per share. As a volume period, you can use sum of the last x bars volumes. Here are other EVWMA indicators/strategies: EVWMA indicator: EVWMA Cross strategy: Strategi Pine Script®oleh QuantNomad11363
Histogram Trends Strategy by SedkurThis gives to you buy-sell signal with MACD's histogram trends. Use "Fast and Slow length" and "Trend of Histogram Number" inputs to take less or more signal. "Trend of Histogram Number" : This means how many histogram bars the trend continues before trading. Strategi Pine Script®oleh sedatkurbanTelah dikemas kini 44392
MACD Strategy by SedkurThis gives to you buy-sell signal with MACD histogram value. Use "Fast and Slow length" and "Buy or Sell Histogram Value" inputs to take less or more signal. Strategi Pine Script®oleh sedatkurban22135
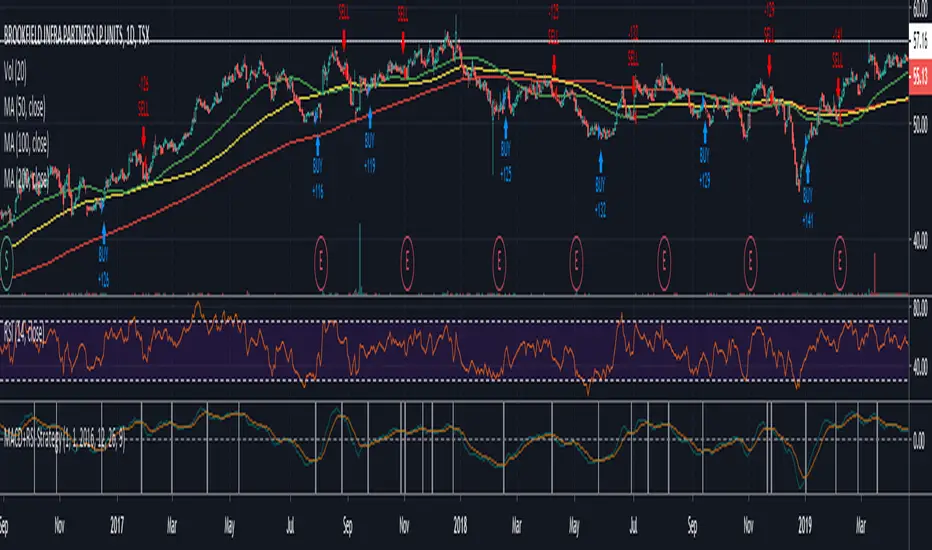
Easy to Use MACD+RSI Strategy BEGINNERS REJOICE! Easy to use strategy test using MACD with RSI as a confirming indicator. The code is structured to make it easy to manipulate the variables to your choosing. EASY TO CHANGE CODE VARIABLES LINE 2 = Change the amount you invest every trade and the currency LINE 8/9/10 = Change the defval of each of these lines to backtest from a certain date LINE 16/17/18 = Change the MACD sensitivity by changing the defval on each line LINE 21 = Change the value after close toadjust the sensitivity of the RSI LINE 37/39 = Change/remove the < and > variables for macdLine and rsivalue after the crossover/crossunder to adjust your buying point further. As a beginner you may not feel comfortable with shorting stocks, therefore LINE 5 was added to only allows long positions. Funny how a simple indicator can return such a high profitability. Couple this with some trend/exit strategies and you'll have something really special! Strategi Pine Script®oleh TrendsAreSexy1919 1.8 K
Trade Signal Ichimuko, Double Hull MA, Hourly Chart Lookup, MACDStrategi Pine Script®oleh YouDontSeeMe120
MACD BF 🚀Customised MACD strategy with dynamic stop losses based on ATR. Signals are generated when the delta value becomes positive or negative (when it crosses the zero line) Stop losses are printed on the chart in yellow and orange. They are based on recent average True Range to allow for volatility. INSTRUCTIONS Green background = long Red background = short Yellow dotted line = stop loss placement for long Orange dotted line = stop loss placement for short White background = you have been stopped out, wait patiently for the next signal Strategi Pine Script®oleh bennef55163
MACD Histogram BacktestTesting the trades signaled by the daily MACD histogram to see how they would have performed, compared to regular MACD Crosses. I'm going to take the 'List of trades' and analyse it seperately as some of the profit percentages seem a little off in the tradingview calculation, though it could just be my bad math! Hi CryptoLove :) Hope this helps your investigation RE: www.youtube.com Strategi Pine Script®oleh Biffy22221
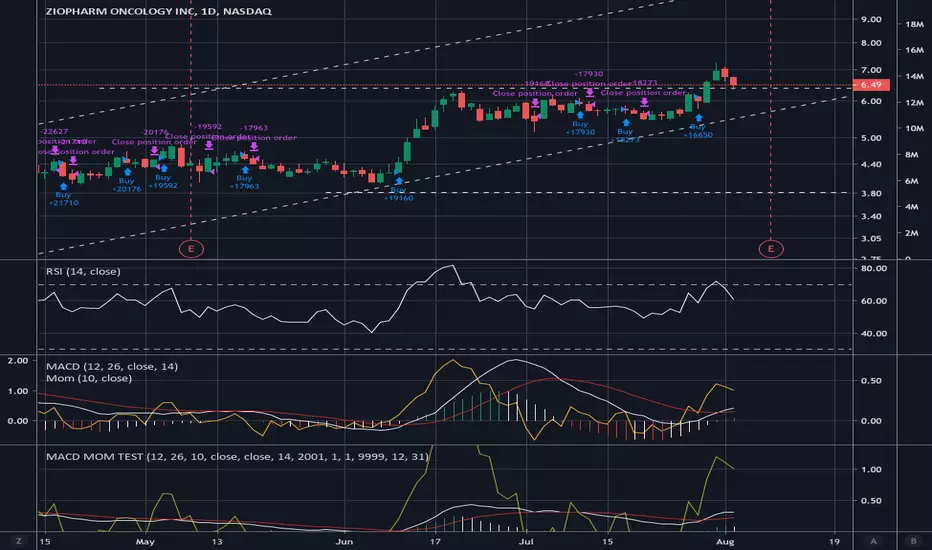
MACD MOMENTUM STRATEGYHey, First of I'm not so familiar with Pine Editor, yet. But a do need some help with a trick thing I*ve been working on. As you can see I*ve merge the MACD and the MOMENTUM indicators in the same "chart" this have been working pretty well for me as a trading strategy. But now a chat tho create a real strategy with Pine Editor based on the same data. The thing is that I can't seem tho get the MOMENTUM indicator to and the MACD indicator in the same (different) scale in my strategy as when I merge them. I suspect this got something to do with my chose of source för the MOMENTUM indicator, but I'm not 100. I would be grateful for all kinds of feedback and tips for a solutions on this. Thanks.Strategi Pine Script®oleh Sebastiansj11155
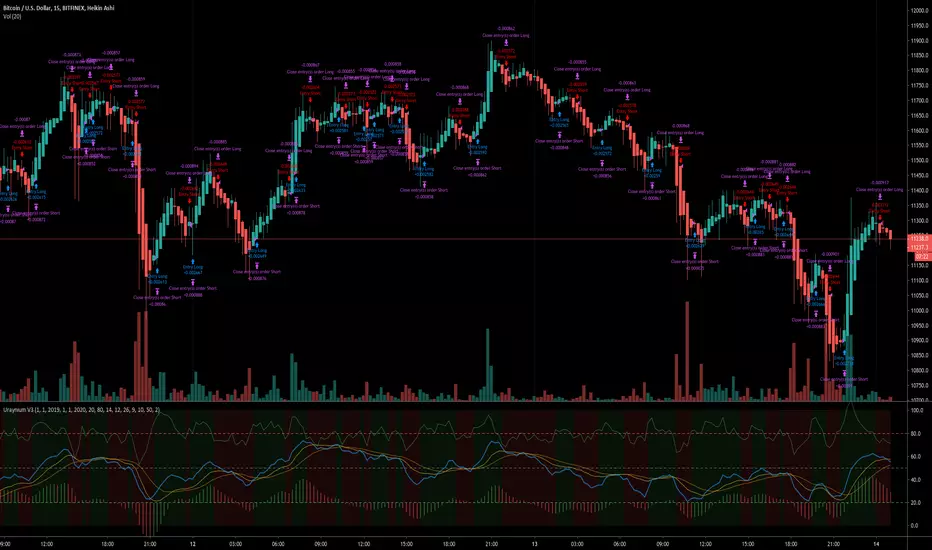
uray MACD margin trade strategysimple margin trading strategy based on MACD i.imgur.comStrategi Pine Script®oleh UrayMeiviar77
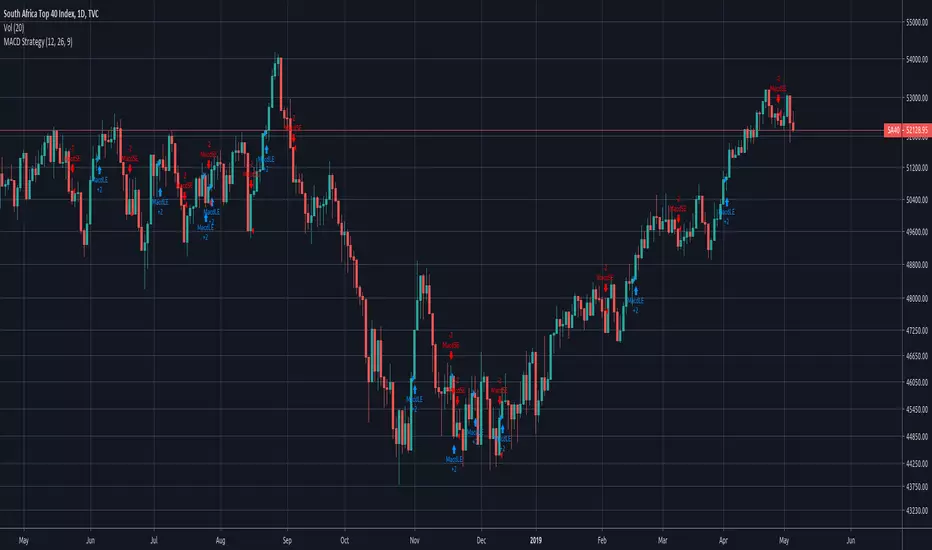
MACD Strategy by ForbesStrategy นี้เขียนขึ้นมาจากบทความของนิตยสารธุรกิจ ชื่อดัง Forbes สำหรับผู้ที่อยากอ่านสามารถค้นหาได้โดยใช้คำค้นว่า Bitcoin Trading Strategy For Passive Investors สำหรับผู้ทีจะทอสอบ backtest ให้ตั้งค่า commission (หรือค่าธรรมเนียมการเทรดด้วย) เพื่อให้ผลลัพท์ใกล้เคียงกับความเป็นจริงมากที่สุด อย่างไรก็ตามจากการ backtest นั้น พบว่า Strategy นี้เหมาะกับ Timeframe Day มากที่สุด และโดยส่วนตัวคิดว่าเหมาะสำหรับการซื้อขายแบบ Spot เท่านั้นStrategi Pine Script®oleh teejk19863399
MACD Strategy With HistogramCombines MACD strategy for backtesting with a plotted histogram and ordersStrategi Pine Script®oleh drew102177
MACD Strategy with HistogramThis combines a strategy for backtesting with a plotted MACD graph and ordersStrategi Pine Script®oleh drew10275
Simple MACD Strategy - CrossoverSimple MACD Crossover Strategy No secret sauce here! Script was requested by userStrategi Pine Script®oleh cgd184
MACD BFThis is a modified version of the MACD strategy in the public library. You can set the time period you want in the input parameters, along with the MACD and signal line values. The default values for this strategy are 12, 26, 12. These settings seem favorable to BTC/USD pairs. The strategy is simple - when the histogram crosses above zero, a buy signal is generated, when it crosses below zero, a sell signal is generated. If an opposing signal is generated, we exit the current trade and enter the new one. You can set a stop-loss as a percentage in the input parameters - for example, if you enter 5, the strategy will exit when the trade goes the wrong way by 5%. The default money management strategy is to trade 100% of the equity. This can be changed in input settings like it can with any strategy. Strategi Pine Script®oleh bennef55
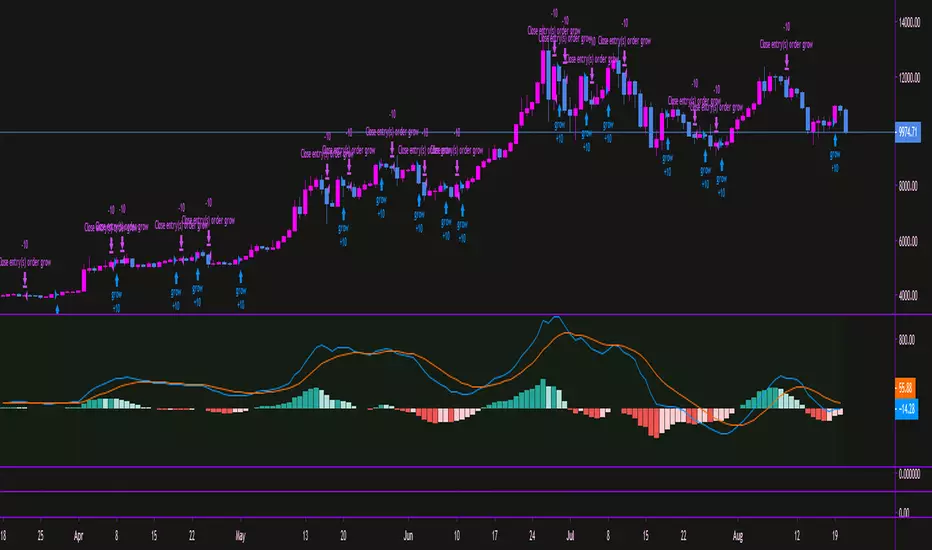
GBPJPY MACD 1min Long OnlyThis MACD indicator uses two lines for long and sell long. It also uses a MACD indicator line with a historian. When the MACD historian crosses over the buy line, a long signal is executed. When the MACD historian crosses over the sell line, a close entry is signal is executed. There is a also a built in stop loss and you can adjust the buy and sell lines accordingly. This does not repaint and I use it for autoview with an alert to autotrade this strategy.Strategi Pine Script®oleh Mackavelli78