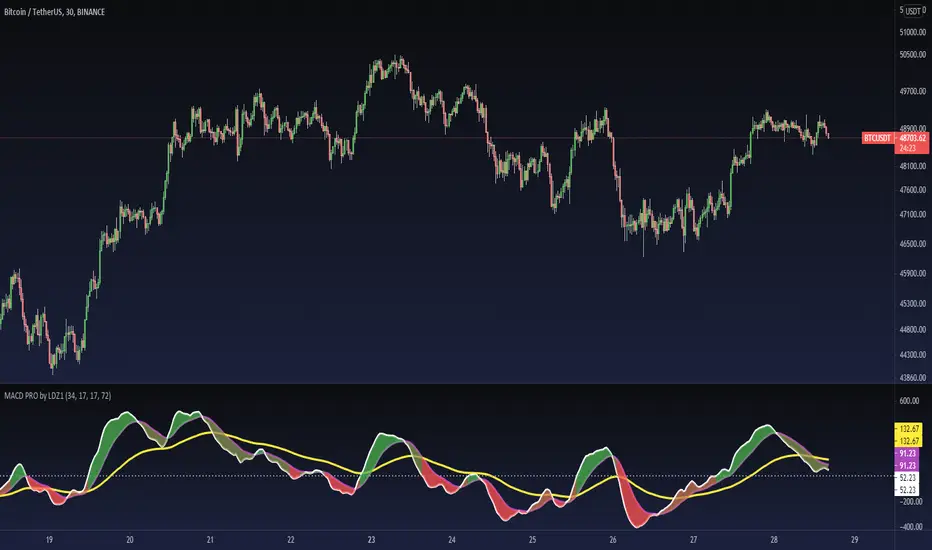
MACD PRO by LDZ1LANDZZ1 MACD Pro was developed to show the first signs of reversal, direction, and also trend strength.
Unlike normal MACD, this indicator has 3 lines as information. A white line (short EMA), a purple line (sign), and a yellow line (long EMA).
The Purple Line "Signal" is a 17-period Exponential Moving Average.
The White Line "Short EMA" is a 34-period Exponential Moving Average.
The Yellow Line "Long EMA" is a 72-Period Exponential Moving Average.
When the background color turns green it indicates that we are above 0 (positive trend) and above the Signal line (positive trend)
When the background color turns Yellow it indicates that we are above 0 (positive trend) but below the Signal line (Indicating Attention to a possible trend reversal or price correction)
When the background color turns Red it indicates that we are below 0 (negative trend) and below the Signal line (negative trend)
When the background color turns Orange it indicates that we are below 0 (negative trend) and above the signal line (Indicating attention to a possible trend reversal or price correction)
The Yellow line is like a watershed, when the White Line "Short EMA" crosses above or below it, it indicates that a stronger price movement may occur.
Tip:
Only enter Long Positions when the background color turns green and the Short EMA (White line) is above the yellow line and/or the white dotted horizontal line.
Only enter Short Positions when the background color turns red and the Long EMA (Yellow line) is below the white dotted horizontal line.
Note the difference of MACD Pro by LANDZZ1 as the traditional MACD.
----------------------------------------------------------
Description in Portuguese-BR
MACD Pro by LANDZZ1 foi desenvolvido para mostrar os primeiros sinais de reversão, direção e também força da tendência.
Diferente do MACD normal, este indicador tem como informação 3 linhas. Uma linha branca (short EMA), uma linha roxa(signal) e uma linha amarela (long EMA).
A Linha Roxa "Signal" é uma Média Móvel Exponencial de 17 períodos.
A Linha branca "Short EMA" é uma Média Móvel Exponencial de 34 períodos.
A Linha Amarela "Long EMA" é uma Média Móvel Exponencial de 72 Períodos.
Quando a cor de fundo ficar verde indica que estamos acima de 0 (tendência positiva) e acima da linha de Sinal (tendência positiva)
Quando a cor de fundo ficar Amarelo indica que estamos acima de 0 (tendência positiva) porém abaixo da linha de Sinal (Indicando Atenção a uma possível reversão de tendência ou correção de preço)
Quando a cor de fundo ficar vermelho indica que estamos abaixo de 0 (tendência negativa) e abaixo da linha de Sinal (tendência negativa)
Quando a cor de fundo ficar laranja indica que estamos abaixo de 0 (tendência negativa) e acima da linha de sinal (Indicando atenção a uma possível reversão de tendência ou correção do preço)
A linha amarela é como um divisor de águas, quando a linha branca (Short EMA) cruza para cima ou para baixo dela, indica que um movimento mais forte forte de preço poderá ocorrer.
Dica:
Apenas entre em Long Positions quando a cor de fundo ficar verde e se a Short EMA (linha Branca) estiver acima da linha amarela e/ou da linha horizontal pontilhada branca.
Apenas entre em Short Positions quando a cor de fundo ficar Vermelha e se a Long EMA (linha Amarela) estiver abaixo da linha horizontal pontilhada branca.
Repare a diferença do MACD Pro by LANDZZ1 como o MACD tradicional.
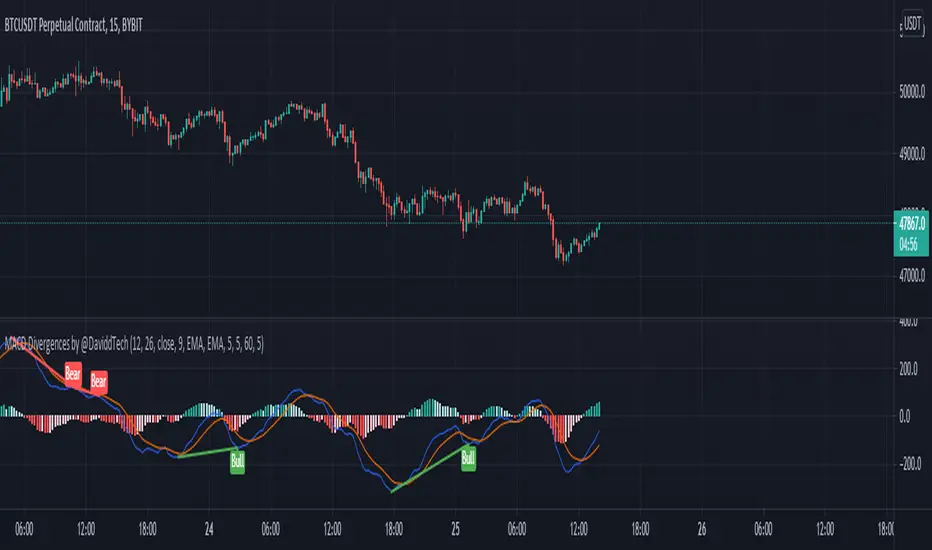
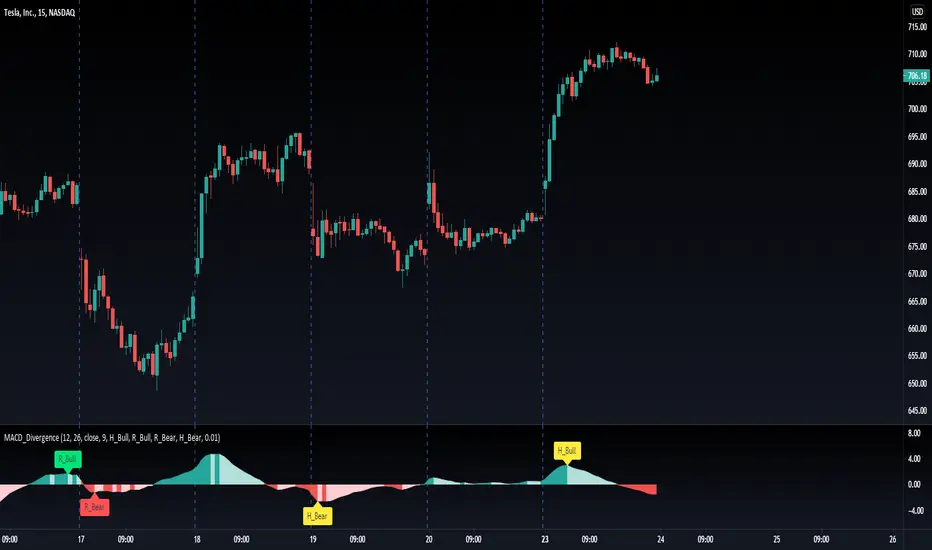
Macdivergence
MACD Divergences by @DaviddTechThis indicator helps find divergences in the MACD.
This uses the modification of the TV built-in "Divergence indicator" (Version 10) that I have applied to the MACD.
Usage:
Add the indicator to your chart and then watch for it to plot divergences.
MACD Divergence H/RHere's a fun script we been working on, let us know what you add!
Short-Forms Used
histogram(hist)--> value of macd Histogram
Low-Price--------> Candle's Low Price
High-Price-------> Candle's High Price
---------------------------------------------------------------------------------------------------------------------------------------------------------------------------------
-Regular_bulls =====> Lowest(red hist) in Previous red hists is > Lowest(red hist) in Current red hists
and Lowest(Low-price) in Previous red hists is < Lowest(Low-price) in Current red hists
and Lowest(red hist) in Previous red hists is < -Histograms Minimum Value Required
and Lowest(red hist) in Current red hists is < -Histograms Minimum Value Required
---------------------------------------------------------------------------------------------------------------------------------------------------------------------------------
-Hidden_bulls =====> Lowest(red hist) in Previous red hists is < Lowest(red hist) in Current red hists
and Lowest(Low-price) in Previous red hists is > Lowest(Low-price) in Current red hists
and Lowest(red hist) in Previous red hists is < -Histograms Minimum Value Required
and Lowest(red hist) in Current red hists is < -Histograms Minimum Value Required
-------------------------------------------------------------------------------------------------------------------------------------------------------------------------------
-Regular_Bears =====> Highest(Green hist) in Previous Green hists is < Highest(Green hist) in Current Green hists
and Highest(High-price) in Previous Green hists is > Highest(High-price) in Current Green hists
and Highest(Green hist) in Previous Green hists is > Histograms Minimum Value Required
and Highest(Green hist) in Current Green hists is > Histograms Minimum Value Required
--------------------------------------------------------------------------------------------------------------------------------------------------------------------------------
-Hidden_Bears =====> Highest(Green hist) in Previous Green hists is > Highest(Green hist) in Current Green hists
and Highest(High-price) in Previous Green hists is < Highest(High-price) in Current Green hists
and Highest(Green hist) in Previous Green hists is > Histograms Minimum Value Required
and Highest(Green hist) in Current Green hists is > Histograms Minimum Value Required
Please drop a like and comment :)
-Angel Algo
Ultimate MACD Strategy [PrismBot] [Lite]Included in this Ultimate MACD Lite Strategy:
✔️ Tweak a multitude of specific settings (MA lengths, R:R, SL distance etc)
✔️ Enable advanced setup filters
✔️ Use money management and risk calculations
✔️ Draw trade info directly to chart (eg. SL size in percent, win rate etc)
✔️ Use various filters (eg. time filter, date filter, MA slope angle etc)
✔️ Manage risk per position when auto-trading forex through AutoView
✔️ Choose from various alert conditions!
✔️ Sync to any bot or algorithmic trading system
Some details about this strategy:
LONG SIGNAL
When the MACD is below the zero line of the histogram, close is above the 200EMA, and the MACD line crosses above the signal line, longs are taken
SHORT SIGNAL
When the MACD is above the zero line of the histogram, close is below the 200EMA, and the MACD line crosses below the signal line, shorts are taken
A couple of options are given for how to calculator stop losses.
The Take profit is calculated by the risk of the stop loss. So a 1.5 take profit target is 1.5 times the stop loss added to the entry price.
There is also an option to filter out trades by the histogram deviation. This prevents crossovers that are too close to the histogram from being taken.
Please note I used the code for the PPO instead of the traditional MACD to make calculating these percentage deviations more consistent across multiple asset types.
You can easily enable and disable strategies using the checkbox.
This strategy incorporates a risk to reward system where the user can select between ATR and Percent based stop losses and take profit targets. This means that the user has much better control over money management when utilizing this strategy and it doesn't require you to babysit the strategy to ensure it's entering and existing strategies in an ideal place.
You can also enter custom messages for alerts for use with bots (set alerts to "alert() function calls only")

MACD-RSI With @LuckyNickVAMACD & RSi Confluence. Great for those who are looking for RSI & macd signals. Highlights volatility & structure points for entering & exiting the market. You have to understand market volatility to understand this concept. So please research more on those subjects before using. But The RSI is the relative strength index it helps you understand the increase in interest in price great for trend trading along with the momentum based indicator. Macd Developed by Gerald Appel, the Moving Average Convergence-Divergence, or MACD, is an oscillator that measures price momentum. The indicator also measures the strength, direction and duration of a trend. Forex traders can use the MACD to confirm an entry price or exit point.
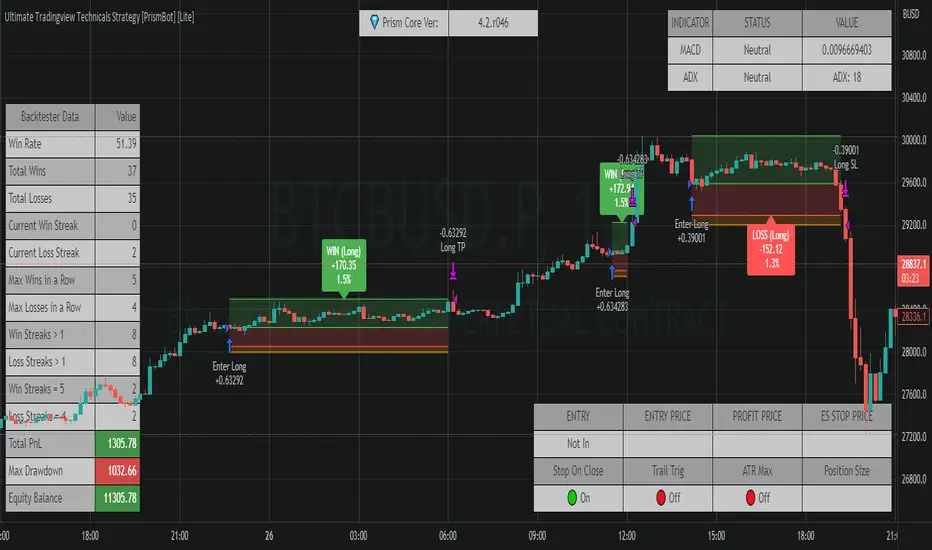
Ultimate Tradingview Technicals Strategy [PrismBot] [Lite]Included in this builder:
MACD
RSI
Tradingview Technical Analysis
Ichimoku
Global Trend Filter
Pullback Filter
Our most robust strategy to date with MACD , RSI , and many other basic strategies included as well as additional filters and alert options.
It is an advanced trading strategy built with the intent to make it easy for anyone to begin trading, but also avoid too much complication of strategy concepts.
For instance, you can change the MACD settings to be "more sensitive" by using a simple dropdown menu, and adjust which strategy you are employing with the MACD on the fly with another.
You can easily enable and disable strategies using the checkbox.
The strategy demo results use 100% equity per trade as an example - the reason for this is that the stop loss is set to 1%, so each trade is risking 1% (give or take slippage). Slippage is set to 5 ticks, and a 0.04% commission (Binance average for market and limit orders)
This strategy incorporates a risk to reward system where the user can select between ATR and Percent based stop losses and take profit targets. This means that the user has much better control over money management when utilizing this strategy and it doesn't require you to babysit the strategy to ensure it's entering and existing strategies in an ideal place.
The status box shows the current state of the various strategies and their values. A red circle indicates the filter / strategy is not valid for entry yet. A green circle indicates that filter / strategy is valid for entry. When all selected strategies are valid simultaneously, the next bar will trigger an entry signal.
If you have any questions about this strategy, please leave them in the comments below, or DM for more details. Thanks!
Additional features in this lite strategy:
✔️ Tweak a multitude of specific settings (MA lengths, R:R, SL distance etc)
✔️ Use money management and risk calculations
✔️ Draw trade info directly to chart (eg. SL size in percent, win rate etc)
✔️ Use various filters (eg. time filter, date filter etc)
✔️ Manage risk per position
✔️ Sync to any bot or algorithmic trading system
CryptoSignalScanner - MACD Multiple Time FramesDESCRIPTION:
After receiving some multiple request to provide a MACD indicator that displays multiple timeframes at the same time I created this simple script.
You can use this script for free and adjust it as much you like.
With this script you can plot 6 MACD lines & 6 Signal lines.
• Current Timeframe MACD Line
• Current Timeframe Signal Line
• 15 minute candle MACD Line
• 15 minute candle Signal Line
• 30 minute candle MACD Line
• 30 minute candle Signal Line
• 1 hour candle MACD Line
• 1 hour candle Signal Line
• 2 hour candle MACD Line
• 2 hour candle Signal Line
• 4 hour candle MACD Line
• 4 hour candle Signal Line
HOW TO USE:
• When multiple MACD lines on an uptrend are grouped together it is time to SELL.
• When multiple MACD lines on a downtrend are grouped together it is time to BUY.
• The higher to length of the MACD lines the stronger the BUY/SELL signal.
FEATURES:
• You can show/hide the preferred MACD lines.
• You can show/hide the preferred Signal lines.
How MACD works
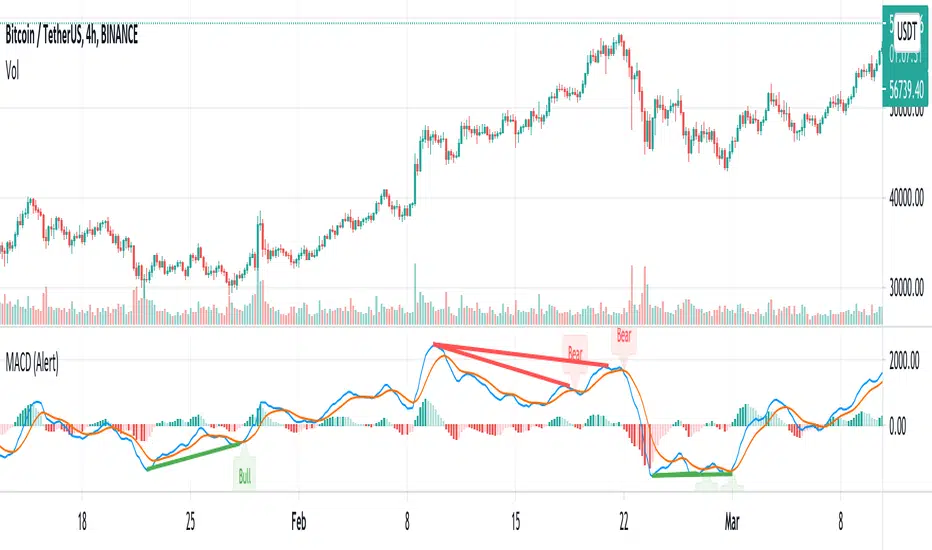
The MACD indicator is generated by subtracting two exponential moving averages (EMAs) to create the main line (MACD line), which is then used to calculate another EMA that represents the signal line. In addition, there is the MACD histogram, which is calculated based on the differences between those two lines. The histogram, along with the other two lines, fluctuates above and below a center line, which is also known as the zero line.
The MACD indicator consists of three elements moving around the zero line:
• The MACD line. By default the MACD line is calculated by subtracting the 26-day EMA from the 12-day EMA.
MACD line = 12d EMA - 26d EMA
• The signal line. By default the signal line is calculated from a 9-day EMA of the MACD line.
Signal line = 9d EMA of MACD line
• Histogram. The histogram is nothing more than a visual record of the relative movements of the MACD line and the signal line.
It is simply calculated as: MACD line - signal line
REMARKS:
• This advice is NOT financial advice.
• We do not provide personal investment advice and we are not a qualified licensed investment advisor.
• All information found here, including any ideas, opinions, views, predictions, forecasts, commentaries, suggestions, or stock picks, expressed or implied herein, are for informational, entertainment or educational purposes only and should not be construed as personal investment advice.
• We will not and cannot be held liable for any actions you take as a result of anything you read here.
• We only provide this information to help you make a better decision.
• While the information provided is believed to be accurate, it may include errors or inaccuracies.
Good Luck,
SEOCO

MACD-RSI Confluence SimplifiedAnother simple version of the MACD RSi Confluence script. But this is one is more simplified with simple signals. Again to fully understand macd & RSI you should already have some type of knowledge of how they work. With understanding this script & it's signals are great for those who do. This script is based on Barcolor signals reflected by macd & RSI data
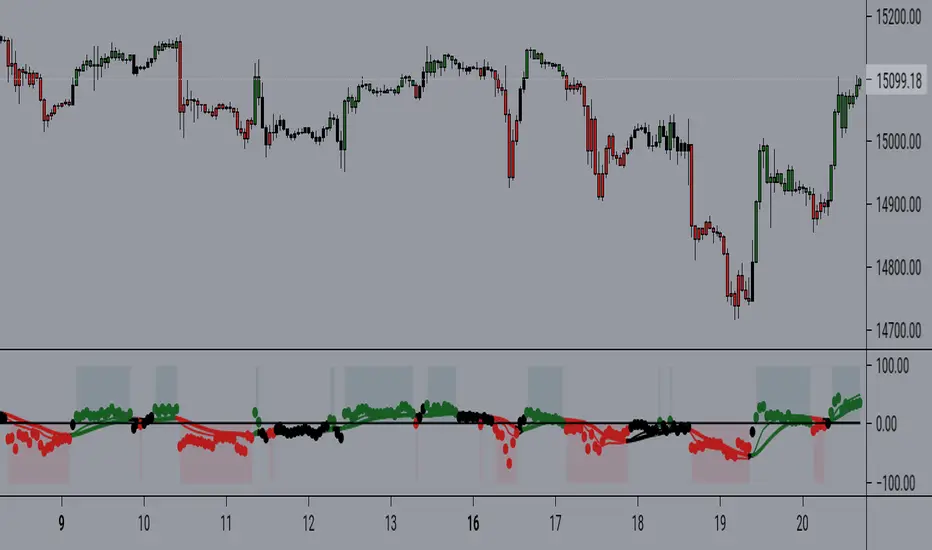
REDWOOD MTF MacD Stochastic RSIOne of out most premium indicators is this MTF MacD Stochastic RSI combo.
This is calculated with specific conditions to give the best signals for market reversals or continued trends.
=======
For a detailed description of how the REDWOOD MacD works, see profile (links of personal indicators arent posting for some reason)
For a detailed description of how the REDWOOD Stochastic RSI works, see profile
=======
These are both powerful indicators alone, but together they work very well together to confirm positions or see new entries or exits.
Without giving too much away on how it is made, this takes trades when the MacD is weak, with a confirming signal from the Stoch RSI
just the other way, it takes trades when the MacD is strong, and the Stoch RSI confirms trend.
This was made to reduce clutter of watching multiple indicators, while still giving you a chance to see what both indicators are doing and how they are flowing together.
Custom alerts are set so you never miss a trade opportunity! Get alerted on all reversals, strong signals, or even signals from the MacD or Stochastic RSI crosses!
This is a Multi Timeframe indicator so you can see what is happening on a long term time frame while trading short time frame bars, getting a better position in the market.
Best trades are when the alert or indicator is signaling, and the close of the MacD is about to happen on the MTF time frame set. All timeframes for both MacD and Stoch can be customized, and they do come with default settings.
Best MTF Time frames are longer timeframes (1hr, 4hr, D) but it can work well with current timeframe and lower timeframes (15min, 30min)
All settings for the MacD and Stoch are the same as the original, you can remove the MacD or histogram, remove or see crosses, and even color in pivot points in the MacD
~~~
Added feature is this indicator by default shows the MacD to tell you the overall trend, but you can uncheck the Show MacD setting to remove the MacD and check the Show Stoch RSI to have the indicator show you the Stoch RSI all in the same indicator! This is extremely useful to see where the Stoch RSI is at when the MacD is turning or pivoting. If the stoch is turning as well and overbought or oversold, it is a good time to enter or exit a position.
Dark Green is showing buy signals, and dark maroon is showing sell signals.
The coloring in the background (red, lime) is showing the trend we are riding and when the color goes away it is an indication of a possible trend reversal or dip coming. These are mostly used to confirm positions.
~~~
The timeframes I recommend would be the 4hr on both, althought it has proven to work well (if you want more signals) to have either the MacD or Stoch RSI on a higher timeframe and the opposite on a lower timeframe.
All plots and inputs can be customized to your own liking, and there is the option to color the bars with the Stoch RSI being overbought or oversold.
Best Trading Strategy : Enter positions according to the colors being alerted (green = buy, red = sell) when the FIRST is alerted. This is the ideal and best entry.
For safer trading you can wait for a second to confirm and enter there.
Trades can be taken on the shading colors too, trading on trend waves, although this is risky as some waves end abruptly. Best signals are as stated above.
This indicator works very well on its own but can work well along side our other indicators listed here :
Bishop MA's or MA Cloud with Fill
This can be a very useful indicator, and I'm sure some may find settings that work even better
than the default or recommended settings.
This indicator works on all markets, forex, cryptocurrency, and stocks.
For access to this and all indicators available, please DM me here or See profile.
We are here to help each other succeed! The more one succeeds the more we all succeed! We are all in this
together and every person deserves to be financially independent and confident when taking trades
and investing.

The best MACD line + MACD signal + MACD histogram DivergencesHi everyone,
Here is a script that synthesizes divergence signals from the MACD indicator, including 3 options:
- MACD divegence
- MACD signal divergence
- MACD histogram divergence
Scripts are used for learning and research purposes. THESE ARE NOT BUY/SELL SIGNALS.
If you have a better idea, share it here or contact me via msg. I will improve this script better in next version.
Settings:
Basically, you only need to care about 2 parameters:
- MACD Source: There are 3 options: macdLine, signLine and histLine.
- Lookback Level For Divs: Number of previously adjacent peak.
- Other parameters, you can research more
Feel free to use, share, comment & provide feedback.
Get indicator or strategy trading signals at yummyprofit.
Good luck!

MACD PIP HUNTERS 2.0This indicator allows you to see divergence of chart. it contains the PIP HUNTER's strategy.

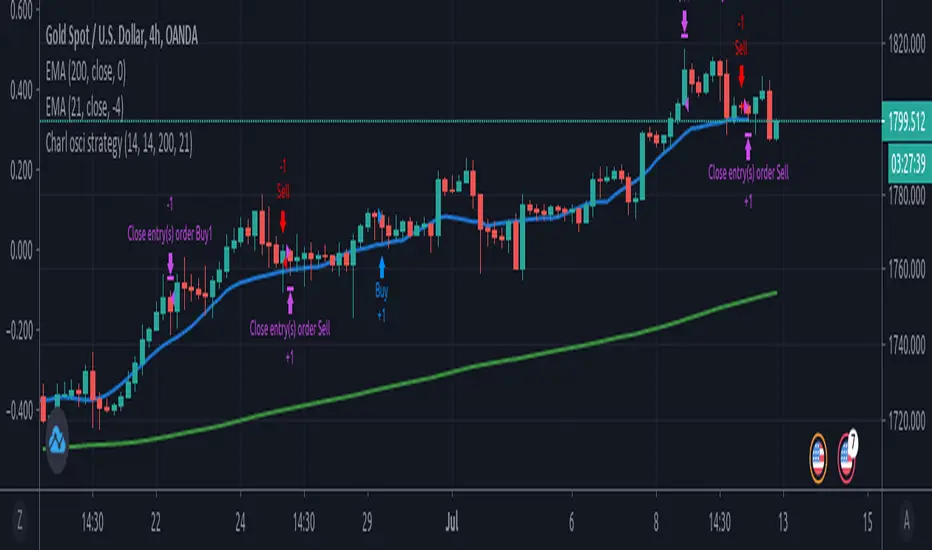
Charl osci strategyTrade trend continuation and reversal on forex, stocks and commodities.
Strategy uses RSI, MFI and macd divergence along with EMA.
MACD_trendtrader v2 (picte)This is an upgraded version of my MACD_trendtrader indicator.
UPGRADES:
- Histogram slope changes colors according to the direction of the slope.
- Panel that displays volatility of the asset. The volatility is measured from 0 to 100. Zero being the lowest and 100 the highest volatility. I also included different text colors for a certain volatility value (white= very low volatility, blue = low volatility, purple= high volatility, green= very high volatility)
It works well on all time-frames but i found it particularly useful on the lower time-frames for identifying pullbacks in a trending market.
It has been tested in the Forex and Traditional market.

McClellan Oscillator [CC]The McClellan Oscillator was created by Sherman and Marian McClellan and it is essentially a MACD of the advancing and declining symbols of the day and is best used as a comparison with the biggest stocks such as my example Apple but that is just my opinion. I pulled the symbol names from a Trading View blog so I'm not 100% sure if they are accurate so please let me know if I'm wrong. Buy when the indicator is over 0 and sell when it falls below 0 but keep in mind that these values are for the market itself and not the individual symbol.
This was a special request so let me know if you would like me to publish more scripts or if you want something custom done!
Note: I'm republishing this because the original script couldn't be found in searches so this will fix that.

Trendless MACD Strategy (Trendless Strategy Series -1 )I Try to eliminate the trend of the stock to see a clear version of the indicators. If you have any idea about that topic, you can send a message to me and we can improve this idea together.

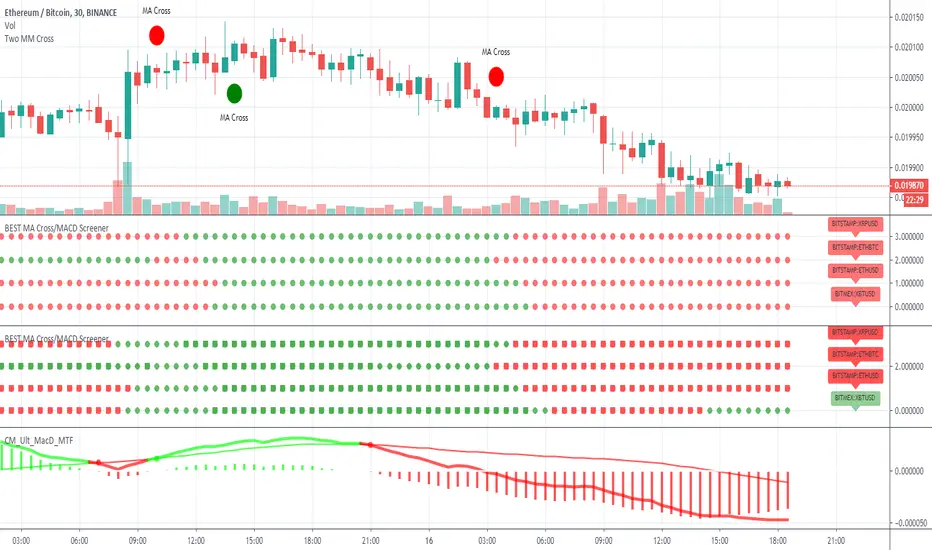
BEST MA Cross/MACD ScreenerHello traders
Continuing deeper and stronger with the screeners' educational serie one more time
I - Concept
This is the first flexible screener I'm releasing. Screener detecting a convergence whenever the MACD and MM cross are giving a signal in the same direction.
Those who know me from TradingView ... are aware that I'm big on convergences. I totally think that 1 indicator isn't enough - whatever the timeframe.
But building my own convergence detection systems has been fruitful for me
II - How did I set the screener
The visual signals are as follow:
- square: MACD + MA cross convergence.
- diamond: Only MACD is selected
- circle: Only MA cross is selected
Then the colors are:
- green when bullish
- red when bearish
Example
Below, I highlighted why we see diamonds on the top screener panel. This is because I only selected the MACD filter
Cool Hacks
Don't forget that you can add the same indicator multiple times on your chart :)
Wishing you all the BEST trading
Dave
MACD Pro Suite (Zeiierman)█ Overview
MACD Pro Suite (Zeiierman) redefines the classical MACD by transforming it into an adaptive market-behavior engine, instead of relying on a static fast–slow EMA configuration, the suite channels price through an efficiency matrix, a momentum acceleration core, and a multi-regime normalization layer. The result is a MACD architecture capable of shifting seamlessly between a volatility-conditioned oscillator, a probabilistic compression model, or a smooth, distribution-aware trend profiler, all emerging from the same underlying structure.
The MACD Pro Suite extends far beyond traditional MACD behavior by interpreting market structure in real time and adapting its responses to shifting conditions. It can detect subtle momentum transitions, quantify trend stability, reveal hidden inefficiencies in price movement, and highlight early regime shifts that standard oscillators completely overlook. Its dynamic normalization engine ensures consistency across different market environments, allowing the signal to remain clear during high volatility, low volatility, compression phases, expansions, and trend accelerations.
The system is designed to identify high-quality momentum turns, confirm trend continuity, and expose weakening market pressure before it becomes visible in price. It also reveals imbalances, impulses, and structural breaks with a level of precision that makes it valuable for discretionary traders seeking refined context and for systematic traders building rule-based models.
A built-in dashboard consolidates these behavioral states into an intuitive visual panel, making it easy to read market conditions at a glance and convert complex internal analysis into actionable insight.
⚪ Why This One Is Unique
MACD Pro Suite runs on a Hybrid Efficiency–Momentum engine that reshapes how the MACD responds to trend quality, noise, and impulse strength. This engine can operate in three distinct modes, letting the indicator shift between efficiency-driven behavior, momentum-driven behavior, or a balanced hybrid.
A multi-regime normalization system transforms the MACD into a stable, adaptive signal. It can operate as a volatility-balanced measure, a probability-styled compression model, a distribution-aware signal, or an ultra-smooth structural trend reader, all from the same core data. A real-time acceleration mechanism continuously adjusts the internal smoothing weights based on momentum intensity, giving the engine dynamic responsiveness as market conditions evolve.
Additional layers enhance this behavioral core:
Divergence mapping
Price inefficiency detection
Impulse markers
Adaptive exit structures
Significant move gradient zones
A multi-timeframe dashboard for immediate state awareness
█ Main Features
⚪ Efficiency Sources
Each efficiency source delivers a different style of structural interpretation, letting the MACD engine emphasize trend, pressure, or cyclical rotation depending on the chosen configuration and market environment.
Hybrid Efficiency–Momentum Core
In this mode, the MACD engine blends an efficiency-weighted price stream with momentum-based acceleration. The indicator adapts simultaneously to trend cleanliness, directional strength, and impulse intensity, giving it a balanced and highly reactive behavior profile.
Enhanced Momentum Core
Here, the engine uses raw price as the base input but applies a dynamic acceleration mechanism that adjusts internal EMA responsiveness in real time. The MACD becomes more reactive during strong momentum phases and more controlled during choppy, low-quality movement.
Efficiency Core
This framework routes the input through an efficiency pipeline where price, directional strength, or cyclic momentum is transformed into a cumulative efficiency path before MACD is calculated. It emphasizes structural clarity by suppressing noise and amplifying meaningful movement within the market.
⚪ MACD Shaping & Normalization Framework
Volatility Balanced Modes
These modes transform the MACD into a volatility-adjusted signal that automatically adapts to changing market conditions. The result is a cleaner and more stable read that adjusts naturally to expanding and contracting volatility while still preserving clear directional intent.
Tight Compression Modes
These shaping options re-scale MACD into compact 0 to 1 style ranges that are re-centered into a clean negative one to positive one structure. They produce a tightly controlled oscillator that highlights relative movement rather than raw amplitude.
Position Centered Modes
Here, the MACD is normalized using distribution-based scaling, allowing it to understand where it sits within its own movement range. This makes shifts in pressure and momentum easier to read and highlights when the indicator is moving into unusually strong or weak conditions.
Distribution Aware
These modes apply distribution-based transforms and robust statistical scaling. They stabilize MACD during irregular or skewed market conditions while preserving high-quality turning points
Volatility Filtered and Ultra Smooth Modes
These variants use multi-component volatility estimates and smoothed normalization to produce an exceptionally smooth MACD line. They maintain structure and trend behavior while filtering out low-value noise.
Robust Volatility Filtered
Ultra-Smooth Volatility Filter
⚪ Significant MACD Move
The Significant MACD module identifies when the MACD line enters a meaningful high-importance zone by evaluating its recent amplitude and confirming that momentum has held inside a defined activity region. Once active, a thicker overlay highlights periods where MACD is operating within this significant regime, while neutral phases use a base color for clear visual separation.
These highlights show when MACD is pressing into one of its internal pressure zones, helping you distinguish between ordinary momentum rotation and moments when the underlying push becomes strong enough to deserve attention. It is especially useful for spotting expansion phases, confirming breakouts, or identifying trend legs with real follow-through potential.
⚪ Signals
The suite includes directional signals that track meaningful shifts in market pressure and help highlight emerging turns or continuation strength, offering clear guidance when the market begins to turn or strengthen.
⚪ Divergences
When enabled, the suite automatically scans for regular bullish and bearish divergence between MACD and price. It identifies and marks structural pivot points where momentum and price begin to disagree. Because the MACD engine is built on efficiency and momentum rather than raw price alone, it can surface uncommon or non-traditional divergence structures that do not appear on standard indicators, often with noticeably higher accuracy.
Regular Bullish Divergence
MACD forms a higher low while price sets a lower low, signaling potential upward rotation.
Regular Bearish Divergence
MACD forms a lower high while price sets a higher high, indicating possible weakening momentum.
⚪ Price Inefficiency
The Price Inefficiency engine evaluates how balanced or imbalanced market movement is by analyzing a composite stream built from price, normalized MACD, normalized Signal, and smoothed structure. It measures how efficiently the market is progressing and identifies when movement becomes unstable, irregular, or out of sync with its underlying trend profile.
Blue diamonds plotted along the MACD zero line highlight periods where inefficiency is detected. This layer exposes subtle structural imbalances that often precede volatility bursts, failed moves, or regime transitions, giving traders early insight into when the market is behaving cleanly and when it is slipping into disorder.
⚪ Impulse Markers
The Impulse module identifies statistically extreme expansions in a smoothed, price-derived momentum stream. It highlights moments when momentum surges beyond normal behavior, marking them as either positive or negative impulses.
⚪ Visual Multi-Timeframe Dashboard
Along the right edge of the pane, a compact dashboard summarizes the MACD environment across 5M, 15M, 1H, 2H, 4H, and 1D. Each column reflects a key behavioral element derived from the MACD Pro Suite:
MACD Value – raw MACD pressure showing strength, weakness, or extreme displacement
MACD Signals – directional bias such as Long, Short, or neutral transitions
Histogram Signals – bull/bear momentum pulses extracted from the histogram structure
Divergence – bullish or bearish conflicts between MACD behavior and price movement
Inefficiency – imbalance zones where price behaves unstably or inefficiently
Impulse Moves – active bullish or bearish momentum bursts detected in real time
Think of it as a “MACD climate map.” Instead of flipping through multiple charts, you get an instant visual read on whether lower timeframes support the higher-timeframe environment or move against it. This makes multi-timeframe alignment straightforward and helps you decide when conditions favor aggressiveness, patience, or stepping aside entirely.
█ How to Use
The MACD Pro Suite is built to be exceptionally flexible. Because its core engine adapts to trend quality, volatility conditions, structural efficiency, and momentum strength, it can be shaped into almost any style of MACD behavior you need. From smooth trend-profiling to tight compression signals, from volatility-balanced structure to aggressive momentum tracking, the suite can be tuned to match your strategy, timeframe, and market environment.
Rather than forcing you into one interpretation of MACD, the framework gives you a set of behavioral modes that respond intelligently to changing conditions. It can act as a trend tool, a reversal detector, a structure mapper, or a regime classifier depending on how you configure it. This agility is what makes the suite useful for discretionary traders and system builders alike.
⚪ Classic MACD Trading
In its traditional form, MACD is used to track shifts in momentum and trend direction. The MACD line crossing above the Signal line often signals upward pressure, while crossing below suggests momentum is weakening or rotating downward. The histogram shows the distance between the two, making acceleration or deceleration easy to see at a glance.
These same interpretations apply directly within the MACD Pro Suite. Even with its advanced engines and normalization layers, the MACD and Signal lines still behave intuitively: crossovers mark directional shifts, zero-line transitions indicate broader trend bias, and histogram contractions or expansions reveal early momentum changes. This means you can trade it just like a classic MACD while benefiting from a far more adaptive and stable internal engine.
⚪ Fading Momentum Trading
MACD helps you spot fading momentum by watching the MACD line lose its slope and drift back toward the signal line. When the line stops accelerating and starts flattening, it’s a clear sign the trend is running out of strength. You also see fading momentum when both lines start moving back toward the midline, showing the impulse behind the trend is weakening even if the price hasn’t reversed yet.
Fading Momentum + Signals
If you spot fading momentum together with one of our Signals, it becomes a much stronger confirmation that the move is losing strength. When MACD momentum fades at the same time a Signal fires, the probability of a pullback or reversal increases significantly.
Fading Momentum + Divergences
The same applies when fading momentum aligns with divergences. If price makes a new high or low but the MACD line or histogram makes a weaker high/low, the divergence confirms that momentum is not supporting the move. Combined with fading MACD momentum, this is one of the strongest early warnings of an upcoming reversal.
⚪ Volatility and Breakout Trading
Volatility and breakout trading focus on how the market expands and contracts rather than on direction alone, and MACD Pro reacts beautifully to these shifts. When volatility increases, the MACD line tends to widen, steepen, or oscillate more aggressively. This makes it easier to see when the market is entering a high-energy phase that can lead to sharp breakouts or fast directional moves. As volatility cools, the MACD Pro begins to tighten and compress, with both the line and histogram pulling back toward equilibrium. This compression signals a contraction phase, often the calm before the next expansion.
You can spot volatility expansion when the MACD line or histogram behaves noticeably differently from recent behavior, such as sudden widening, rapid swings, or strong impulse signatures. These changes often highlight a volatility burst building beneath the surface. When that burst fades and the MACD compresses again, the market is usually preparing for a decisive move.
Settings used for Volatility and Breakout Trading:
Example Setting 1
MACD Moving average type: WMA
MACD Shaping: Raw MACD Behaviour
Momentum Multiplier: 6
Example Settings 2
MACD Shaping: Robust Volatility Filter
Momentum Multiplier: Increase toward 5
Example Setting 3
MACD Shaping: Distribution Balanced
Increase Momentum Multiplier: to exaggerate volatility bursts
Increase Efficiency Length: to filter minor fluctuations
⚪ Overbought / Oversold Trading
Overbought and oversold trading focuses on identifying when the price has stretched too far and is likely to rotate back toward balance. With the right shaping, the MACD can behave more like a bounded oscillator, making it easier to spot exhaustion on both sides of the range. When using tighter shaping or position-weighted behavior, the MACD becomes more responsive to market extremes while suppressing noise.
You can interpret overbought conditions when the MACD begins pressing into the upper region of its shaping range, showing that bullish momentum is becoming stretched. When it leans into the lower region, it signals oversold conditions and weakening bearish pressure. These zones help highlight exhaustion points, mean-reversion opportunities, and areas where a reversal or rotation is becoming increasingly likely.
Example settings:
MACD Shaping: Volatility Balanced
MACD Shaping: Tight 0–1 Band
MACD Shaping: Position Weighted
█ How It Works
⚪ Hybrid Efficiency–Momentum Engine
The core engine blends efficiency analysis with momentum dynamics, creating an adaptive MACD input stream that shifts between efficiency-centric, momentum-driven, or hybrid behavior depending on the selected mode.
Calculation: Builds the MACD input from either an efficiency-weighted cumulative path or a momentum-driven price stream, chosen by the engine mode.
⚪ Adaptive Momentum Response
A real-time responsiveness layer adjusts how quickly MACD reacts based on changes inside its structure. It becomes more responsive during fast-moving phases and naturally smooths itself during slower or noisy conditions.
Calculation: Computes a normalized responsiveness factor from structural deviation and injects it into the smoothing weights of the MACD EMAs.
⚪ Normalization & Behavior Shaping
A multi-regime shaping system re-scales and re-centers MACD using volatility filters, distribution transforms, compression modes, and ultra-smooth normalization to create consistent behavior across assets and volatility regimes.
Calculation: Applies shaping formulas to both MACD and Signal, then re-centers outputs to zero for unified interpretation.
⚪ Directional Signals
A lightweight structural reversal system highlights meaningful directional shifts, assisting with entries, exits, and bias confirmation during momentum transitions.
Calculation: Uses volatility-adjusted logic to detect directional flips and plot Up or Down markers.
⚪ Divergence Layer
The divergence engine detects structural disagreement between MACD and price, often surfacing uncommon divergence patterns thanks to the efficiency–momentum architecture.
Calculation: Identifies MACD pivots, aligns them with price pivots, and validates divergence through comparative structural thresholds.
⚪ Price Inefficiency Engine
This module evaluates imbalance in market structure by merging price behavior with internal MACD signals, highlighting unstable or disordered movement phases.
Calculation: Computes an inefficiency score from a blended composite source and maps imbalance intensity through adaptive thresholds.
⚪ Impulse Module
A momentum-intensity detector reveals statistically significant bursts in directional pressure, marking early expansion phases or exhaustion points.
Calculation: Extracts local extremes from a smoothed momentum field and confirms persistent surges through a cluster-based filter.
⚪ Significant MACD
This layer isolates high-importance momentum zones, making strong structural moves stand out clearly against routine oscillation.
Calculation: Evaluates MACD’s recent amplitude range and confirms when it enters a significant activity region, then applies enhanced visual styling.
-----------------
Disclaimer
The content provided in my scripts, indicators, ideas, algorithms, and systems is for educational and informational purposes only. It does not constitute financial advice, investment recommendations, or a solicitation to buy or sell any financial instruments. I will not accept liability for any loss or damage, including without limitation any loss of profit, which may arise directly or indirectly from the use of or reliance on such information.
All investments involve risk, and the past performance of a security, industry, sector, market, financial product, trading strategy, backtest, or individual's trading does not guarantee future results or returns. Investors are fully responsible for any investment decisions they make. Such decisions should be based solely on an evaluation of their financial circumstances, investment objectives, risk tolerance, and liquidity needs.

MACD w/ Divergences (Alert)To best use the MACD Divergence indicators, adjust the following settings accordingly.
• MACD Bullish Divergence Under: <0 (lower for larger volatility and more bearish markets)
• MACD Bearish Divergence Above: >0 (higher for larger volatility and more bullish markets)
Key Notes:
1. Set "Once Per Bar" instead of "Once Per Bar Close" alert.
The strategy already uses prior bar close (instead of current bar close) for calculation. This ensures that the signals will stay as they are after fired off, even when the current bar price is still changing.
2. It's OKAY to see the "alert may trigger differently than expected" warning.
Reason why you are seeing this warning is because we used a function called valuewhen() in our strategy. This function does not look at the entire history of data and has several limitations. For instance, on a 30min resolution, at the end of 2018, the function will be able to find past occurrences of BTC exceeding 16k. However, the function won't be able to find such occurrences at the end of 2019. Since our strategy is only concerned with very recent events, these limitations will not impact our results or cause repainting. You can find out more about this in the TradingView Wiki .
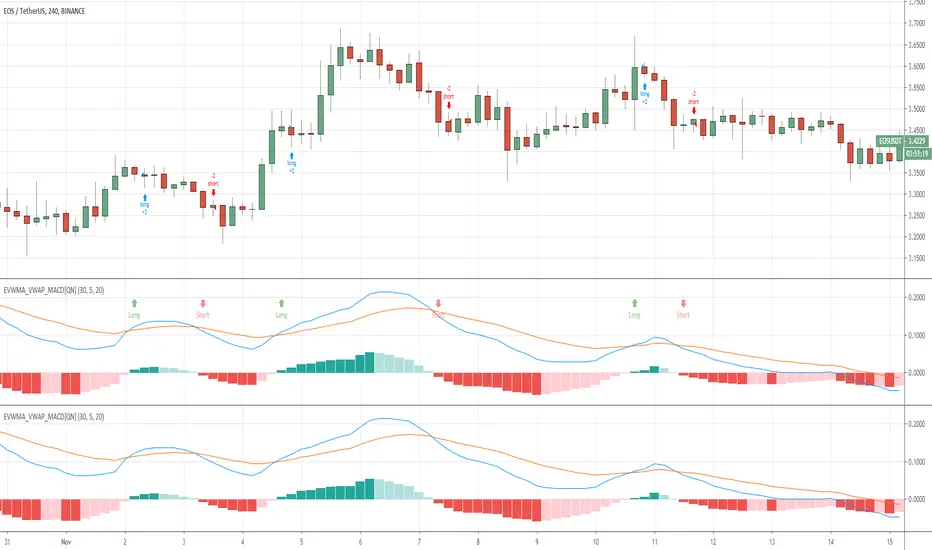
EVWMA VWAP MACD Strategy [QuantNomad]Based on comment of @coondawg71 I tried to compare VWAP and EVWMA.
Both are sort of moving averages so I decided to create a MACD based on these 2 indicators.
In parameters you can set EVWMA Length and 2 smoothing lengths for "macd" and "signal".
Strategy seems to work pretty good at 2h-8h timeframes for crypto.
What do you thing about it?

QuantNomad - EVWMA MACD StrategyPretty simple EVWMA (Elastic Volume Weighted Moving Average ) MACD Strategy.
EVWMA is a quite interesting moving average where the period of the MA is defined from the volume itself.
It incorporates volume information in a natural and logical way. The EVWMA can be looked at as an approximation to the average price paid per share.
As a volume period, you can use sum of the last x bars volumes.
Here are other EVWMA indicators/strategies:
EVWMA indicator:
EVWMA Cross strategy:

[ALL-IN-ONE] OSCILLATORS MTFHi everyone
I. 💎 SCRIPTS ACCESS 💎
1. My website URL is in this script signature at the very bottom (you'll have to scroll down a bit and going past the long description) and in my profile status available here : Daveatt
Due to the new scripts publishing house rules, I won't mention the URL here directly. As I value my partnership with TradingView very much, I prefer showing you the way for finding them :)
2. You obviously can contact me directly for more information
II. 🔎 ALL-IN-ONE OSCILLATORS MTF 🔎
This indicator offers to display many oscillators with a multi-timeframe option
The available oscillators so far are:
1. MACD
2. MACD ZERO LAG
3. RSI
4. DMI/ADX
5. ATR
6. STOCHASTIC RSI
7. TRUE STRENGTH INDEX
8. CHANDLE MOMENTUM OSCILLATOR
9. VORTEX INDICATOR
10. COMMODITY CHANNEL INDEX
11. RATE OF CHANGE
III - 📊 FEATURES 📊
3.1- 🔔 Alerts 🔔
LONG/SHORT alerts available for all oscillators.
You'll find only two events GoLong or GoShort because I simplified it a lot.
Let's assume the user wants to create alerts on a MACD first, and in a second time on an RSI.
All he/she has to do is :
1) to select the MACD parameter in the indicator and then activating the events GoLong and/or GoShort.
2) once done, select RSI filter in the indicator and then activate the events GoLong and/or GoShort.
3.2- 🔌&🕹️ (Plug and Play)
This feature is optional but very cool regardless.
Compatible with any of my Plug&Play trading tools.
You'll get instant results by connecting the ALL-IN-ONE to another Plug and Play compatible system.
Feel free to send a request my way if you want more details on that
3.3 - ⏱️ Use current chart resolution or any available timeframe
The Multi-timeframes component will expand your analytics capabilities even more.
IV - Use Cases
The use cases are maybe limitless
- an H4 oscillator combined with your indicator Plug&Play applied on an H1 chart.
- an RSI reversal signal used with your Backtest system.
- a 30-minutes True Strength Index plugged to a 5-minute indicator- itself combined into a Backtest system. #mind #blown
- ...
-------------------------------------------------------------------------------------------------------------------------------------
If you have any doubts or questions, please hit me up directly or ask in the comments section of this script.
I'll never claim I have the best trading methodology or indicators.
You only will judge and I'll appreciate all the questions and feedback you're sending my way.
They helped me a ton for developing indicators based on all the requests I received.
Kind regards,
Dave