Macro Risk On/Off SentimentOverview
As an Ichimoku trader, I've always found it crucial to understand the broader market sentiment before entering trades. That's why I developed this Macro Risk On/Off Sentiment Indicator. It's designed to provide a comprehensive view of global market risk sentiment by analysing multiple factors across different asset classes. By combining nine key market indicators, it produces an overall risk sentiment score, giving me a clearer picture of the market's mood before I apply my Ichimoku strategy.
Rationale
While Ichimoku is powerful for identifying trends and potential entry points, I realised it doesn't always capture the broader market context. Markets don't exist in isolation—they're influenced by a myriad of factors including volatility, economic indicators, and cross-asset relationships. By creating this indicator, I aimed to fill that gap, providing myself with a macro view that complements my Ichimoku analysis.
How It Works
The indicator analyses nine different market factors:
VIX (Volatility Index): Measures market expectations of near-term volatility.
S&P 500 Performance: Represents the overall US stock market performance.
US 10-Year Treasury Yield: Indicates bond market sentiment and economic outlook.
Gold Price Movement: Often seen as a safe-haven asset.
US Dollar Index: Measures the strength of the USD against a basket of currencies.
Emerging Markets Performance: Represents risk appetite for higher-risk markets.
High Yield Bond Spreads: Indicates credit market risk sentiment.
Copper/Gold Ratio: An economic growth indicator.
Put/Call Ratio: Measures overall market sentiment based on options trading.
Each factor is assigned a score based on its z-score relative to its recent history, then weighted according to its perceived importance. The overall risk score is a weighted average of these individual scores.
How I Use It
Before applying my Ichimoku strategy, I first check this indicator to gauge the overall market sentiment:
I look at the blue line plotted on the chart, which represents the overall risk score.
I note the background colour: green for risk-on (positive score) and red for risk-off (negative score).
I check the label in the lower-left corner, which provides specific FX pair recommendations and market expectations.
In a risk-on environment (positive score):
I focus on long positions in AUD/JPY, NZD/JPY, EUR/USD, etc.
I look for short opportunities in USD/CAD, USD/NOK, etc.
I expect commodities and yields to rise
In a risk-off environment (negative score):
I focus on long positions in USD/JPY, USD/CHF, USD/CAD
I look for short opportunities in AUD/USD, NZD/USD, EUR/USD
I expect increased volatility and falling yields
The strength of the sentiment is reflected in how close the score is to either 1 (strong risk-on) or -1 (strong risk-off). This helps me gauge how aggressive or conservative I should be with my Ichimoku trades.
Customisation
I've designed this indicator to be flexible. You can modify it to:
Adjust the lookback period and moving average length (both default to 30)
Change the weighting of different factors in the final score calculation
Include or exclude specific factors based on your analysis needs
By combining this Macro Risk On/Off Sentiment Indicator with my Ichimoku analysis, I've found I can make more informed trading decisions, taking into account both the technical setups I see on the chart and the broader market context.
Macro

ICT Times [joshu]This TradingView indicator provides a comprehensive view of ICT killzones, Silver Bullet times, and ICT Macros, enhancing your trading experience.
In those time windows price either seeks liquidity or imbalances and you often find the most energetic price moves and turning points.
Features:
Automatic Adaptation: The ICT killzones intelligently adapt to the specific chart you are using. For Forex charts, it follows the ICT Forex times:
Asia: 2000-0000
London: 0200-0500
New York: 0700-1000
London Close: 1000-1200
For other charts, it uses the following session times:
Asia: 2000-0000
London: 0200-0500
New York AM: 0830-1100
New York PM: 1330-1600
Silver Bullet Times:
0300-0400
1000-1100
1400-1500
How to Use:
Simply apply the indicator to your chart, and the session boxes and Silver Bullet times will be plotted automatically.

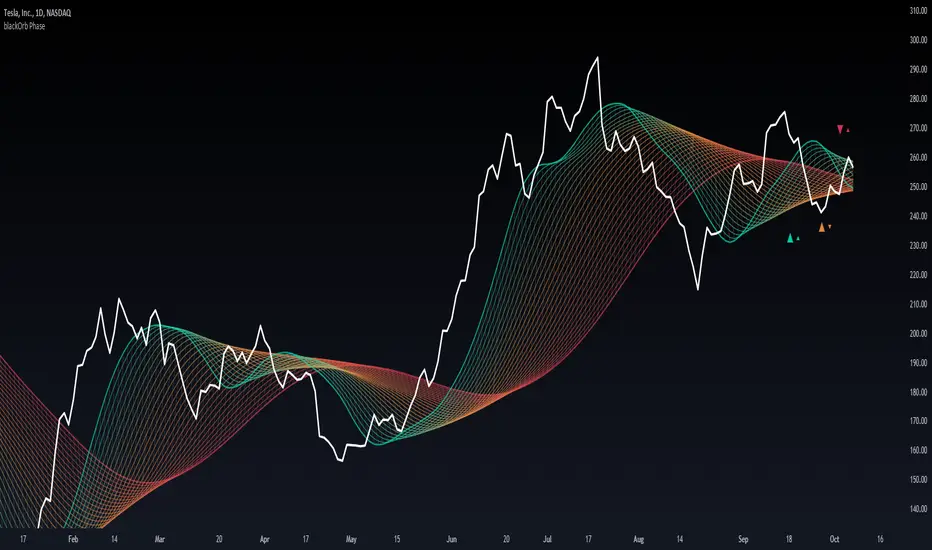
blackOrb PhaseMA matrix for identification of bullish/bearish macro phases and strategy implementation through the definition of effective MA lengths.
Moving Averages, when conventionally employed in either single-line or dual-line configurations, come with inherent limitations that hinder their effectiveness in capturing the complexities of varying market conditions.
In response to this challenge, blackOrb Phase utilizes a combination of quantitative and relational MA analysis techniques, providing users with a more comprehensive understanding of market trends and a granular derivation of price-dynamic phases by using the following features:
I. MA matrix to identify effective MA lengths for strategy implementation
II. Stochastic coloring for trend tracking and macro phase identification
III. Diverse MA options for enhanced analytical flexibility
Technical Methodology
I. MA Matrix to Identify Effective MA Lengths for Strategy Implementation
Central to the methodology is the ability to identify optimal MA lengths for effective strategy implementation. blackOrb Phase utilizes a matrix of multiple MAs, each characterized by unique parameters, to establish a relational grid structure. By systematically examining price data within predefined vertical segments, this matrix offers a linear multi-level modulation of historical price data, providing access to up to 500 prior data instances. This methodology enhances the analysis of both micro price dynamics shifts and bullish or bearish macro trend changes. It has been empirically validated that this approach can assist users to refine their analysis and adapt to varying market conditions*.
Crossings of MA lines with different colors signify potential shifts in price dynamic phases. When green MA lines intersect red MA lines, it suggests a higher likelihood of a macro trend change (bullish or bearish market environment). Conversely, when green MA lines cross over orange MA lines, it indicates a lower probability of a macro trend change but still suggests a potential micro trend shift. This micro trend shift can be viewed as a subordinate price dynamic change within the broader macro trend.
*Source: Prof. Pätäri, Eero. "Performance of moving average trading strategies over varying stock market conditions." Applied Economics, vol. 46, no. 24, 2014, pp. 2851-2872.
II. Stochastic Coloring for Trend Tracking and Macro Phase Identification
To provide a comprehensive view, this indicator includes a stochastic tracking feature, displayed through an intuitive single-color system across the entire matrix grid. The color scheme transitions from red lines, indicating the beginning of bearish trend phases, to green lines, indicating the initiation of bullish trend phases and vice versa. The greater the number of lines with the same color, the stronger the trend.
This tool enhances price trend monitoring, allowing traders not only to track their initiation and continuation but also to confirm trend culmination. By observing color shifts from red/green lines, traders can assess the sustainability and persistence of broader macro trends.
Note: Stochastic coloring aids in probability-based orientation and provides valuable insights for trading strategy implementation. It is most effective when used in conjunction with other analysis and risk management techniques.
III. Diverse MA Options for Enhanced Analytical Flexibility
Users have the flexibility to choose from 14 different MA types (e.g. including ALMA, KAMA, T3, VWMA, TriMA and ZLEMA). This versatility allows for precise configurations tailored to specific market conditions.
For example, among the array of these 14 MA alternatives, VWMA (Volume Weighted MA) stands out as a suitable implementation choice for integrating volume data. It goes beyond the scope of a simple moving average, considering both price and volume in its calculation, as shown in the following formula:
(C1 x V1 + C2 x V2 + ... + Cn x Vn) / (V1 + V2 + ... + Vn)
Alongside this variety of MA types, users can select from a range of OHLC combination options (open, high, low and close price data), further enhancing analytical flexibility.
Note: While these choices offer substantial flexibility, they also require a solid understanding of the various MA types and data combinations, making risk management essential.
Note on Usability
blackOrb Phase can have synergies with blackOrb Price and blackOrb Zone as all three indicators combined can give a bigger picture for supporting comprehensive and multifaceted data-driven trading analysis.
This tool was meticulously created to serve as an additional frame for the seamless integration of other more granular trading indicators. This indicator isn't intended for standalone trading application. Instead, it is serving as a supplementary tool for orientation within broader trading strategies.
Irrespective of market conditions, it can harmonize with a wider range of trading styles and instruments / trading pairs / indices like Stocks, Gold, FX, EURUSD, SPX500, GBPUSD, BTCUSD and Oil.
Inspiration and Publishing
Taking genesis from the inspirations amongst others provided by TradingView Pine Script Wizard Kodify, blackOrb Phase is a multi-encompassing script meticulously forged from scratch. It aspires to furnish a comprehensive approach, borne out of personal experiences and a strong dedication in supporting the trading community. We eagerly await valuable feedback to refine and further enhance this tool.
US Recession IndicatorThe US Recession Indicator is designed to identify recessions as they happen, using two reputable indicators that have accurately foreseen all past recessions since 1969. Unlike the National Bureau of Economic Research (NBER) which determines recession dates after the fact, this indicator seeks to spot recessions in real-time. When both of these distinct metrics meet certain criteria, the chart's background becomes shaded, signifying a strong likelihood that the economy is in a recession. Furthermore, a built-in alert system keeps users updated without constant monitoring.
The first metric is the Smoothed Recession Probabilities developed by Marcelle Chauvet. It is based on a dynamic-factor markov-switching model that assesses four monthly coincident variables: non-farm payroll employment, the index of industrial production, real personal income excluding transfer payments and real manufacturing and trade sales. It offers a mathematical analysis of how recessions deviate from expansions. In essence, this index mirrors the probability of the prevailing true economic situation being a recession, grounded on the current GDP data.
The second metric is the Sahm Rule Recession Indicator developed by Claudia Sahm. It operates on the principle that changes in the unemployment rate can be used to identify the onset of a recession. According to this rule, if the three-month moving average of the unemployment rate rises by 0.5 percentage points or more above its lowest point from the preceding year, it flags a potential recession.
For this combined indicator, the thresholds are intentionally set lower than when each metric is used individually. Both metrics must simultaneously suggest a potential recession in order to send a signal. This stems from the realisation that neither metric is infallible and has, on occasion, sent false signals in the past. By requiring both to align, the likelihood of a false positive is reduced. However, it's crucial to understand that past performance does not guarantee future results, leaving the door open for potential false alerts which may not be confirmed by the NBER.

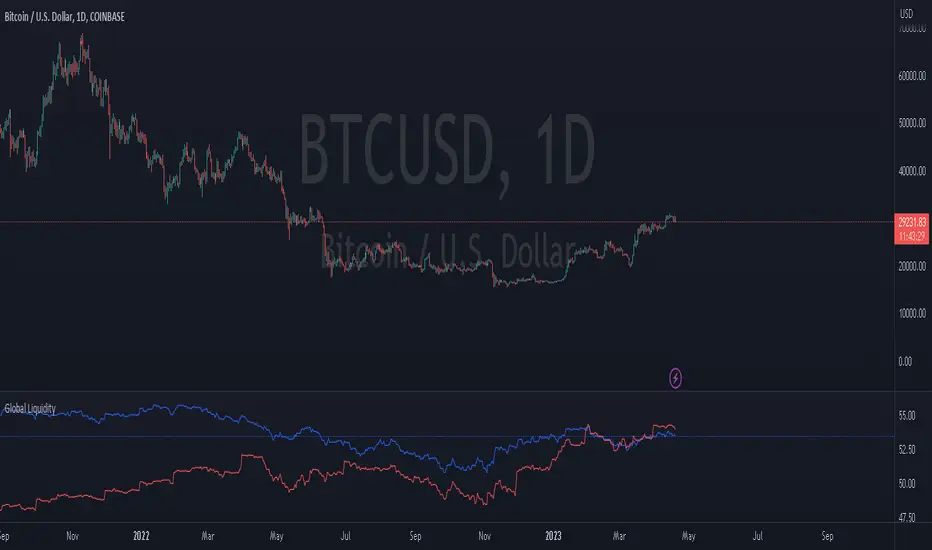
Global Liquidity IndexThe Global Liquidity Index offers a consolidated view of all major central bank balance sheets from around the world. For consistency and ease of comparison, all values are converted to USD using their relevant forex rates and are expressed in trillions. The indicator incorporates specific US accounts such as the Treasury General Account (TGA) and Reverse Repurchase Agreements (RRP), both of which are subtracted from the Federal Reserve's balance sheet to give a more nuanced view of US liquidity. Users have the flexibility to enable or disable specific central banks and special accounts based on their preference. Only central banks that both don’t engage in currency pegging and have reliable data available from late 2007 onwards are included in this aggregated liquidity model.
Global Liquidity Index = Federal Reserve System (FED) - Treasury General Account (TGA) - Reverse Repurchase Agreements (RRP) + European Central Bank (ECB) + People's Bank of China (PBC) + Bank of Japan (BOJ) + Bank of England (BOE) + Bank of Canada (BOC) + Reserve Bank of Australia (RBA) + Reserve Bank of India (RBI) + Swiss National Bank (SNB) + Central Bank of the Russian Federation (CBR) + Central Bank of Brazil (BCB) + Bank of Korea (BOK) + Reserve Bank of New Zealand (RBNZ) + Sweden's Central Bank (Riksbank) + Central Bank of Malaysia (BNM).
This tool is beneficial for anyone seeking to get a snapshot of global liquidity to interpret macroeconomic trends. By examining these balance sheets, users can deduce policy trajectories and evaluate the global economic climate. It also offers insights into asset pricing and assists investors in making informed capital allocation decisions. Historically, riskier assets, such as small caps and cryptocurrencies, have typically performed well during periods of rising liquidity. Thus, it may be prudent for investors to avoid additional risk unless there's a consistent upward trend in global liquidity.

[TTI] NDR 63-Day QQQ-QQEW ROC% SpreadWelcome to the NDR 63-Day QQQ-QQEW ROC% Spread script! This script is a powerful tool that calculates and visualizes the 63-day Rate of Change (ROC%) spread between the QQQ and QQEW tickers. This script is based on the research conducted by Ned Davis Research (NDR), a renowned name in the field of investment strategy.
⚙️ Key Features:
👉Rate of Change Calculation: The script calculates the 63-day Rate of Change (ROC%) for both QQQ and QQEW tickers. The ROC% is a momentum oscillator that measures the percentage price change over a given time period.
👉Spread Calculation: The script calculates the spread between the ROC% of QQQ and QQEW. This spread can be used to identify potential trading opportunities.
👉Visual Representation: The script plots the spread on the chart, providing a visual representation of the ROC% spread. This can help traders to easily identify trends and patterns.
👉Warning Lines: The script includes warning lines at +600 and -600 levels. These lines can be used as potential thresholds for trading decisions.
Usage:
To use this script, simply add it to your TradingView chart. The script will automatically calculate the ROC% for QQQ and QQEW and plot the spread on the chart. You can use this information to inform your trading decisions.
🚨 Disclaimer:
This script is provided for educational purposes only and is not intended as investment advice. Trading involves risk and is not suitable for all investors. Please consult with a financial advisor before making any investment decisions.
🎖️ Credits:
This script is based on the research conducted by Ned Davis Research (NDR). All credit for the underlying methodology and concept goes to NDR.

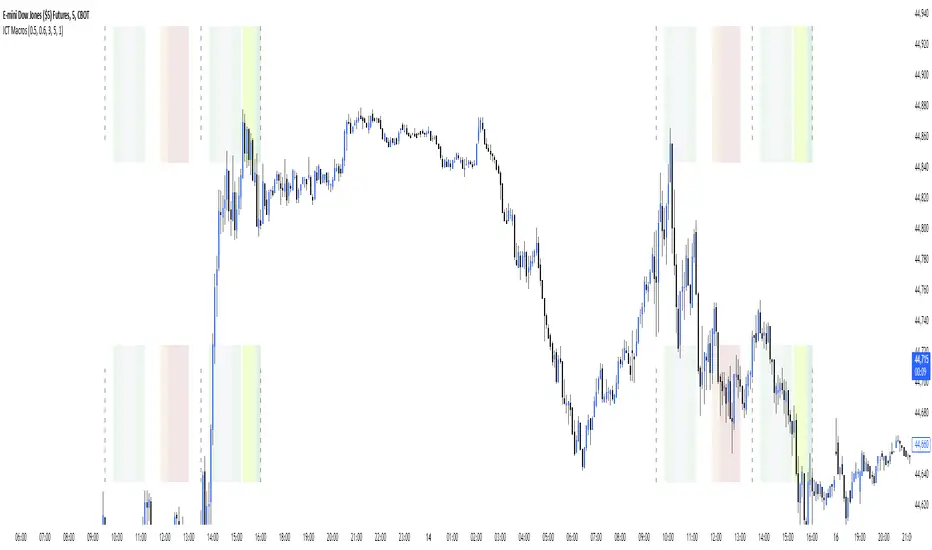
ICT Macros [LuxAlgo]The ICT Macros indicator aims to highlight & classify ICT Macros, which are time intervals where algorithmic trading takes place to interact with existing liquidity or to create new liquidity.
🔶 SETTINGS
🔹 Macros
Macro Time options (such as '09:50 AM 10:10'): Enable specific macro display.
Top Line , Mid Line , Bottom Line and Extending Lines options: Controls the lines for the specific macro.
🔹 Macro Classification
Length : A length to detect Market Structure Brakes and classify macro type based on detection.
Swing Area : Swing or Liquidity Area selection, highest/lowest of the wick or the candle bodies.
Accumulation , Manipulation and Expansion color options for the classified macros.
🔹 Others
Macro Texts : Controls both the size and the visibility of the macro text.
Alert Macro Times in Advance (Minutes) : This option will plot a vertical line presenting the start of the next macro time. The line will not appear all the time, but it will be there based on remaining minutes specified in the option.
Daylight Saving Time (DST) : Adjust time appropriate to Daylight Saving Time of the specific region.
🔶 USAGE
A macro is a way to automate a task or procedure which you perform on a regular basis.
In the context of ICT's teachings, a macro is a small program or set of instructions that unfolds within an algorithm, which influences price movements in the market. These macros operate at specific times and can be related to price runs from one level to another or certain market behaviors during specific time intervals. They help traders anticipate market movements and potential setups during specific time intervals.
To trade these effectively, it is important to understand the time of day when certain macros come into play, and it is strongly advised to introduce the concept of liquidity in your analysis.
Macros can be classified into three categories where the Macro classification is calculated based on the Market Structure prior to macro and the Market Structure during the macro duration:
Manipulation Macro
Manipulation macros are characterized by liquidity being swept both on the buyside and sellside.
Expansion Macro
Expansion macros are characterized by liquidity being swept only on the buyside or sellside. Prices within these macros are highly correlated with the overall trend.
Accumulation Macro
Accumulation macros are characterized by an accumulation of liquidity. Prices within these macros tend to range.
The script returns the maximum/minimum price values reached during the macro interval alongside the average between the maximum/minimum and extends them until a new macro starts. These levels can act as supports and resistances.
🔶 DETAILS
All required data for the macro detection and classification is retrieved using 1 minute data sets, this includes candles as well as pivot/swing highs and lows. This approach guarantees the visually presented objects are same (same highs/lows) on higher timeframes as well as the macro classification remain same as it is in 1 min charts.
8 Macros can be displayed by the script (4 are enabled by default):
02:33 AM 03:00 London Macro
04:03 AM 04:30 London Macro
08:50 AM 09:10 New York Macro
09:50 AM 10:10 New York Macro
10:50 AM 11:10 New York Macro
11:50 AM 12:10 New York Launch Macro
13:10 PM 13:40 New York Macro
15:15 PM 15:45 New York Macro
🔶 ALERTS
When an alert is configured, the user will have the ability to be notified in advance of the next Macro time, where the value specified in 'Alert Macro Times in Advance (Minutes)' option indicates how early to be notified.
🔶 LIMITATIONS
The script is supported on 1 min, 3 mins and 5 mins charts.
🔶 RELATED SCRIPTS

ICT MakrosThis script highlights the ICT trading makros and silverbullet timewindows with different background colors on your chart. The drawings are only visible on the timeframe 1min - 5min because they become useless above and i didnt code the logic for below 1min
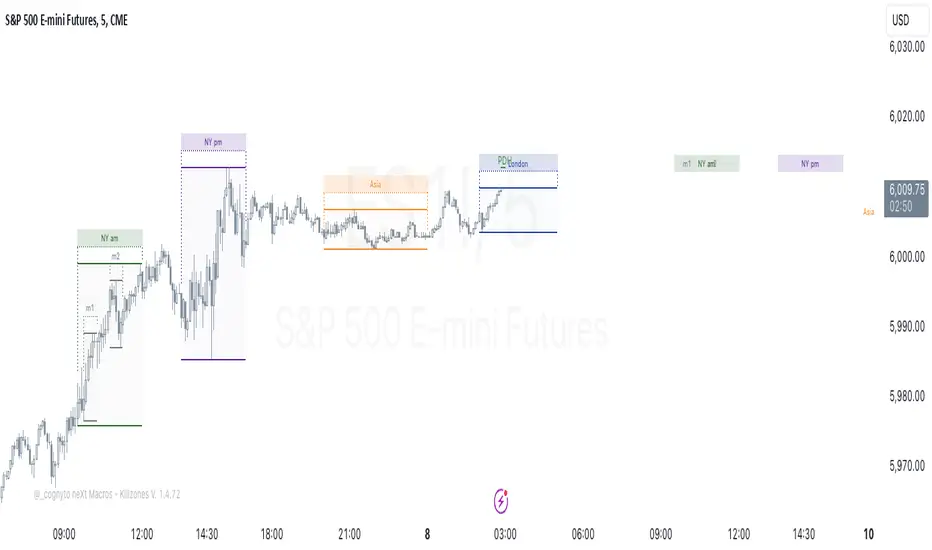
neXt Macros - Killzones [cognyto]The MACRO indicator is a valuable tool for traders who want to develop consistency and believe that major macroeconomic events occur at certain times of the day that can affect the market. By showing macro times in advance, allowing alerts to be triggered, and showing previous macros that have occurred, the MACRO indicator provides traders with the information they need to make more informed trading decisions that can be used in conjunction with their own strategies.
What is a MACRO?
A MACRO is a concept introduced by Micheal Huddleston, known as ICT, the -Inner Circle Trader- and he is the one to thank for. It represents some short periods of time during the day that can be used as an advantage for trading due to major economic events, or when the price reaches a certain level of relevance. The indicator is a tool that visually highlights these important periods in advance.
Some of the features of the MACRO indicator are:
The indicator highlights IN ADVANCE the relevant segments of time during the day, known as MACROS. It allows the trader to monitor the price precisely at these times and potentially identify trading opportunities according to his own strategies. All Macro times in the indicator can be modified, enabled or disabled. It is likely that not all MACROS will be relevant to all instruments, so it is recommended that only those relevant to the trader's instrument or market preferences are enabled, disabled or the times adjusted. The News checkbox helps traders to visualise, in a different color, those macros where news are expected to be published and may cause unpredictable high volatility, so it is advisable to have high precautions or as suggested by ICT: "DO NOT TRADE DURING THOSE TIMES OR DAYS !!! " Please note that this feature is optional to be used but certainly has to be updated on a daily basis, since not all days occur the same news events.
In addition to this, it also allows the trader to set the number of minutes that alerts are to be triggered before the start of the next MACRO. This feature allows traders to review, analyse and trade ONLY during MACRO times and prevent them from constantly monitoring the screen. This feature can be of great value to those who need the discipline to gain consistency and only trade when the time is relevant. Please note that the alerts are not triggered by the indicator, this can only be done through TradingView. The checkbox only indicates that the trader wishes to receive alerts of those MACRO times that are enabled. Therefore, it is HIGHLY SUGGESTED to set the alerts in TradingView to the 1 minute timeframe in order to have the required precision for alarming.
Finally, the MACRO indicator also displays previous macros that have occurred in the last few days and with severe settings that allow the trader to precisely implement different strategies. This feature allows traders to back test and analyse the relevance of past macros. By understanding how the market has reacted to similar events in the past, traders can make more informed decisions about how to trade current and future events.
Remember that your cognitive balance is essential and this indicator aims to help you manage your TIME and reduce anxiety by sticking to your rules.
This indicator is for informational purposes only and you should not rely on any information it provides as legal, tax, investment, financial or other advice. Nothing provided by this indicator constitutes a solicitation, recommendation, endorsement or offer by cognyto or any third party service provider to buy or sell any securities or other financial instruments in this or any other jurisdiction in which such solicitation or offer would be unlawful under the securities laws of such jurisdiction.
Global LiquidityThe "Global Liquidity" script is an indicator that calculates and displays the global liquidity value using a formula that takes into account the money supply of several major economies. The script utilizes data from various sources, such as the Federal Reserve Economic Data (FRED), Economics, and FX_IDC.
The indicator plots the global liquidity value as a candlestick chart and breaks it down into two categories: the Euro-Atlantic region (West) and the rest of the world (East). The values are denominated both in inflation-adjusted dollars and in trillions of dollars. The script also calculates the spread between the Euro-Atlantic region and the rest of the world.
Traders and investors can use this indicator to gauge the overall liquidity of the global economy and to identify potential investment opportunities or risks. By breaking down the liquidity value into different regions, traders can also gain insights into regional economic trends and dynamics.
Note that this script is subject to the terms of the Mozilla Public License 2.0 and was created by rodopacapital.
Bonds: US Yields for 3Y, 5Y, 7Y, 10Y, 30Y, 10Y-2YDisplays US Bond Yields for 3Y, 5Y, 7Y, 10Y, 30Y, 10Y-2Y.
Best used on a cart that has a similar Y-Axis... for example, using this indicator on the TVC:US10Y chart works.
Added some bells and whistles such as a tabular chart for current rate as well as ability to turn on off specific yields (in the settings cog)
This is my first publish!
So please let me know what you think... or if something is wrong :)

ICT Algorithmic Macro Tracker° (Open-Source) by toodegreesDescription:
The ICT Algorithmic Macro Tracker° Indicator is a powerful tool designed to enhance your trading experience by clearly and efficiently plotting the known ICT Macro Times on your chart.
Based on the teachings of the Inner Circle Trader , these Time windows correspond to periods when the Interbank Price Delivery Algorithm undergoes a series of checks ( Macros ) and is probable to move towards Liquidity.
The indicator allows traders to visualize and analyze these crucial moments in NY Time:
- 2:33-3:00
- 4:03-4:30
- 8:50-9:10
- 9:50-10:10
- 10:50-11:10
- 11:50-12:10
- 13:10-13:50
- 15:15-15:45
By providing a clean and clutter-free representation of ICT Macros, this indicator empowers traders to make more informed decisions, optimize and build their strategies based on Time.
Massive shoutout to @reastruth for his ICT Macros Indicator , and for allowing to create one of my own, go check him out!
Indicator Features:
– Track ongoing ICT Macros to aid your Live analysis.
- Gain valuable insights by hovering over the plotted ICT Macros to reveal tooltips with interval information.
– Plot the ICT Macros in one of two ways:
"On Chart": visualize ICT Macro timeframes directly on your chart, with automatic adjustments as Price moves.
Pro Tip: toggle Projections to see exactly where Macros begin and end without difficulty.
"New Pane": move the indicator two a New Pane to see both Live and Upcoming Macro events with ease in a dedicated section
Pro Tip: this section can be collapsed by double-clicking on the main chart, allowing for seamless trading preparation.
This indicator is available only on the TradingView platform.
⚠️ Open Source ⚠️
Coders and TV users are authorized to copy this code base, but a paid distribution is prohibited. A mention to the original author is expected, and appreciated.
⚠️ Terms and Conditions ⚠️
This financial tool is for educational purposes only and not financial advice. Users assume responsibility for decisions made based on the tool's information. Past performance doesn't guarantee future results. By using this tool, users agree to these terms.

Period OpenA very simple indicator that displays the Open of the specified Timeframe
How to use this indicator?
1. Directional Bias
Bullish => Closing Price > Period Open
Bearish => Closing Price < Period Open
2. Support / Resistance
Each Period Open can be used as Support or Resistance
3. Take Profit Targets
Each Period Open can be used as targets for taking profit

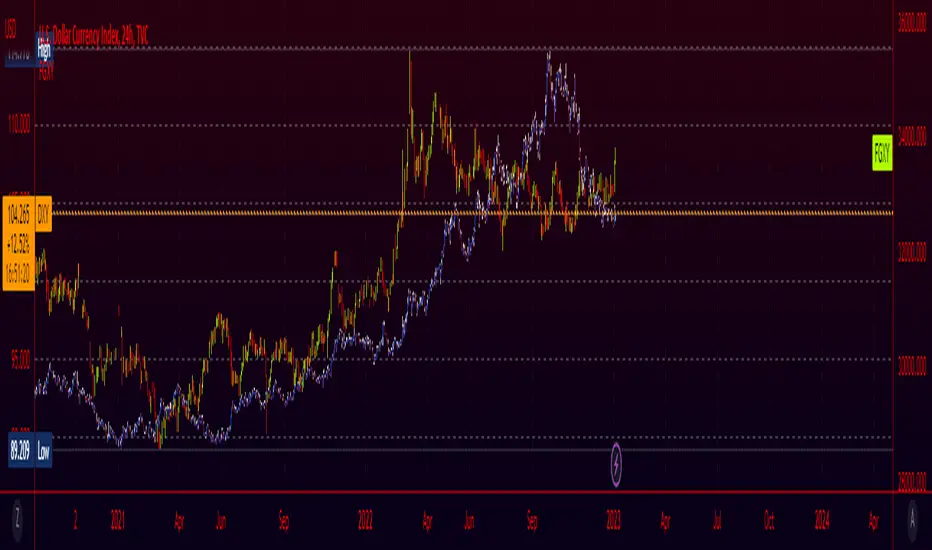
Fiat Currency and Gold Indices (FGXY) CandlesA modification of my previous indicator "Crypto Index (DXY) Candles". The idea was to create a similar currency basket to the standard DXY, but from the perspective of other currencies. Still using the standard DXY weights, this indicator allows you to create a tailored index for other currencies, provided that a currency pair exists for each of the 6 components. This means that even currencies that aren't included should work in theory; just find the 3 character currency prefix used by tradingview and give it a shot! This indicator is useful for gauging how well countries/currencies are holding up and when paired with the standard DXY may help see potential inflection points. For use on longer time frames (~1h-~3d) as some of the data being pulled seems to have issues on lower timeframes.
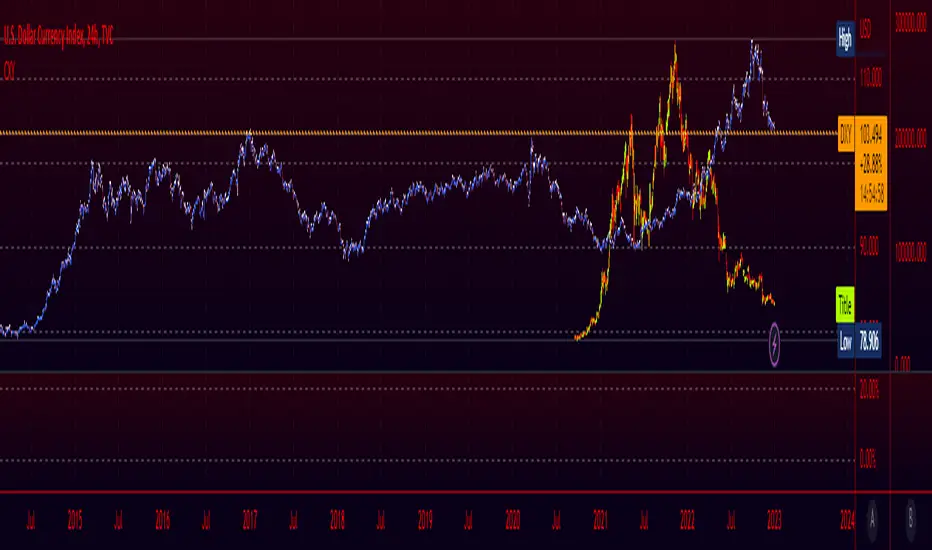
Crypto Index (DXY) CandlesA modification of @loxx's "Dollar Index (DXY) Candles" allowing for a user selected basket of tickers using the same weights as the standard DXY. Ticker Inputs are in descending order so highest weight is at the top by default, although weighting can be changed manually by modifying the symbol's corresponding weight input in the settings. The Idea was to get a bird's eye view of the crypto space using some of the more relevant names in the space. User's can use the toggle in the settings for viewing the default DXY for comparison. Indicator should be used as a confirmation when looking at long term trend changes in the space, shorter time frames may, or may not be as useful.
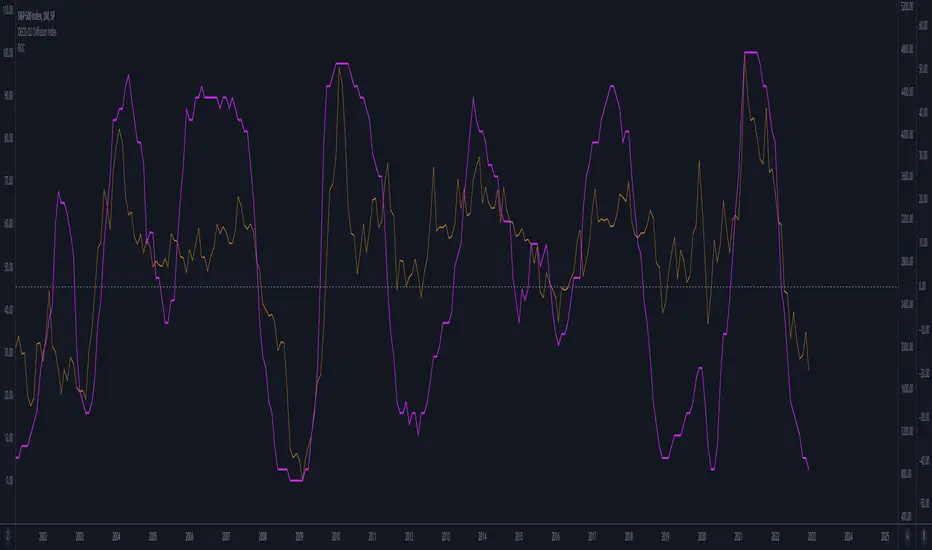
OECD CLI Diffusion IndexWhat does the indicator measure?
This is a macro indicator. It uses OECD's composite leading indicator - see details about the CLI below.
What it does it calculate YoY changes for CLI of 38 countries that are members or are associated with the OECD. Then it measures a percent of countries which CLI is rising.
How this can be used?
The positive slope of the curve means that there probably will be an economic growth among those countries within next 6 - 9 months. The negative slope means there probably will be an economic contraction.
Forward-looking economic growth is correlated with positive S&P 500 YoY growth (equity markets are also forward looking). The chart above presents the CLI diffusion index with overlayed S&P500 YoY rate of change.
The CLI is also correlated with ISM PMI - see example below:
What is a CLI?
"The OECD system of Composite Leading Indicators (CLIs) is designed to provide early signals of turning points in business cycles - fluctuation in the output gap, i.e. fluctuation of the economic activity around its long term potential level. This approach, focusing on turning points (peaks and troughs), results in CLIs that provide qualitative rather than quantitative information on short-term economic movements."
Multi-Polar WorldA new macro analysis tool for easily analyzing the multi-polar world's economic powerhouses / spheres of influence, making for an easy to use visual when comparing a number of statistics:
GDP, GDP per Capita, External Debt, Government Debt, Exports, Imports, Gold Reserves, Employed Persons, Military Expenditure, Population, Bank Lending Rate, Balance of Trade, Central Bank Balance Sheet, M2 Money Supply, and CPI . Includes option to provide the total for each pole, or view individually for more detailed comparison. Meant to be used when analyzing the macro-economic conditions/trends in conjunction with other "Big Picture" type indicators when adjusting your macro framework.

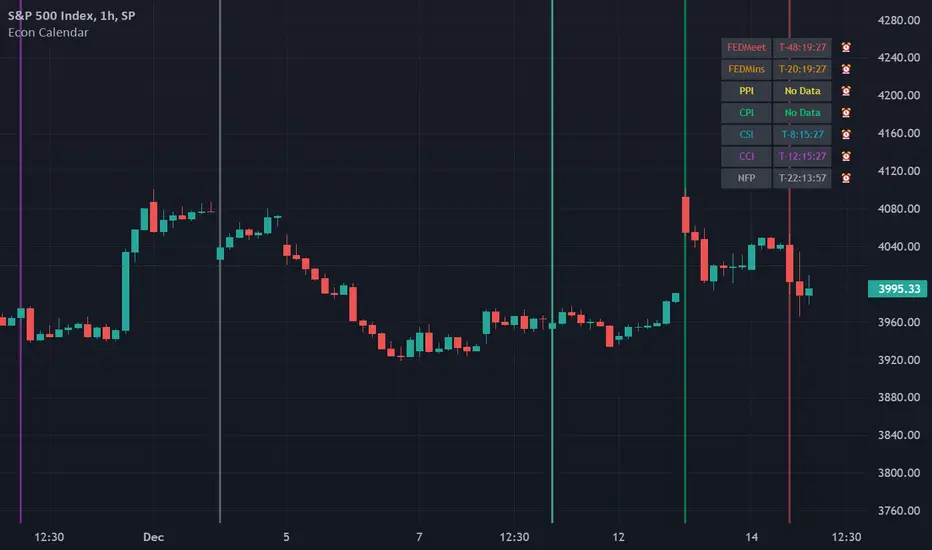
Odd_mod Econ CalendarA modification of Economic Calendar Events: FOMC, CPI, and more written by jdehorty . Please send all tips his way as he is maintaining the underlying data for the Calendar and the original concept.
List of changes:
Optimized code, will only run once on initialization now(No random line in middle of screen on bar change)
Legend - Added short names
Legend - Removed header
Legend - Made repositionable with selectable top margins
Legend - Removed data name from legend when it is disabled
Legend - Removed border
Original Description by jdehorty :
This script plots major events from the Economic Calendar that often correspond to major pivot points in various markets. It also includes built-in logic to retroactively adjust larger time intervals (i.e. greater than 1 hour) to be correctly aligned with the interval during which the event occurred.
Events are taken from the Economic Calendar and will be updated periodically at the following library:
EconomicCalendar
The above library can be used to conveniently access date-related data for major Meetings, Releases, and Announcements as integer arrays, which can be used in other indicators. Currently, it has support for the following events:
FOMC Meetings
The FOMC meets eight times a year to determine the course of monetary policy . The FOMC's decisions are based on a review of economic and financial developments and its assessment of the likely effects of these developments on the economic outlook.
FOMC Minutes
The FOMC minutes are released three weeks after each FOMC meeting. The minutes provide a detailed account of the FOMC's discussion of economic and financial developments and its assessment of the likely effects of these developments on the economic outlook.
Producer Price Index (PPI) Releases
The Producer Price Index (PPI) measures changes in the price level of goods and services sold by domestic producers. The PPI is a weighted average of prices of a basket of goods and services, such as transportation, food, and medical care. PPI is a leading indicator of CPI .
Consumer Price Index ( CPI ) Releases
The Consumer Price Index ( CPI ) measures changes in the price level of goods and services purchased by households. The CPI is a weighted average of prices of a basket of consumer goods and services, such as transportation, food, and medical care. CPI is one of the most widely used measures of inflation .
Consumer Sentiment Index ( CSI ) Releases
The University of Michigan's Consumer Sentiment Index ( CSI ) is a measure of consumer attitudes about the economy. The CSI is based on a monthly survey of U.S. households and reflects the consumers' assessment of present and future economic conditions. The CSI is a leading indicator of consumer spending, which accounts for about two-thirds of U.S. economic activity.
Consumer Confidence Index ( CCI ) Releases
The Consumer Confidence Index is a survey that measures how optimistic or pessimistic consumers are regarding their expected financial situation.
Non-Farm Payroll (NFP) Releases
The Non-Farm Payroll (NFP) is a measure of the change in the number of employed persons, excluding farm workers and government employees. The NFP is a leading indicator of consumer spending, which accounts for about two-thirds of U.S. economic activity.
Yield Curve (1-10yr)Yield curve of the 1-10 year US Treasury Bonds, with over 60 years of history.
The Yield Curve is the interest rate on the 10 year bond minus the 1 year bond.
When it inverts (crosses under 0) a recession usually follows 6-12 months later.
It's a great leading indicator to identify risk in the macroeconomic environment.
Yield curves can be constructed on varying durations. Using a 1-year as the short-term bond provides a slightly faster response than the 2-year bond; and the 1-year has more historical data on TradingView.

Zig Zag+ (Macro + Internal Structure Tool)ZigZag+ (Macro + Internal Structure Tool)
ZigZag+ is a simple tool that helps traders to clearly identify and differentiate between macro and internal market structure, to help you keep your bearings of where you are currently in the overall picture.
It is especially difficult to keep your bearings within the larger structural trend when trading the lower timeframes, where for example, a bearish structural trend on a lower timeframe may simply be a retracement of an overall bullish structural trend on a higher timeframe. This indicator primarily aims to help traders maintain awareness of where they are in relationship to the higher timeframe / 'macro' structural trend, and their most significant swing point highs and lows.
The features of this indicator include:
- 2x Zig Zag lines drawn automatically onto your chart. One which has a longer length than the other, which can be used to help identify and differentiate the larger price swings from the smaller price swings found within it. Enabled by default.
- Customisable Zig Zag line color & width settings to help clearly differentiate the higher timeframe 'macro structure' apart from the lower timeframe 'internal structure' within it, enabling it to be tailored to suit your chart colour theme and personal preference.
- Customisable individual length settings for the 2x Zig Zag lines, to allow the fine tuning of each line to any timeframe and asset. By default one lines length is set to a higher value than the other, to illustrate a macro structure (higher length value) as well as the 'internal structure' (lower value length), seen within the larger macro structure.
- Up to a maximum of 500 lines can be drawn meaning you can zoom out considerably, and view historical price action with both Zig Zag lines continuing to print.
- Custom alerts for identifying candlesticks that can offer optimal entries where they are found within valid price markups or markdowns that are already underway. Further details can be found within the tooltips for these signals.
Note: The above list of features are accurate at the time of publishing, but may be updated or added to in future.
Structure
Understanding structure is arguably the foundation of all trading strategies, and therefore very important to understand where you are exactly in the bigger picture, since it can help identify levels at which there is a higher probability of price moving either upward or downward at a given point. Structural trend refers to the typical way that price tends to move in any given trending market, identified by the continuation of higher highs and higher lows in a typical bullish trending market, and lower highs and lower lows in a bearish trending market.
During other times price may not be trending in this way, for example when it is undergoing accumulation or distribution phases, where the consistent higher high & lower low / lower high and lower low patterns will not be evident.
What is Macro Structure?
Macro trend structure refers to the structural trend seen on higher timeframe charts.
What is Internal Structure?
Internal trend structure refers to the structural trend seen on lower timeframe charts, which is found within the higher timeframe structure.
Disclaimer: This indicator is adapted from an original script authored by Tr0sT . With special thanks.

Yield Curve (2-10yr)Yield curve of the 2-10 year US Treasury Bonds, with over 50 years of history.
The Yield Curve is the interest rate on the 10 year bond minus the 2 year bond.
When it inverts (crosses under 0) a recession usually follows 6-12 months later.
It's a great leading indicator to identify risk in the macroeconomic environment.

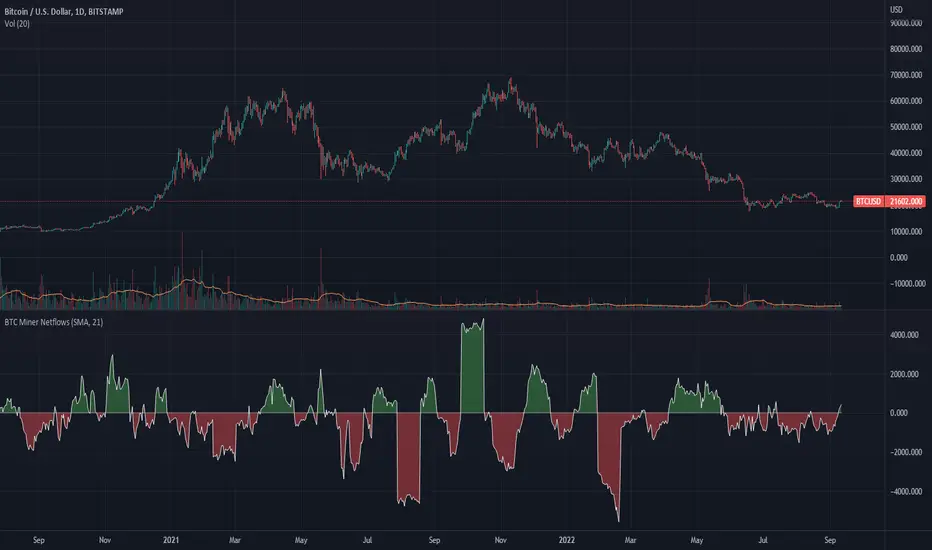
BTC Miner Netflows with smoothingBTC Miner Netflows with smoothing - shows the difference between Miner Inflow and Miner Outflow.
Miner income, sales as well as holdings, are generally considered to have a huge market impact, by analyzing miner Netflows, users can gauge if overall miners are accumulating or selling; high positive values point to accumulation, while negative numbers indicate net selling.
Data queried from IntoTheBlock.
BTC Hashrate ribbonsBTC Hash Rate ribbons / Hash Rate cross
This strategy goes long when BTCs Hash Rate 30 day moving average crosses above the 60 day moving average, signifying that miner capitulation is over and recovery has started.
When the opposite signal is given, which signifies the beginning of miner capitulation, the strategy goes short (or flat, depending on configuration). This is generally considered the most popular Hash Rate related strategy.
The strategy is based on this medium article: medium.com
Thanks to the recent integration of IntoTheBlock data into Tradingview, we can now effortlessly show Hash Rate data on our chart,
keep in mind however, that IntoTheBlock doesn't provide Hash Rate data on timeframes below daily, so this strategy is based used on the daily, weekly or even monthly time frames.
Hash Rate definition:
The Bitcoin hash rate is the number of times per second that computers on the Bitcoin network are hashing data to verify transactions and perform the encryption that secures the network. The hash rate is an indicator of how healthy the Bitcoin network is at any given time, and is driven primarily by difficulty mining and the number of miners. Generally, a high hash rate is considered a good thing.
More precisely, the Bitcoin hash rate is the number of times per second that computers on the Bitcoin network are hashing data to verify transactions and perform the encryption that secures the network.
