LeafAlgo Premium Macro StrategiesA "macro score", as defined here, is created by giving various weights to different signals and adding them together to get one smooth score. Positive or negative values are assigned to each of the signals depending on if the statement is true or false (e.g. DPO > 0: +1, DPO < 0: -1). This manner of strategy allows for a subset of the available signals to be present at one time as opposed to every technical signal having to be active in order for a long/short signal to trigger.
This strategy contains SIX different macro score strategies -- "Base DFMA", "Base DFMG", "Ichimoku", "TSI", "Donchian DFMA", and "Donchian DFMG". These strategies have the signals and weights pre-determined in the code. The "Base DFMA" strategy is based on our Democratic Fibonacci Moving Average (DFMA) indicator; the "Donchian DFMA" is the same as the base DFMA strategy, but with a signal from our Donchian Cloud Score indicator as added confluence. The "Base DFMG" strategy is based on our Democratic Fibonacci McGinley Dynamics (DFMG) indicator; the "Donchian DFMG" is the same, but with the Donchian Cloud Score as added confluence. The "Ichimoku" strategy is based on the major sub-indicators found within an Ichimoku Cloud in addition to our Donchian Cloud Score. The "TSI" strategy is based on the True Strength Index.
The ability to select your strategy of choice can be found at the top of the strategy settings under "Strategy Options", then in the drop-down menu labeled "Strategy Choice".
The DFMA - Democratic Fibonacci Moving Average - is a separate indicator that we have released that takes 10 different Fibonacci MAs (lengths of 3 to 233, at Fibonacci intervals) and averages them to form the DFMA line. This helps by creating a consensus on the trend based on moving averages alone. Crossovers of the DFMA with the various Fib MA lengths as well as a cross of the price source and these lines can provide adequate long and short signals. In the two DFMA strategies, the heaviest weights have been given to crosses of the DFMA line/Fib MA (233) as well as the crosses of the Fib MA (3)/DFMA. Additionally, there are thresholds for DPO ( Detrended Price Oscillator , above or below 0), CMO ( Chande Momentum Oscillator , above or below 0), Jurik Volatility Bands (above or below 0), and Stoch RSI (above or below 50). These four signals hold a lighter weight than the MA cross signals. The macro score itself ranges between -10 and 10. In addition to the macro score line, a momentum line (sourced by the macro score itself) has been included. A crossover/crossunder of the macro score and the macro momentum line is included into the long/short signal syntax in addition to a threshold for the macro score.
The DFMG - Democratic Fibonacci McGinley Dynamics - is a separate indicator that we have released that takes 10 different Fibonacci McGinley Dynamic liness (lengths of 3 to 233, at Fibonacci intervals) and averages them to form the DFMG line. This helps by creating a consensus on the trend based on moving averages alone. Crossovers of the DFMG with the various Fib MG lengths as well as a cross of the price source and these lines can provide adequate long and short signals. This strategy has the signals and weights pre-determined in the code. Heaviest weights have been given to crosses of the DFMG line/ McGinley (233) as well as the crosses of the McGinley (3)/DFMG. Additionally, there are thresholds for DPO ( Detrended Price Oscillator , above or below 0), CMO ( Chande Momentum Oscillator , above or below 0), Jurik Volatility Bands (above or below 0), and Stoch RSI (above or below 50). These four signals hold a lighter weight than the McGinley cross signals. The macro score itself ranges between -10 and 10. In addition to the macro score line, a momentum line (sourced by the macro score itself) has been included. A crossover/crossunder of the macro score and the macro momentum line is included into the long/short signal syntax in addition to a threshold for the macro score.
For the Ichimoku macro score, five signals were considered and weighted equally:
- Kijun-sen < Ichimoku Source
- Tenkan-sen < Ichimoku Source
- Kijun-sen > Chikou-span
- Tenkan-sen > Kijun-sen
- Senkou Span A > Senkou Span B
In addition to these factors, the Ichimoku strategy utilizes the Donchian Cloud Score in the long and short entry signals. Thus, the Donchian Cloud settings are applicable to this strategy.
For the True Strength Index strategy, the heaviest weights have been given to various TSI signals, including a crossover/crossunder of TSI signal and TSI value, a threshold for the TSI Signal (above or below 0), and a crossover/crossunder of the CMO ( Chande Momentum Oscillator ) and the TSI signal line. Additionally, there are thresholds for DPO ( Detrended Price Oscillator , above or below 0), Jurik Volatility Bands (above or below 0), and Stoch RSI (above or below 50). These three signals hold a lighter weight than the three TSI signals. The macro score itself ranges between -10 and 10. In addition to the macro score line, a momentum line (sourced by the macro score itself) has been included. A crossover/crossunder of the macro score and the macro momentum line is included into the long/short signal syntax in addition to a threshold for the macro score.
The Donchian Cloud Score is derived from a set of 5 Donchian channels (upper, lower, and basis plotted) defaulted to lengths of 25, 50, 100, 150, and 200. A set of conditions associated with the channels aims to determine ranging versus trending markets. Weights are given to these conditions accordingly, then tallied up to determine the "cloud score", ranging between -25 and 25. In general, a ranging market is determined by a cloud score between -10 and 10, while a positive trending market has a score higher than 10 and a negative trending market has a score lower than -10. That said, long and short thresholds similar to the macro score itself are included in the user settings and set to a default of 5 or -5. The cloud score is plotted as a line in the underlay with coloration reflecting ranging or trending markets (green color above the long threshold, gray between the thresholds, and red below the short threshold). The cloud score is incorporated into the strategy syntax for long and short positions in that the score must be above or below the set threshold for a trade to be placed. A breakdown for the Donchian scoring is as follows:
- Broke the 25-length DC (DC(25)) upper band in the previous 3 bars - +1 if true, 0 if false
- Broke the DC(50) upper band in the previous 3 bars - +2 if true, 0 if false
- Broke the DC(100) upper band in the previous 3 bars - +3 if true, 0 if false
- Broke the DC(150) upper band in the previous 3 bars - +4 if true, 0 if false
- Broke the DC(200) upper band in the previous 3 bars - +5 if true, 0 if false
- Broke the DC(25) lower band in the previous 3 bars - -1 if true, 0 if false
- Broke the DC(50) lower band in the previous 3 bars - -2 if true, 0 if false
- Broke the DC(100) lower band in the previous 3 bars - -3 if true, 0 if false
- Broke the DC(150) lower band in the previous 3 bars - -4 if true, 0 if false
- Broke the DC(200) lower band in the previous 3 bars - -5 if true, 0 if false
- DC(25) basis line above the DC(50) basis line - +1 if true, -1 if false
- DC(25) basis line above the DC(100) basis line - +1 if true, -1 if false
- DC(25)basis line above the DC(150) basis line - +1 if true, -1 if false
- DC(25) basis line above the DC(200) basis line - +1 if true, -1 if false
- DC(50) basis line above the DC(100) basis line - +1 if true, -1 if false
- DC(50) basis line above the DC(150) basis line - +1 if true, -1 if false
- DC(50) basis line above the DC(200) basis line - +1 if true, -1 if false
- DC(100) basis line above the DC(150) basis line - +1 if true, -1 if false
- DC(100) basis line above the DC(200) basis line - +1 if true, -1 if false
- DC(150) basis line above the DC(200) basis line - +1 if true, -1 if false
Thresholds for both the respective macro score and the Donchian Cloud score have been included. Entry signals for each strategy require the score to be >= the respective thresholds for longs and <= the respective thresholds for shorts.
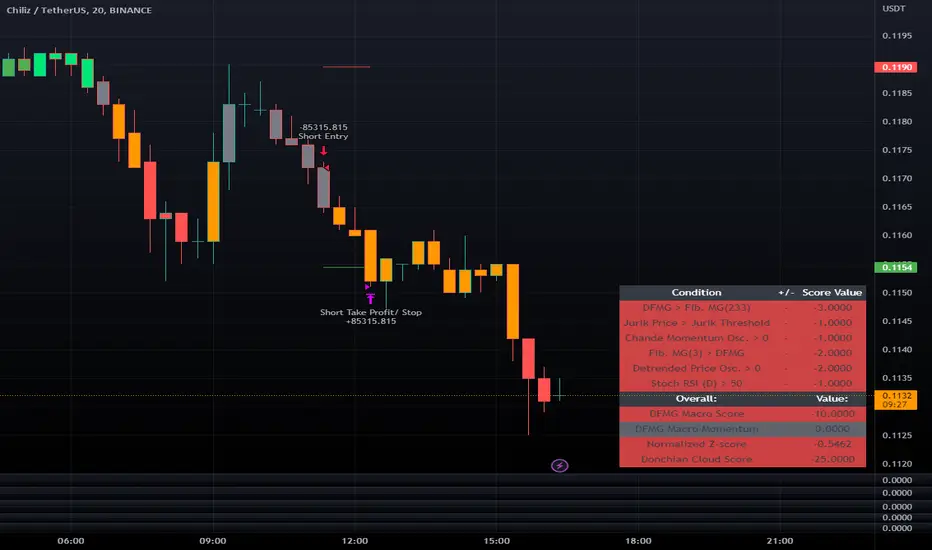
Additionally, a normalized z-score has been included. The z-score does not affect the entry and exit signals, however, it is displayed on the chart in the form of bar coloration. The z-score has been normalized to a range of -1 to +1. A z-score under -0.60 is displayed as a red bar color, a score between -0.60 and -0.2 is displayed as an orange bar color, a score between -0.2 and 0.2 is displayed as a gray bar color, a score between 0.2 and 0.6 is displayed as a lime bar color, and a score over 0.6 is displayed in green.
Data for each respective strategy will be displayed in an overlaid table. This includes the factors that comprise the macro score of choice, the values of each signal that adds up to the macro score, the macro score itself, the value of the momentum line of the macro score, the normalized z-score value, and the Donchian Cloud score (if applicable). Green coloration notes bullish sentiment within the signals or values, gray coloration is neutral, and red coloration notes bearish sentiment.
Take profit, stop loss, and trailing percentages are also included, found at the bottom of the Input tab under “TT and TTP” as well as “Stop Loss”. The take profit and stop loss levels will be reflected as green and red lines respectively on the chart as they occur. Make sure to understand the TP/SL ratio that you desire before use, as the desired hit rate/profitability percentage will be affected accordingly. The option for adding in a trailing stop has also been included, with options to choose between an ATR-based trail or a percentage-based trail. This strategy does NOT guarantee future returns. Apply caution in trading regardless of discretionary or algorithmic. Understand the concepts of risk/reward and the intricacies of each strategy choice before utilizing them in your personal trading.
Profitview/Pineconnector Settings:
If you wish to utilize Profitview’s automation system, find the included “Profitview Settings” under the Input tab of the strategy settings menu. If not, skip this section entirely as it can be left blank. Options will be “OPEN LONG TITLE”, “OPEN SHORT TITLE”, “CLOSE LONG TITLE”, and “CLOSE SHORT TITLE”. If you wished to trade SOL, for example, you would put “SOL LONG”, “SOL SHORT”, “SOL CLOSE LONG”, and “SOL CLOSE SHORT” in these areas. Within your Profitview extension, ensure that your Alerts all match these titles. To set an alert for use with Profitview, go to the “Alerts” tab in TradingView, then create an alert. Make sure that your desired asset and timeframe are currently displayed on your screen when creating the alert. Under the “Condition” option of the alert, select the strategy, then select the expiration time. If using TradingView Premium, this can be open-ended. Otherwise, select your desired expiration time and date. This can be updated whenever desired to ensure the strategy does not expire. Under “Alert actions”, nothing necessarily needs to be selected unless so desired. Leave the “Alert name” option empty. For the “Message”, delete the generated message and replace it with {{strategy.order.alert_message}} and nothing else. If using Pineconnector, follow the same directions for setting up an alert, but use the ",buy,,risk=" syntax as noted in the tooltips.
Mcginleydynamic
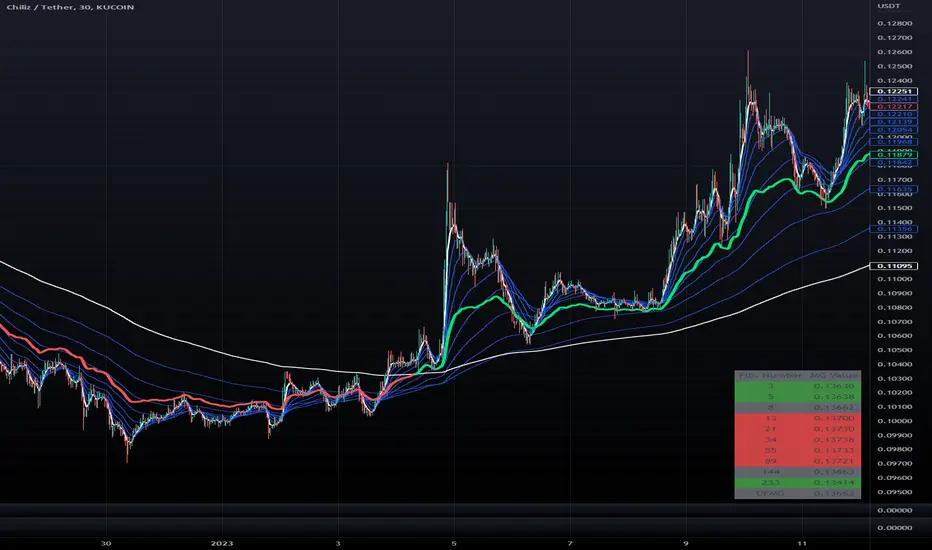
Democratic Fibonacci McGinley DynamicsWith this indicator, we have taken McGinley Dynamic lines at Fibonacci lengths (3 to 233) as well as the average of these values, labeled the DFMG (Democratic Fib. McGinley). Additionally, these values have been inputted into a table overlay. The cross of the FibMG(233) and the DFMG can be used as a signal for long or short.
The FibMG lengths of 3 and 233 are plotted in white by default, the FibMGs with lengths between 3 and 233 are plotted in blue by default, and the democratic line (DFMG) that averages these lines is plotted in green or red depending on if the value is above or below the 233-length FibMG.
This is the same indicator as our DFMA except using McGinley Dynamic lines as opposed to exponential moving averages.
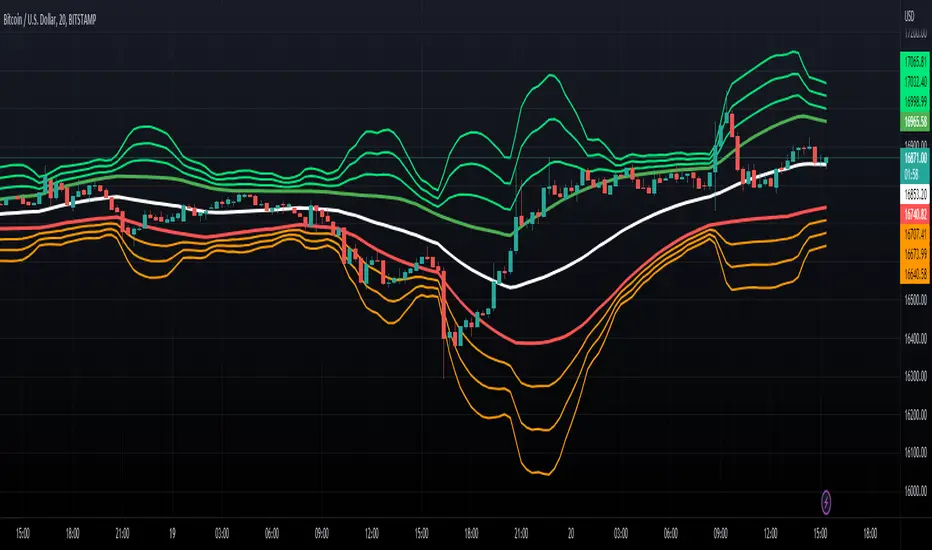
McGinley Dynamic x Donchian ChannelsThis indicator combines the McGinley Dynamic and Donchian Channels by taking the lowest and highest values over a set length (defaulted to 14) then applying the McGinley Dynamic math to these values. The upper range is denoted by a green line while the lower range is denoted by a red line. Additionally, standard deviations of 1, 2, and 3 have been put in place using the upper and lower values as the basis for the deviations as opposed to the baseline average of the upper and lower bands. These deviations are plotted as lime and orange colors. These channels can be used to determine when the price is gaining or losing momentum based on the distance between the channels. Otherwise, the channels can be used to determine potential overbought and oversold levels.
McGinley Dynamic Backtest (Simple) [Loxx]Simple backtest for McGinley Dynamic found here:
What this backtest includes:
-Longs and shorts
-Customization of inputs for McGinley Dynamic calculation
-Take profit 1 (TP1), and Stop-loss (SL), calculated using standard RMA-smoothed true range
-Activation of TP1 after entry candle closes
Happy trading!

McGinley Dynamic [Loxx]The McGinley Dynamic indicator is a type of moving average that was designed to track the market better than existing moving average indicators. It is a technical indicator that improves upon moving average lines by adjusting for shifts in market speed.
Included:
- Various average modes to fine-tune the signal
This is an exact clone of the McGinley Dynamic MT4 indicator

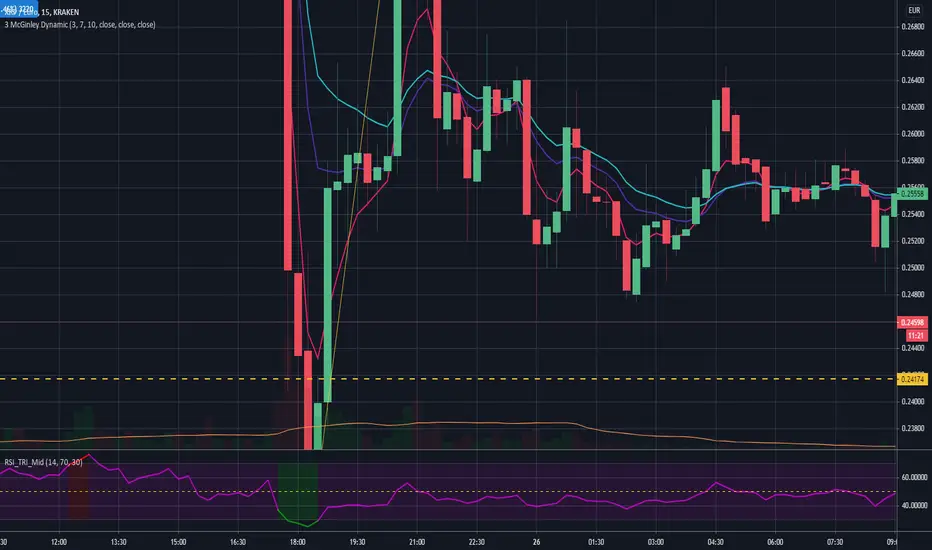
3 McGinley DynamicI recently found out about McGinley dynamic and its capability to respond better to market's speed changes when compared with EMA. I was doing some tests on previous charts and I've noticed that according with the risk you want to take there are different intervals which can suits you. For example MG3 is very responsive, I've noticed that it's better if you want to enter long positions, on the other side is unreliable for shorting. Mg10 is instead the slower one but I've noticed is perfect for shorting and opposed to Mg3 tends to identify upper trends too late making the investor losing profit. I've introduced Mg7 to make comparison with the others, when you're uncertain between 3 and 10 you can compare them with the 7.
I encourage everyone to define its own strategy, I've just explained how I'm gonna use it. Do your tests before using it otherwise you could lose money.
McGinley Dynamic (Improved) - John R. McGinley, Jr.For all the McGinley enthusiasts out there, this is my improved version of the "McGinley Dynamic", originally formulated and publicized in 1990 by John R. McGinley, Jr. Prior to this release, I recently had an encounter with a member request regarding the reliability and stability of the general algorithm. Years ago, I attempted to discover the root of it's inconsistency, but success was not possible until now. Being no stranger to a good old fashioned computational crisis, I revisited it with considerable contemplation.
I discovered a lack of constraints in the formulation that either caused the algorithm to implode to near zero and zero OR it could explosively enlarge to near infinite values during unusual price action volatility conditions, occurring on different time frames. A numeric E-notation in a moving average doesn't mean a stock just shot up in excess of a few quintillion in value from just "10ish" moments ago. Anyone experienced with the usual McGinley Dynamic, has probably encountered this with dynamically dramatic surprises in their chart, destroying it's usability.
Well, I believe I have found an answer to this dilemma of 'susceptibility to miscalculation', to provide what is most likely McGinley's whole hearted intention. It required upgrading the formulation with two constraints applied to it using min/max() functions. Let me explain why below.
When using base numbers with an exponent to the power of four, some miniature numbers smaller than one can numerically collapse to near 0 values, or even 0.0 itself. A denominator of zero will always give any computational device a horribly bad day, not to mention the developer. Let this be an EASY lesson in computational division, I often entertainingly express to others. You have heard the terminology "$#|T happens!🙂" right? In the programming realm, "AnyNumber/0.0 CAN happen!🤪" too, and it happens "A LOT" unexpectedly, even when it's highly improbable. On the other hand, numbers a bit larger than 2 with the power of four can tremendously expand rapidly to the numeric limits of 64-bit processing, generating ginormous spikes on a chart.
The ephemeral presence of one OR both of those potentials now has a combined satisfactory remedy, AND you as TV members now have it, endowed with the ever evolving "Power of Pine". Oh yeah, this one plots from bar_index==0 too. It also has experimental settings tweaks to play with, that may reveal untapped potential of this formulation. This function now has gain of function capabilities, NOT to be confused with viral gain of function enhancements from reckless BSL-4 leaking laboratories that need to be eternally abolished from this planet. Although, I do have hopes this imd() function has the potential to go viral. I believe this improved function may have utility in the future by developers of the TradingView community. You have the source, and use it wisely...
I included an generic ema() plot for a basic comparison, ultimately unveiling some of this algorithm's unique characteristics differing on a variety of time frames. Also another unconstrained function is included to display some the disparities of having no limitations on a divisor in the calculation. I strongly advise against the use of umd() in any published script. There is simply just no reason to even ponder using it. I also included notes in the script to warn against this. It's funny now, but some folks don't always read/understand my advisories... You have been warned!
NOTICE: You have absolute freedom to use this source code any way you see fit within your new Pine projects, and that includes TV themselves. You don't have to ask for my permission to reuse this improved function in your published scripts, simply because I have better things to do than answer requests for the reuse of this simplistic imd() function. Sufficient accreditation regarding this script and compliance with "TV's House Rules" regarding code reuse, is as easy as copying the entire function as is. Fair enough? Good! I have a backlog of "computational crises" to contend with, including another one during the writing of this elaborate description.
When available time provides itself, I will consider your inquiries, thoughts, and concepts presented below in the comments section, should you have any questions or comments regarding this indicator. When my indicators achieve more prevalent use by TV members, I may implement more ideas when they present themselves as worthy additions. Have a profitable future everyone!

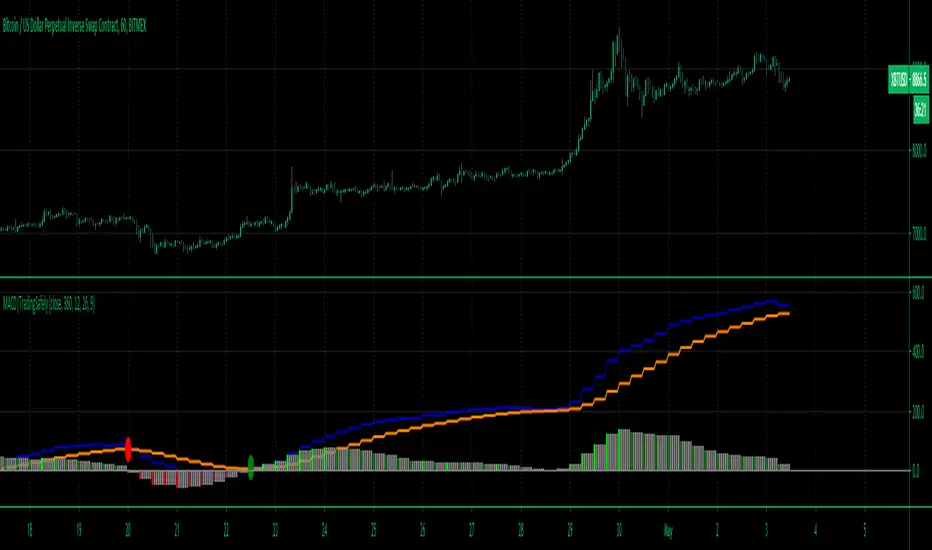
Trading Safely Multiple Time Frame Dynamic MACDOur Multi-Time frame MACD is a Zero-Lag (well near zero-lag) We make this claim because MACD utilizes Moving Averages and as you know moving averages are lagging indicators.
For our MACD we utilize The McGinley Dynamic which looks like a moving average line yet it is a smoothing mechanism for prices that turns out to track far better than any moving average.
The McGinley Dynamic minimizes price separation, price whipsaws and hugs prices much more closely.
The McGinley Dynamic does this automatically as this is a factor of the formula.
Because of the calculation, the Dynamic Line speeds up in down markets as it follows prices yet moves more slowly in up markets.
As traders we want to be quick to sell in a down market, yet ride an up market as long as possible.
How to Trade.
It best to use lower time frame charts and higher time frame MACD settings such as 1H chart and 6H (360min) MACD time frame
You can input any time frame in minutes from 1 min to 1440 minutes on the MACD settings.
1H = 60
2H = 120
3H = 180
4H = 240
6H = 360
12H = 720
24H = 1440
Week = W
Month = M
You can set alerts for bullish and bearish crossovers which are good indications of a potential entry into a long or short trade.
shout out to lonesometheblue for inspiration.
McGinley Dynamic IndicatorMcGinley Dynamic is a technical indicator developed by a market technician, R. McGinley in 1997
I based my indicator from code by everget so you should go follow him if you aren't already!
I had issues with the default version of this indicator using different lengths so this is my fix for those issues. This follows the price very closely especially when the stock is falling. I have color coded so go long when it is green and short when it is red.
Let me know if you would like me to write any other scripts for indicators out there!
