Inter-Exchanges Crypto Price Spread Clouds (Tartigradia)Display variations in min-max and median values of high, low and close across exchanges. It's a kind of realized volatility indicator, as the idea is that in times of high volatility (high emotions, fear, uncertainty), it's more likely that market inefficiencies will appear for the same asset between different market makers, ie, the price can temporarily differ a lot. This indicator will catch these instants of high differences between exchanges, even if they lasted only an instant (because we use high and low values).
Compared with my other "Inter-Exchanges Crypto Price Spread Deviation" indicator, this one overlays directly on the chart, and offers a different take based on the same premisses. Instead of summarizing volatility via standard deviation, here we display clouds of the range of values that were observed.
A big advantage of this approach is that it can also be used to determine safe stop loss levels, especially the values of percentile rank (i.e., what are the high values that were observed in at least 50% of exchanges?).
Indeed, all price levels are displayed in the indicator's status bar:
green for high values,
red for low values,
aqua for median,
purple for average,
The first two values are max and min values of high across exchanges (in green).
The next two values are max and min of low across exchanges (in red).
The next two values are median (aqua) and average (purple).
The last two values are percentile rank values for high (green) and low (red) respectively.
Another advantage is that the high (green) vs low (red) clouds can be seen as representing the buying or selling pressure respectively across exchanges, and this may in itself provide a signal to know whether one side is winning.
Link to my other complementary indicator:
Compared to other inter-exchanges spread indicators, this one offers two major features:
The symbol automatically adapts to the symbol currently selected in user's chart. Hence, switching between tickers does not require the user to modify any option, everything is dynamically updated behind the scenes.
It's easy to add more exchanges (requires some code editing because PineScript v5 does not allow dynamical request.security() calls).
Limitations/things to know:
History is limited to what the ticker itself display. Ie, even if the exchanges specified in this indicator have more data than the ticker currently displayed in the user's chart, the indicator will show only a timeperiod as long as the chart.
The indicator can manage multiple exchanges of different historical length (ie, some exchanges having more data going way earlier in the past than others), in which case they will simply be ignored from calculations when far back in the past. Hence, you should be aware that the further you go in the past, the less exchanges will have such data, and hence the less accurate the measures will be (because the deviation will be calculated from less sources than more recent bars). This is thanks to how the array.* math functions behave in case of na values, they simply skip them from calculations, contrary to math.* functions.
Median

Trend BandsThis script is, yet again, another mean reversion indicator. When the trend index touches the upper / lower bands, there seems to be a decent probability that the market might reverse at that area. However, I do emphasise on exercising caution when trading against the current wave of the market as there are instances where the trend index extends past the upper / lower bands for a prolonged period of time. However, in a non-trending semi-consolidated market, this script seems to do quite well for itself. Enjoy!

Variety N-Tuple Moving Averages w/ Variety Stepping [Loxx]Variety N-Tuple Moving Averages w/ Variety Stepping is a moving average indicator that allows you to create 1- 30 tuple moving average types; i.e., Double-MA, Triple-MA, Quadruple-MA, Quintuple-MA, ... N-tuple-MA. This version contains 2 different moving average types. For example, using "50" as the depth will give you Quinquagintuple Moving Average. If you'd like to find the name of the moving average type you create with the depth input with this indicator, you can find a list of tuples here: Tuples extrapolated
Due to the coding required to adapt a moving average to fit into this indicator, additional moving average types will be added as they are created to fit into this unique use case. Since this is a work in process, there will be many future updates of this indicator. For now, you can choose from either EMA or RMA.
This indicator is also considered one of the top 10 forex indicators. See details here: forex-station.com
Additionally, this indicator is a computationally faster, more streamlined version of the following indicators with the addition of 6 stepping functions and 6 different bands/channels types.
STD-Stepped, Variety N-Tuple Moving Averages
STD-Stepped, Variety N-Tuple Moving Averages is the standard deviation stepped/filtered indicator of the following indicator
Last but not least, a big shoutout to @lejmer for his help in formulating a looping solution for this streamlined version. this indicator is speedy even at 50 orders deep. You can find his scripts here: www.tradingview.com
How this works
Step 1: Run factorial calculation on the depth value,
Step 2: Calculate weights of nested moving averages
factorial(depth) / (factorial(depth - k) * factorial(k); where depth is the depth and k is the weight position
Examples of coefficient outputs:
6 Depth: 6 15 20 15 6
7 Depth: 7 21 35 35 21 7
8 Depth: 8 28 56 70 56 28 8
9 Depth: 9 36 34 84 126 126 84 36 9
10 Depth: 10 45 120 210 252 210 120 45 10
11 Depth: 11 55 165 330 462 462 330 165 55 11
12 Depth: 12 66 220 495 792 924 792 495 220 66 12
13 Depth: 13 78 286 715 1287 1716 1716 1287 715 286 78 13
Step 3: Apply coefficient to each moving average
For QEMA, which is 5 depth EMA , the calculation is as follows
ema1 = ta. ema ( src , length)
ema2 = ta. ema (ema1, length)
ema3 = ta. ema (ema2, length)
ema4 = ta. ema (ema3, length)
ema5 = ta. ema (ema4, length)
In this new streamlined version, these MA calculations are packed into an array inside loop so Pine doesn't have to keep all possible series information in memory. This is handled with the following code:
temp = array.get(workarr, k + 1) + alpha * (array.get(workarr, k) - array.get(workarr, k + 1))
array.set(workarr, k + 1, temp)
After we pack the array, we apply the coefficients to derive the NTMA:
qema = 5 * ema1 - 10 * ema2 + 10 * ema3 - 5 * ema4 + ema5
Stepping calculations
First off, you can filter by both price and/or MA output. Both price and MA output can be filtered/stepped in their own way. You'll see two selectors in the input settings. Default is ATR ATR. Here's how stepping works in simple terms: if the price/MA output doesn't move by X deviations, then revert to the price/MA output one bar back.
ATR
The average true range (ATR) is a technical analysis indicator, introduced by market technician J. Welles Wilder Jr. in his book New Concepts in Technical Trading Systems, that measures market volatility by decomposing the entire range of an asset price for that period.
Standard Deviation
Standard deviation is a statistic that measures the dispersion of a dataset relative to its mean and is calculated as the square root of the variance. The standard deviation is calculated as the square root of variance by determining each data point's deviation relative to the mean. If the data points are further from the mean, there is a higher deviation within the data set; thus, the more spread out the data, the higher the standard deviation.
Adaptive Deviation
By definition, the Standard Deviation (STD, also represented by the Greek letter sigma σ or the Latin letter s) is a measure that is used to quantify the amount of variation or dispersion of a set of data values. In technical analysis we usually use it to measure the level of current volatility .
Standard Deviation is based on Simple Moving Average calculation for mean value. This version of standard deviation uses the properties of EMA to calculate what can be called a new type of deviation, and since it is based on EMA , we can call it EMA deviation. And added to that, Perry Kaufman's efficiency ratio is used to make it adaptive (since all EMA type calculations are nearly perfect for adapting).
The difference when compared to standard is significant--not just because of EMA usage, but the efficiency ratio makes it a "bit more logical" in very volatile market conditions.
See how this compares to Standard Devaition here:
Adaptive Deviation
Median Absolute Deviation
The median absolute deviation is a measure of statistical dispersion. Moreover, the MAD is a robust statistic, being more resilient to outliers in a data set than the standard deviation. In the standard deviation, the distances from the mean are squared, so large deviations are weighted more heavily, and thus outliers can heavily influence it. In the MAD, the deviations of a small number of outliers are irrelevant.
Because the MAD is a more robust estimator of scale than the sample variance or standard deviation, it works better with distributions without a mean or variance, such as the Cauchy distribution.
For this indicator, I used a manual recreation of the quantile function in Pine Script. This is so users have a full inside view into how this is calculated.
Efficiency-Ratio Adaptive ATR
Average True Range (ATR) is widely used indicator in many occasions for technical analysis . It is calculated as the RMA of true range. This version adds a "twist": it uses Perry Kaufman's Efficiency Ratio to calculate adaptive true range
See how this compares to ATR here:
ER-Adaptive ATR
Mean Absolute Deviation
The mean absolute deviation (MAD) is a measure of variability that indicates the average distance between observations and their mean. MAD uses the original units of the data, which simplifies interpretation. Larger values signify that the data points spread out further from the average. Conversely, lower values correspond to data points bunching closer to it. The mean absolute deviation is also known as the mean deviation and average absolute deviation.
This definition of the mean absolute deviation sounds similar to the standard deviation (SD). While both measure variability, they have different calculations. In recent years, some proponents of MAD have suggested that it replace the SD as the primary measure because it is a simpler concept that better fits real life.
For Pine Coders, this is equivalent of using ta.dev()
Bands/Channels
See the information above for how bands/channels are calculated. After the one of the above deviations is calculated, the channels are calculated as output +/- deviation * multiplier
Signals
Green is uptrend, red is downtrend, yellow "L" signal is Long, fuchsia "S" signal is short.
Included:
Alerts
Loxx's Expanded Source Types
Bar coloring
Signals
6 bands/channels types
6 stepping types
Related indicators
3-Pole Super Smoother w/ EMA-Deviation-Corrected Stepping
STD-Stepped Fast Cosine Transform Moving Average
ATR-Stepped PDF MA

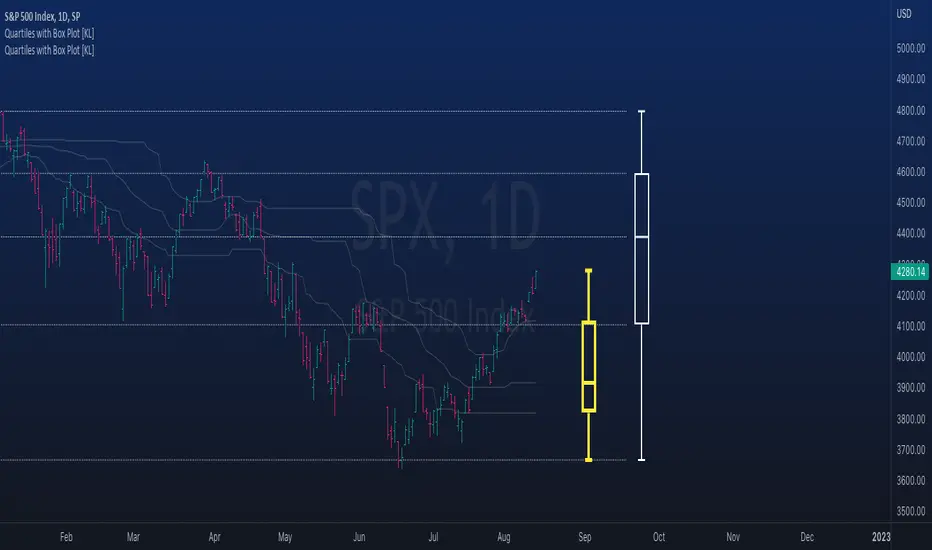
Rolling QuartilesThis script will continuously draw a boxplot to represent quartiles associated with data points in the current rolling window.
Description :
A quartile is a statistical term that refers to the division of a dataset based on percentiles.
Q1 : Quartile 1 - 25th percentile
Q2 : Quartile 2 - 50th percentile, as known as the median
Q3 : Quartile 3 - 75th percentile
Other points to note:
Q0: the minimum
Q4: the maximum
Other properties :
- Q1 to Q3: a range is known as the interquartile range ( IQR ). It describes where 50% of data approximately lie.
- Line segments connecting IQR to min and max (Q0→Q1, and Q3→Q4) are known as whiskers . Data lying outside the whiskers are considered as outliers. However, such extreme values will not be found in a rolling window because whenever new datapoints are introduced to the dataset, the oldest values will get dropped out, leaving Q0 and Q4 to always point to the observable min and max values.
Applications :
This script has a feature that allows moving percentiles (moving values of Q1, Q2, and Q3) to be shown. This can be applied for trading in ways such as:
- Q2: as alternative to a SMA that uses the same lookback period. We know that the Mean (SMA) is highly sensitive to extreme values. On the other hand, Median (Q2) is less affected by skewness. Putting it together, if the SMA is significantly lower than Q2, then price is regarded as negatively skewed; prices of a few candles are likely exceptionally lower. Vice versa when price is positively skewed.
- Q1 and Q3: as lower and upper bands. As mentioned above, the IQR covers approximately 50% of data within the rolling window. If price is normally distributed, then Q1 and Q3 bands will overlap a bollinger band configured with +/- 0.67x standard deviations (modifying default: 2) above and below the mean.
- The boxplot, combined with TradingView's builtin bar replay feature, makes a great tool for studies purposes. This helps visualization of price at a chosen instance of time. Speaking of which, it can also be used in conjunction with a fixed volume profile to compare and contrast the effects (in terms of price range) with and without consideration of weights by volume.
Parameters :
- Lookback: The size of the rolling window.
- Offset: Location of boxplot, right hand side relative to recent bar.
- Source data: Data points for observation, default is closing price
- Other options such as color, and whether to show/hide various lines.
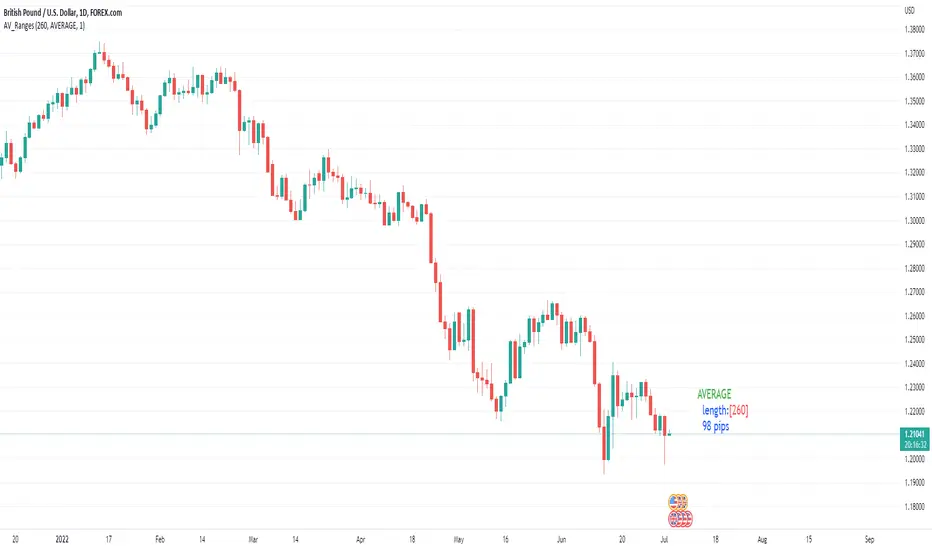
Average, Median, Mode, Biggest: Pip Range Measures & LabelsApply various simple statistical measures to series of full candle ranges over user input length (in bars).
Choose between AVERAGE, MEDIAN, MODE, BIGGEST.
All calculations derive from the high-low range of a candle.
Default length = 260, the number of daily candles in a year.
MODE is calculated from pip ranges rounded to reasonable increments (to nearest 10pips foreign currencies; to nearest 100 pips for DXY ; nearest $10 for other assets). Best only use MODE for the major FX pairs encoded, and on Daily timeframe .
User input 'unit multiplier' only applies when asset is NOT a major Forex pair (unit and multiplier is auto applied for for major FX pairs).
© twingall
Ehlers Median Average Adaptive Filter [CC]The Median Average Adaptive Filter was created by John Ehlers and this is another in my current series of undiscovered gems. I'm sure you are all saying but Franklin, Ehlers doesn't have any undiscovered gems but in this case you would be wrong. This was actually an indicator so buried on the internet that I had to use the wayback machine to find the original source code. Ehlers notoriously hates adaptive moving averages which is funny because he has made a decent amount of them. This is a very unique indicator that uses a while loop to adjust the length and I thought it deserved some extra recognition from the TV community. I have included strong buy and sell signals in addition to normal ones so strong signals are darker in color and normal signals are lighter in color. Buy when the line turns green and sell when it turns red.
Let me know if there are any other scripts or indicators you would like to see me publish!

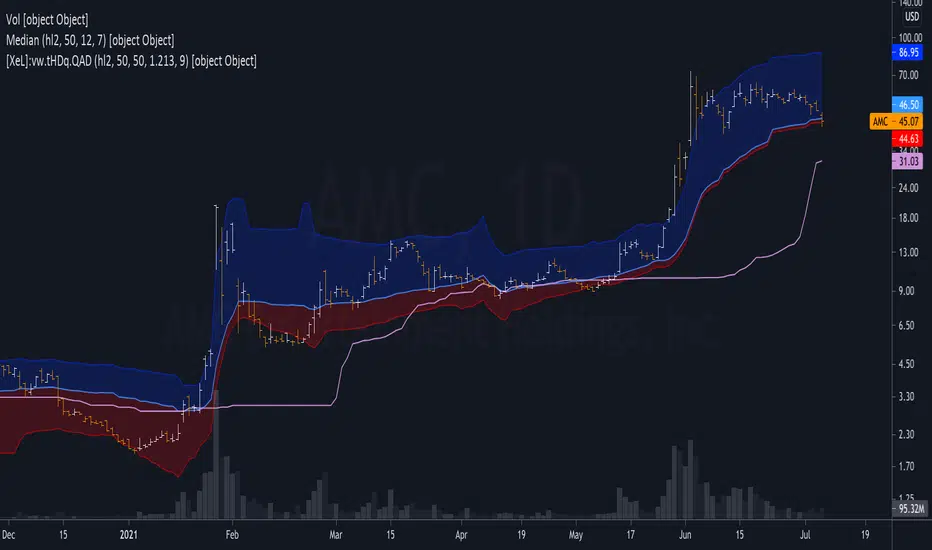
MA VisualizerThe MA Visualizer is made up of 5 Moving Averages (MA)
All MA change color when the price closes above or below the MA line.
The background between the MA line and price will also change color, this creates the Visualizer.
When two or more MA are selected the two visualizer's will combine and create a gradient effect.
Each MA can be adjusted with 6 source selection's to choose from (SMA , EMA , WMA , HMA , RMA , WVMA).
The Visualizer can be turned off while leaving the MA lines turned on and vice versa.
Their is also a MA Cross indicator built-in.

Median Convergence DivergenceIntroduction
The Median Convergence Divergence (MCD) is a derivative of the Moving Average Convergence Divergence (MACD). The difference is the change in the use of the measure of central tendency. In MACD, moving average (mean) is used, whereas, in MCD, the median is used instead. The purpose of using the median is to eliminate the outlying values, which would be calculated for a moving average. The outliers would affect the value of the moving average.
For example: 3, 5, 7, 8, 5, 4, 2, 1, 6, 21, 8. The data set average is 6.3, whereas the median value is 5. There is a difference of about 23% in the example. The reason is the outlying value '21' in the data set.
As the markets are volatile, outlying values can always emerge. A moving average will consider those values; on the other hand, the median will ignore. If the strategy calls for a tool to ignore the outliers, the Median Convergence Divergence would be a great centered oscillator.
The default values have changed to suit the current trading days in a week. When the MACD was introduced, there would be six trading days in a week. Therefore, it used 12 (2 weeks), 26(4 weeks), and 9 ( 1.5 weeks). But now that there are five trading days per week. The default values are adapted to them. Feel free to change them as per your wish.
Recommended Settings
The current settings are set to be used for the Daily Time Frame: 5 day period for the fast line, a 20 day period for the slow line, and a 10 day period for the signal line. (5 days represent a trading week, 10 days is two weeks, and 20 days is 4 weeks or a month)
For the weekly charts, use 4 week period for the fast line, 13 week period for the slow line, and 8 week period for the signal line. (4 weeks represent a month, 8 weeks is two months, and 13 weeks is 3 months or quarterly)
And for monthly charts, use 3 month period for the fast line, 12 month period for the slow line, and 6 month period for the signal line. (3 months is quarterly, 6 months is bi-yearly, and 12 month is yearly)
It'll be challenging to measure for intraday since there are many different timeframes within intraday. The settings mentioned above should also be customized as per the requirements of the trading strategy.
Strategy
The strategy application is the same as the MACD, i.e., Signal Line Crossovers, Zero Line Crossovers, and Divergence.
Signal Line Crossovers: When the MCD line crosses above the Signal line, it's a bullish crossover. When the MCD line crosses below the Signal line, it's a bearish crossover.
Zero Line Crossovers: It's a bullish crossover when the MCD line crosses above the Zero line. When the MCD line crosses below the Zero Line, it's a bearish crossover.
Divergence: When price shows a lower low, but MCD shows a higher low, it's a bullish divergence. When the price shows a higher high but MCD shows a lower high, it's a bearish divergence.
Using other indicators in conjunction with the Median Convergence Divergence is recommended to take entry and exit signals.

Média 8, 21, 56, 200 SEMANAL - Augusto BackesFique tranquilo, aqui tem todas as médias que o Backes utiliza dentro de um indicador só, aproveite :)

vol_rangesThis script shows three measures of volatility:
historical (hv): realized volatility of the recent past
median (mv): a long run average of realized volatility
implied (iv): a user-defined volatility
Historical and median volatility are based on the EWMA, rather than standard deviation, method of calculating volatility. Since Tradingview's built in ema function uses a window, the "window" parameter determines how much historical data is used to calculate these volatility measures. E.g. 30 on a daily chart means the previous 30 days.
The plots above and below historical candles show past projections based on these measures. The "periods to expiration" dictates how far the projection extends. At 30 periods to expiration (default), the plot will indicate the one standard deviation range from 30 periods ago. This is calculated by multiplying the volatility measure by the square root of time. For example, if the historical volatility (hv) was 20% and the window is 30, then the plot is drawn over: close * 1.2 * sqrt(30/252).
At the most recent candle, this same calculation is simply drawn as a line projecting into the future.
This script is intended to be used with a particular options contract in mind. For example, if the option expires in 15 days and has an implied volatility of 25%, choose 15 for the window and 25 for the implied volatility options. The ranges drawn will reflect the two standard deviation range both in the future (lines) and at any point in the past (plots) for HV (blue), MV (red), and IV (grey).

Weighted Harrell-Davis Quantile Estimator with AbsoluteDeviation
QUANTILE ESTIMATORS
Weighted Harrell-Davis Quantile Estimator with Absolute Deviation Fences.
DISCLAIMER:
The Following indicator/code IS NOT intended to be a formal investment advice or recommendation by the author, nor should be construed as such. Users will be fully responsible by their use regarding their own trading vehicles/assets.
The following indicator was made for NON LUCRATIVE ACTIVITIES and must remain as is, following TradingView's regulations. Use of indicator and their code are published for work and knowledge sharing. All access granted over it, their use, copy or re-use should mention authorship(s) and origin(s).
WARNING NOTICE!
THE INCLUDED FUNCTION MUST BE CONSIDERED FOR TESTING. The models included in the indicator have been taken from open sources on the web and some of them has been modified by the author, problems could occur at diverse data sceneries, compiler version, or any other externality.
Purpose:
Weighted Quantiles or <> are quite difficult to find on must systems, also it's non-weighted approach are rarely used to estimate the location parameter of price distribution WICH IS NOT NORMAL, all this in favour of it's non-robust counterpart, the Arithmetic rolling Mean or <> and it's weighted variants like the WMA, VWAP, etc.
Also, a big drawback from this is that must statistics derived from Normal-Distribution parameter location (the Mean) definitely will not fit for an efficient, nor robust estimation for price distributions, so their moments like the standard deviation, kurtosis, skewness, etc. will not be the better tools to build derived algorithms or technical indicators among price/volume.
In an effort searching better statistical tools for price distributions, I found the excellent work of Andrey Akinshin that took me to port some of their Math research contributions for the compute benchmarking field , and bring it here at the TradingView ecosystem to take a shot at the price distribution crazy fields. For a better detail of what the weighted Harrell-Davis Quantile Estimator can do, who better than drink directly from the source at References:
References:
Weighted Quantile Estimators.
DoubleMAD outlier detector based on the Harrell-Davis quantile estimator.
Unbiased median absolute deviation based on the Harrell-Davis quantile estimator.
Quantile confidence intervals for weighted samples.
Licensing:
This work is licensed under a Attribution-NonCommercial-ShareAlike 4.0 International Copyright (c) 2021 (CC BY-NC-SA 4.0)
Copyright's & Mentions:
The Gamma Functions & Beta Probability Density Functions C# implementations by the Math.NET Numerics, part of the Math.NET Project.
The Regularized Incomplete (Left) Beta Function C# implementation by the SAMTools, htslib project.
The Weighted Harrell-Davis Quantile estimator ; C# & R implementations by Andrey Akinshin.
External PineScript code, methods, support & consultancy by @PineCoders staff with special mention for:
+ "ma sorter ('sort by array' example)- JD" by @Duyck.
+ Porting, mods, compilation and debugging for this script by @XeL_Arjona for the TradingView's @PineCoders community.
Torben Median Evolved OscillatorExtending the Works of Torben Mogensen, on Torben Median
Median Filtering is an important technique !
The median filter is a non-linear digital filtering technique, often used to remove noise from an image or signal. Such noise reduction is a typical pre-processing step to improve the results of later processing (for example, edge detection on an image). Median filtering is very widely used in digital image processing because, under certain conditions, it preserves edges while removing noise (but see the discussion below), also having applications in signal processing.
Have taken two T-Medians
#1 of Length 13
#2 of Length 55
The Indicator plots the Relationship projection of Medians with the Closing Price as an Area Chart
Provision for Alerts
You get
> Green T-Median Alert
> Red T-Median Alert
Enjoy!

Torben Moving MedianThis method was pointed it out by Torben Mogensen.
It is certainly not the fastest way of finding a median, but it has the very interesting property that it does not modify the input array when looking for the median. It becomes extremely powerful when the number of elements to consider starts to be large, and copying the input array may cause enormous overheads. For read-only input sets of several hundred megabytes in size, it is the solution of choice, also because it accesses elements sequentially and not randomly. Beware that it needs to read the array several times though: a first pass is only looking for min and max values, further passes go through the array and come out with the median in little more time. The number of iterations is probably O(log(n)), although I have no demonstration of that fact.
What is Median Filtering
Median filtering is a commonly used technique in signal processing. Typically used on signals that may contain outliers skewing the usual statistical estimators, it is usually considered too expensive to be implemented in real-time or CPU-intensive applications.
Let us define the median of N numerical values by:
The median of a list of N values is found by sorting the input array in increasing order, and taking the middle value.
The median of a list of N values has the property that in the list there are as many greater as smaller values than this element.
How To trade
Trading is quite intuitive
Buy when the Price breaks-out the price which breaked the Torben Moving Median
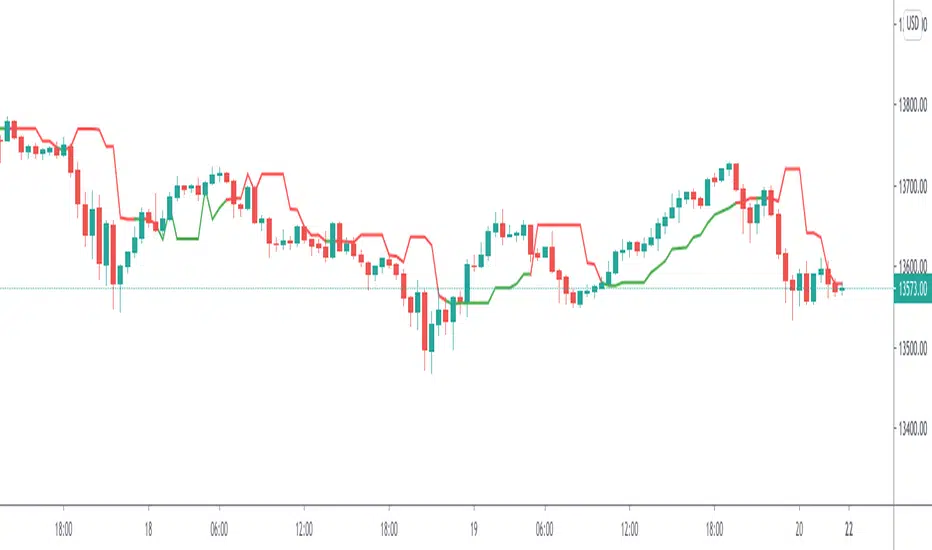
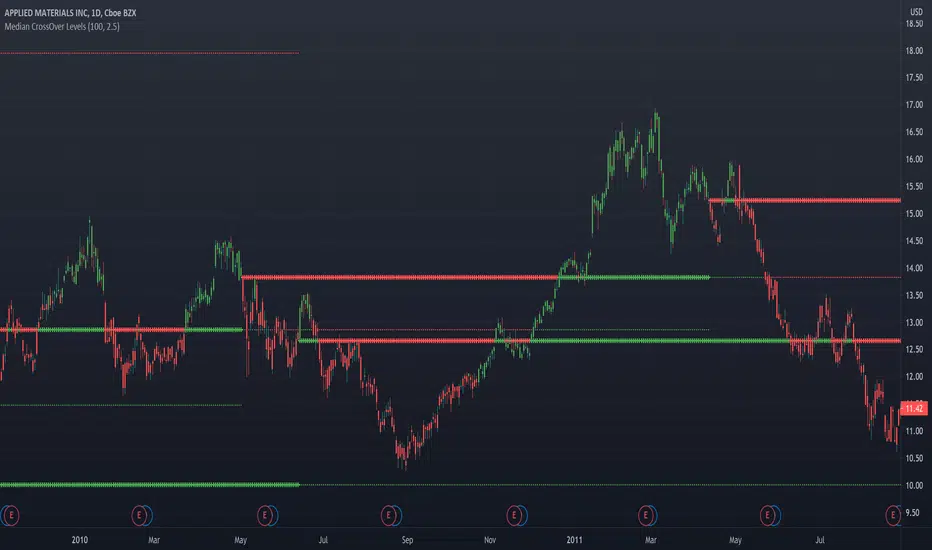
Median CrossOver LevelsPlots levels representing the prices that the stock closed above its n-period moving median(default=100).
2 thickest lines represents the two most recent crossover levels.
Candles are colored green if the price is currently above its moving median and red if below.
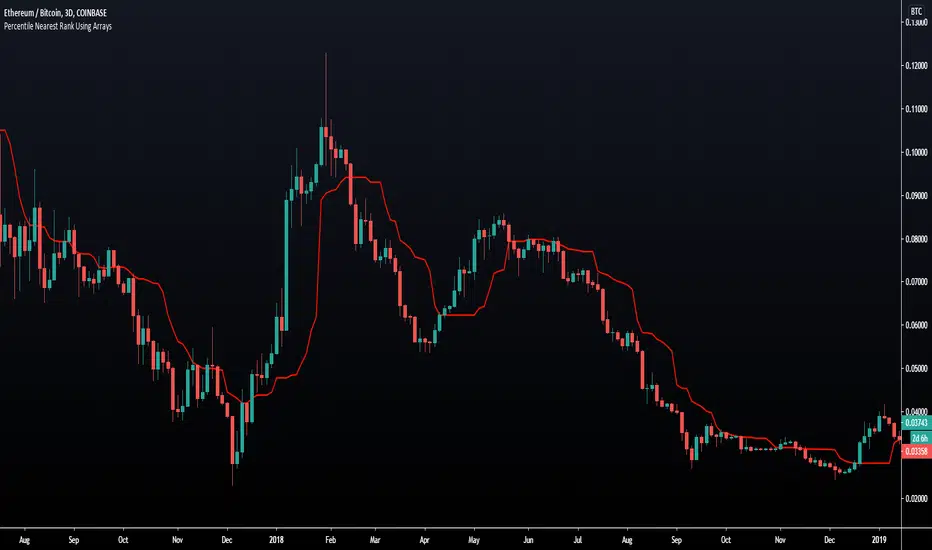
Percentile Nearest Rank Using Arrays [LuxAlgo]The new array feature is extremely powerful, as it will allow pinescript users to do more complex things, or compute existing calculations more efficiently, it will also be possible to shine some light to some already existing functions, one of them being percentile_nearest_rank .
We have been working on this new feature with our pal alexgrover, and made this script which computes a rolling percentile using the nearest rank method.
Settings
Length: Window of the rolling percentile, determine the number of past data to be used.
Percentage: Return the current value if Percentage % of the data fall below that value, the setting is in a range (0,100).
Src: Input source of the indicator.
Usage
A rolling percentile can have many usages when it comes to technical analysis, this is due to its ability to return the value of three common rolling statistics, the rolling median, which can be obtained using a percentage equal to 50, the rolling maximum, obtained with a percentage equal to 100, and the rolling minimum, obtained with a percentage equal to 0.
When we use our rolling percentile as a rolling median, we can obtain a robust estimation of the underlying trend in the price, while using it as a rolling maximum/minimum can allow us to determine if the market is trending, and at which direction. The rolling maximum/minimum is a rolling statistic used to calculate the well known stochastic oscillator and Donchian channel indicator.
We can also compute rolling quartiles, which can be obtained using a percentage of 25 or 75, with one of 25 returning the lower quartile and 75 the upper quartile.
In blue the upper rolling quartile (%75), in orange the lower rolling quartile (%25), both using a window size of 100.
Details
In order to compute a rolling percentile nearest rank, we must first take the most recent length closing prices, then order them in ascending order, we then return the value of the ordered observations at index (percentage/100*length) - 1 (we use - 1 because our array index starts at 0).
MedianBandsHere I propose another simple S/R band technique, works on all TF and all securities, this is again one of the simplest forms of logic with a little tweak to tackle modern volatile markets.
It enables us to trade both mean reversion as well as breakout trades as it works in both trending and non-trending markets. You can even use pre-existing ranges as good position management markers.
It requires little to no intervention from the user. The white line is the opening price of the day, I'm a big believer of that so you will find it everywhere in my indicators. :3
Past performance is not assurance of the future performance and this is for educational purposes only.
The script will be protected to avoid theft but you can add to your favorites to use it as you please.
Enjoy~

Spread by//Every spread & central tendency measure in 1 script with comfortable visualization, including scrips's status line.
Spread measures:
- Standard deviation (for most cases);
- Average deviation (if there are extreme values);
- GstDev - Geometric Standard Deviation (exclusively for Geometric Mean);
- HstDev - Harmonic Deviation (exclusively for Harmonic Mean).
These modified functions will calculate everything right, they will take source, length, AND basis of your choice, unlike the ones from TW.
Central tendency measures:
- Mean (if everything's cool & equal);
- Median (values clustering towards low/high part of the rolling window);
- Trimean (3/more distinguishable clusters of data);
- Midhinhe (2 distinguishable clusters of data);
- Geometric Mean ( |low.. ... ... .. .... ... . . . . . . . . . . . .high| this kinda data); <- Exp law
- Harmonic Mean { |low. . . . . . . . . . . . . . .. . . .high| kinda data). <- Reciprocal law
Listen:
1) Don't hesitate using Standard Deviation with non-mean, like "Midhinge Standard Devition", despite what ol' stats gurus gonna say, it works when it's appropriate;
2) Don't check log space while using Geometric Mean & Geometric Standard Deviation, these 2 implement log stuff by design, I mean unless u wanna make it double xd
3) You can use this script, modify it how you want, ask me questions whatever, just make money using it;
4) Use Midrange & Midpoints in tandem when data follows ~addition law (like this . . . . . . . . . . . . . . . . . . . . .). <- just addition law
Look at the data, choose spread measure first, then choose central tendency measure, not vice versa.
!!!
Ain't gonna place ® sign on standard deviations like one B guy did in 1980s lmao, but if your wanna use Harmonic Deviations in science/write about/cite it/whatever, pls give me a lil credit at least, I've never seen it anywhere and unfortunately had to develop it by myself. it's useful when your data develops by reciprocals law (opposite to exponential).
Peace TW

Range identifier by medianThis study tries to highlight ranges
as they are defined by
TradingLatino TradingView user.
The study uses median values.
A range is defined as periods when the price does not move a lot.
Its default values are aimed at BTCUSDT pair and 4h timeframe.
HOW IT WORKS
For each of the bars a '5' median is calculated based on the 'highest of open and close'
For each of the bars a '5' median is calculated based on the 'lowest of open and close'
Thanks to the desviation setting both medians
have a tolerated maximum and a minimum
Condition 1:
The bar current 'highest of open and close'
needs to be between the respective tolerated
maximum and minimum
Condition 2:
The bar current 'lowest of open and close'
needs to be between the respective tolerated
maximum and minimum
If both conditions are met
then the bar is in a range
SETTINGS
Price range periods : How many previous periods are used to calculate the medians
Price range maximum desviation (%) ( > 0 ): Maximum positive desviation for range detection
Price range minimum desviation (%) ( > 0 ): Mininum negative desviation for range detection
Desviations should be both of them a positive number
WARNING
Despite the name indicator does not identify the entire range.
It identifies when you realise you are inside a range.
E.g. If a range length is 8 periods length this range indicator
will highlight only the last 6 periods of the range.
USAGE
If your strategy signals you an upwards trend
then you might use this range detector
to know when to exit your long position
Why?
Because most of the times
the price is found to be
in a range it goes down
FEEDBACK 1
My former attempt on calculating ranges
felt too much over complex that is why
I decided to implement it with medians.
It should be easier to modify if
I want to desviation inputs to be calculated
automatically in the future.
I'm interested on different approaches on how to detect ranges.
FEEDBACK 2
I have only used this identifier in BTCUSDT 4h timeframe.
Feel free to comment down below with your suggested settings
for your favourite pair and timeframe
PINE SCRIPT TRICK
This script simulates looping an string char by char
in pine script.

Rolling summaryStatistical methods based on mean cannot be effective all the time when attributed to financial data since it doesn't usually follow normal distribution, the data can be skewed or/and have extreme values which can be described as outliers.
In order to deal with this problem it is appropriate to use median-based techniques.
The most common one is called five-number summary/box plot, which plots median of the dataset, 25th (Q1) & 75th (Q3) percentiles (the medians of lower & upper parts of the original dataset divided by the original median), and whiskers calculated by taking range between Q1 and Q3, multiplying it by 1.5 and adding it to Q3 and subtracting it from Q1. The values which are outside the whiskers are considered outliers. Default settings of the script correspond to the classic box plot.
Seven-number summary can be also plotted by this script, by turning on 4 additional percentiles/Bowley’s seven-figure summary by turning on first 2 additional percentiles and changing their values to 10 and 90 respectively.
P.S.: Mean can be also turned in just to check the difference.

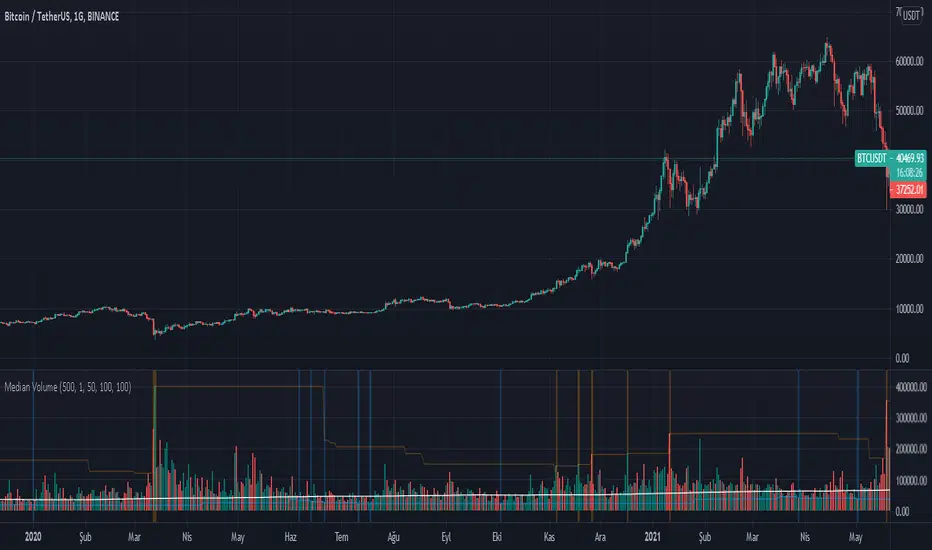
Recursive Median Filter by Jhon EhlersEN: Impulsive noise spikes or extreme price or volume data are not unusual in the financial markets and these extreme values can throw off your averaging calculations. Ehlers thinks, How can you set up a data filter to remove these extreme price movements? This Stocks & Commodities Contributing Editor shows you a way to handle this by using a filter that discards all data except the median value.
TR: Dürtüsel fiyat hareketleri, aşırı fiyatlamalar yada hacim artışları finansal piyasalarda olağan dışı değildir ve bu hareketler genelde ortalama hesaplarımızın savrulmasına sebep olur. Ehlers bu aşırı fiyat hareketliliklerinin neden olduğu ortalamalardaki bu savrulmanın nasıl kaldırıcağını düşünür ve medyan değer hariç tüm verileri silen bir filtre kullanarak bunu halletmenin bir yolunu bulur.

Recursive Median Oscillator by Jhon EhlersEN: Impulsive noise spikes or extreme price or volume data are not unusual in the financial markets and these extreme values can throw off your averaging calculations. Ehlers thinks, How can you set up a data filter to remove these extreme price movements? This Stocks & Commodities Contributing Editor shows you a way to handle this by using a filter that discards all data except the median value.
TR: Dürtüsel fiyat hareketleri, aşırı fiyatlamalar yada hacim artışları finansal piyasalarda olağan dışı değildir ve bu hareketler genelde ortalama hesaplarımızın savrulmasına sebep olur. Ehlers bu aşırı fiyat hareketliliklerinin neden olduğu ortalamalardaki bu savrulmanın nasıl kaldırıcağını düşünür ve medyan değer hariç tüm verileri silen bir filtre kullanarak bunu halletmenin bir yolunu bulur.

Moving Median Price by Atilla YurtsevenMoving Median Price is similar to Moving Average. However it uses the median instead of the mean. I believe that median is more important than the mean in some cases. Let me explain why:
There are 5 employees in a company. Their annual salary is $24,000,00. There's also a CEO of the company and his annual salary is $100,000.00. So if you calculate the mean to find the average salary using mean, you find $36,666.66. Well, nobody gets paid more than $24K but the CEO. Median helps us here. If you use median, the average salary is $24,000.00.
Keep in mind that you can use the median to find the average salary you pay per employee. You can still use mean for different purposes.
I have also added 2. Median to the script. You can enable or disable.
Disclaimer: I'm not an advisor and this script or the article is not financial advice.
Trade safe,
Atilla Yurtseven
