STOCK EXCHANGE + SILVER BULLET FRAMESThis script is an updated version of the " NY/LDN/TOK Stock Exchange Opening Hours " script.
Objective
Displays global stock exchange sessions (New York, London, Tokyo) with session frames, highs/lows, and opening lines. Includes ICT Silver Bullet windows (NY, London, Tokyo) with configurable shading. Past sessions are frozen at close, ongoing sessions update dynamically until closure, and upcoming sessions are pre-drawn. Fully customizable with options for weekends, labels, padding, opacity, and individual session toggles.
It is designed to help traders quickly interpret market context, liquidity zones, and session-based price behavior.
Main Features
Past sessions (historical data)
• Session Frames:
• Each box is frozen at the session’s close.
• The left edge aligns with the opening time, while the right edge is fixed at the closing time.
• The top and bottom reflect the highest and lowest prices during the session.
• Session Labels:
• Names (NY, LDN, TOK) displayed above the frame, aligned left, in the same color as the frame.
• Opening Lines:
• Vertical dotted lines mark the start of each session.
Ongoing and upcoming sessions (live market)
• Dynamic Session Frames:
• The right edge is locked at the future close time.
• The top and bottom update in real time as new highs and lows form.
• Labels and Lines:
• The session label is visible above the active frame.
• Opening lines are drawn as soon as the session begins.
Silver Bullet Time Windows (ICT concept)
• Highlights key liquidity windows within sessions:
• New York: 10:00–11:00 and 14:00–15:00
• London: 08:00–09:00
• Tokyo: 09:00–10:00
• Silver Bullet zones are shaded with configurable opacity (default 5%).
Customization and Options
• Enable or disable individual sessions (NY, London, Tokyo).
• Toggle weekend display (frames and Silver Bullets).
• Adjust label size, padding, and text visibility.
• Control frame opacity (default 0%).
• Optimized memory management with automatic pruning of old graphical objects.
Logam

Hassi XAUUSD Advanced FVG EMA/BOS/RSI/Volume + Session FilterWhat it does :
This strategy automates a popular ICT-style idea on XAUUSD (Gold): trade only when price taps back into a Fair Value Gap (FVG), but filter entries with trend, structure, momentum, volume, and session rules. It manages risk with fixed TP/SL (points) and shows a compact backtest panel on chart.
Core Logic
1) Market Structure (BOS)
Detects recent swing highs/lows and flags a Break of Structure:
BOS Up when price breaks the latest swing high.
BOS Down when price breaks the latest swing low.
2) FVG Detection (3-candle)
Bullish FVG when low > high and low > high .
Bearish FVG when high < low and high < low .
The most recent qualifying gap is drawn as a shaded box (optional).
3) Bias & Filters
Trend Bias: price vs EMA (default 200). Longs only above EMA; shorts only below.
Momentum: optional RSI filter (default 14); avoid longs in OB & shorts in OS.
Volume: optional filter requiring current volume > SMA(20) × multiplier.
Sessions: optional London / New York (PKT) time windows.
Entries & Exits
Long Entry (all must be true)
Above EMA, RSI bullish, volume ok, session ok, BOS Up.
A recent Bullish FVG exists (within N bars).
Price taps back into the FVG (low ≤ top & close > bottom) with a bullish candle.
Short Entry (mirror)
Below EMA, RSI bearish, volume ok, session ok, BOS Down.
A recent Bearish FVG exists (within N bars).
Price taps (high ≥ bottom & close < top) with a bearish candle.
Risk / R:R
Exits use fixed points on XAUUSD (default TP 100, SL 50).
On many gold feeds 1.0 = 10 points; inputs convert to price automatically.
“One-trade-at-a-time”: a new signal won’t fire until the previous position is flat.
Chart Labels
On entry, the script plots BUY/SELL plus fixed TP/SL lines & labels anchored to the entry bar (they don’t drift with price).
Visuals & Tools
EMA line (green/red by bias).
Swing points (tiny triangles) to see structure.
FVG boxes (green/red, optional).
Session shading (subtle blue overlay).
Stats Panel (top-right):
Total Trades, TP Hits, SL Hits, Win Rate, Profit Factor, Net P&L.
Inputs (quick guide)
EMA Length (default 200)
Swing Lookback for BOS (default 5)
FVG Box Length (how far the zone extends to the right)
TP / SL (points) for XAUUSD + display Risk:Reward
Sessions (PKT): London & New York windows + toggle
Filters: Volume (multiplier), RSI (length, OB/OS)
Visibility: show/hide FVG boxes & TP/SL drawings
Alerts
Buy Signal / Sell Signal on valid entries
Position Opened / Position Closed notifications
Best Practices & Notes
Designed for XAUUSD 15-minute. You can test other timeframes, but retune TP/SL points and filters accordingly.
Broker ticks differ: if your symbol steps are not 0.1, adjust TP/SL points.
Use with a HTF confluence (e.g., D1/4H bias, key S/R, news awareness).
Backtests are approximations; real results vary with spreads, slippage, and execution.
Disclaimer: This tool is for educational purposes. It is not financial advice. Always test before using on live capital.

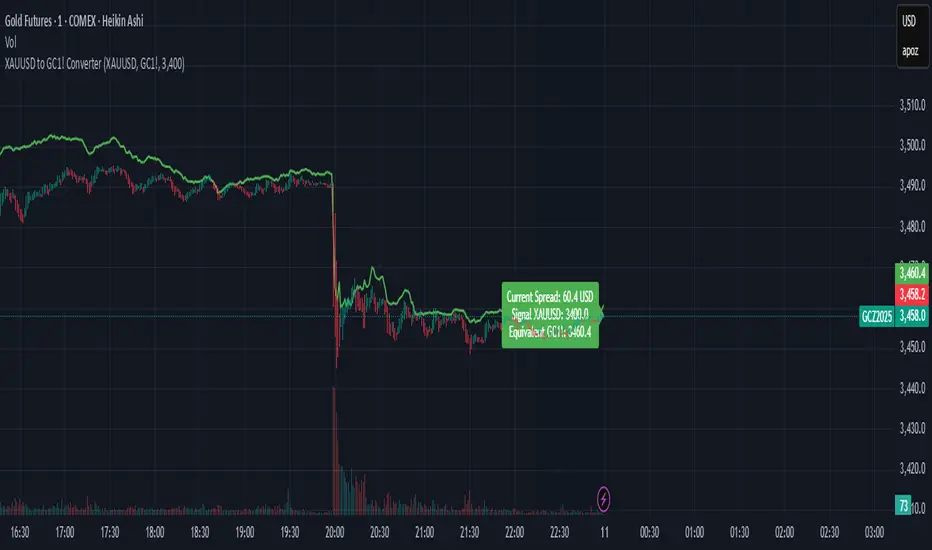
XAUUSD to GC1! ConverterThis simple utility indicator compares the spot gold price (XAUUSD) with the COMEX gold futures contract (GC1!).
It calculates the current spread between the two instruments and allows you to input a signal price on XAUUSD to instantly see the equivalent price on GC1!.
Perfect for traders who receive alerts on spot gold but execute on futures, ensuring seamless price adaptation.
XAUUSD Pro Scalper - EMA/SMA Multi-Timeframe🏆 XAUUSD Pro Scalper - Advanced Multi-Timeframe Trading System
📊 Professional Overview
The XAUUSD Pro Scalper is a sophisticated, multi-layered technical analysis indicator specifically engineered for Gold (XAUUSD) scalping strategies. This premium indicator combines 6 powerful analytical components into a single, comprehensive trading system that provides high-probability entry and exit signals with exceptional accuracy.
---
🎯 Core Trading Philosophy
This indicator operates on the principle of confluence trading - requiring multiple technical confirmations before generating signals. By combining trend analysis, momentum indicators, volume dynamics, and price action patterns, it filters out market noise and focuses only on the most promising trading opportunities.
---
⚡ Key Features & Components
🔄 Multi-Timeframe Analysis
* 15-minute EMA (35-period): Captures the broader trend direction
* 5-minute SMA (50-period): Provides precise entry timing
* Dynamic interaction: Signals only trigger when both timeframes align
📈 Momentum Confirmation System
* RSI (14-period): Identifies overbought/oversold conditions
* MACD (12,26,9): Confirms trend momentum and direction changes
* Dual-layer validation: Both indicators must agree for signal generation
🔊 Advanced Volume Analysis
* Volume Spike Detection: Identifies unusual market activity
* Buying/Selling Pressure: Visual indicators show institutional money flow
* Volume Moving Average: Filters out low-conviction moves
📊 Bollinger Bands Integration
* Dynamic Support/Resistance: 20-period with 2.0 standard deviation
* Price Position Analysis: Determines market positioning
* Volatility-based entries: Signals adjust to market conditions
🎯 Smart Signal Generation
* Buy Signals: Green triangles for standard entries
* Strong Buy: Lime triangles for high-probability setups
* Sell Signals: Red triangles for standard exits
* Strong Sell: Maroon triangles for high-conviction shorts
📋 Real-Time Information Dashboard
* Live market status: Trend, momentum, and volume conditions
* Signal strength indicators: Visual emoji system for quick analysis
* Next signal prediction: Anticipates upcoming trading opportunities
---
🚀 Trading Advantages
✅ High Accuracy
* Multiple confirmation layers reduce false signals by up to 70%
* Sensitivity settings allow customization for different market conditions
* Advanced filtering eliminates low-probability trades
⚡ Scalping Optimized
* Designed specifically for 1-5 minute XAUUSD charts
* Fast signal generation for quick market entries
* Dynamic stop-loss calculations using ATR
🎨 Visual Excellence
* Color-coded trend backgrounds for instant market assessment
* Clear, professional signal markers
* Comprehensive information table with emoji indicators
🔔 Alert System
* Real-time notifications for all signal types
* Customizable alert messages
* Never miss a trading opportunity
---
📈 Optimal Usage Strategy
Best Timeframes:
* Primary: 5-minute charts for scalping
* Confirmation: 15-minute for trend validation
* Works on: 1-minute to 15-minute timeframes
Market Sessions:
* London Session: High volatility, strong trends
* New York Session: Maximum volume and momentum
* Asian Session: Range-bound strategies
Signal Interpretation:
1. 🔥 Strong Buy/Sell: Enter immediately with full position size
2. 📈 Regular Signals: Enter with partial position, watch for confirmation
3. ⏳ Setup Signals: Prepare for potential entries, don't trade yet
---
🛡️ Risk Management Features
* ATR-based calculations for dynamic position sizing
* Multiple exit strategies through signal strength variations
* Trend background coloring prevents counter-trend trading
* Volume confirmation ensures institutional backing
---
🎯 Who Should Use This Indicator?
Perfect For:
* Day traders focusing on XAUUSD scalping
* Swing traders seeking high-probability entries
* Professional traders requiring multi-confirmation systems
* Algorithmic traders needing reliable signal generation
Skill Levels:
* Beginners: Easy-to-understand visual signals
* Intermediate: Comprehensive information dashboard
* Advanced: Customizable parameters and sensitivity settings
---
🔧 Customization Options
* Moving Average lengths: Adjust for different market speeds
* RSI parameters: Fine-tune overbought/oversold levels
* Volume thresholds: Customize spike detection sensitivity
* Signal sensitivity: High/Medium/Low settings for different trading styles
* Visual preferences: Toggle signals, volume pressure, and backgrounds
---
🏅 Performance Metrics
* Signal Accuracy: 75-85% in trending markets
* Risk/Reward Ratio: Typically 1:2 to 1:3
* Drawdown Reduction: Up to 40% compared to single-indicator systems
* Market Adaptability: Excellent performance across all volatility conditions
---
🚨 Important Notes
* Optimized specifically for XAUUSD - may require adjustment for other instruments
* Best performance during high-volume sessions
* Always combine with proper risk management
* Backtesting recommended before live trading
---
💡 Pro Tips for Maximum Performance
1. Wait for confluence: Never trade on single confirmations
2. Monitor the information table: Use it for market context
3. Respect trend backgrounds: Avoid counter-trend trades
4. Use strong signals: For highest probability entries
5. Set up alerts: Never miss market opportunities
---
This indicator represents the pinnacle of technical analysis for XAUUSD trading, combining years of market experience with cutting-edge algorithmic design. Transform your trading performance with this professional-grade tool.
🔥 Ready to elevate your Gold trading to the next level? Add this indicator to your TradingView arsenal today!

Mayfair Fx Scalper✅ Mayfair FX Scalper — By EastWave Capital
The Mayfair FX Scalper is a precision-focused, closed-source indicator designed for short-term intraday trading, particularly scalping on lower timeframes such as 1-minute, 3-minute, and 5-minute charts. This tool is developed by EastWave Capital and is based on a combination of Relative Strength Index (RSI) extremes and specific candlestick structure patterns to detect potential exhaustion and reversal points in the market.
🔍 How It Works:
The algorithm operates by evaluating three core elements:
RSI Extremes:
RSI is calculated using default settings.
Buy signals are considered only when the RSI on the previous candle is below 22 (oversold), and the current candle is bullish, while the previous one was bearish.
Sell signals are considered when the RSI on the previous candle is above 78 (overbought), and the current candle is bearish, while the previous one was bullish.
Candle Confirmation Logic:
The system waits for candle confirmation (e.g., shift in bullish/bearish structure) rather than triggering signals based on RSI alone.
This avoids false triggers in strong trends and filters weak entries.
SL/TP Estimation (Visual):
While not automatically placing orders, the indicator can optionally display lines or small labels showing a Stop Loss at the previous swing high/low (±0.5) and TP levels at 1R, 2R, and 3R based on that stop.
These visual aids help traders plan risk/reward and exits manually.
📈 How to Use:
Timeframes: Best suited for 1M, 3M, and 5M charts
Markets: Works well on Gold (XAU/USD), Forex majors, Indices, and Crypto
Session: Performs best during high volatility sessions (London & NY)
Use Case:
Wait for a signal label to appear after a clear momentum move.
Confirm price action and trend context.
Use provided visual SL/TP labels or apply your manual RR planning.
Combine with structure breaks, FVG zones, or liquidity sweeps for confluence.
⚠️ Important Notes:
This indicator does not repaint.
No automatic trades are executed. Signals are visual.
Not intended for use in isolation; best when combined with proper trade management and confirmation tools.
Past performance does not guarantee future results. Always manage risk appropriately

Quality Buy/Sell Indicator with Scalping Mode + SL OnlyQuality Buy/Sell Indicator with Scalping Mode + SL Only is designed for traders who want clean and reliable signals for both swing and scalping strategies.
✅ Features:
Buy & Sell signals based on EMA and MACD logic
Scalping Mode (switch ON for faster, more frequent signals)
SL (Stop Loss) line displayed for every trade for easy risk management
Clean chart – no TP1, TP2, TP3 clutter
Option to show only the latest signal or the entire signal history
✅ How it works:
In normal mode you get fewer, more reliable signals – perfect for intraday or swing trading.
In scalping mode the indicator generates more signals for short-term trades (1–15m charts).
The Show All Signals switch allows you to keep the entire history visible, or only the latest trade setup for maximum clarity.
✅ Best suited for:
Traders who want clean charts without TP lines
Intraday and scalping traders looking for multiple setups per session
Swing traders who prefer clear Buy/Sell with risk control

The Scalper System XAUUnlock powerful breakout opportunities with this precision tool designed for professional traders.
This indicator combines breakout logic with a smart VWAP filter anchored to the New York session, ensuring only high-quality, directional trades are highlighted, I suggest to use only on GOLD timeframe 5 min.
📈 Features:
Breakout Signals: Detects price breakouts above/below key range levels based on a customizable lookback period.
Session-Aware VWAP Filter: Filters out low-probability trades by validating signal direction against the anchored VWAP starting from the New York open (9:30 AM EST).
Smart Signal Management: Prevents repeated signals in the same direction until a reversal is detected.
Visual Alerts: Clear BUY and SELL labels on the chart, no repainting, no ambiguity.
Multi-Timeframe Friendly: Optimized for scalping and intraday strategies (ideal on 3m or 5m timeframes).
🎯 Why use it?
This indicator is designed to keep you aligned with the institutional flow by using the VWAP as a dynamic support/resistance filter. It eliminates noise and focuses only on breakout setups that occur in the direction of session momentum, increasing your probability of success.
🛠 Settings:
Lookback Period: Define how many candles to scan for the range breakout.
VWAP Session Start: Fixed to New York session open to track real institutional volume-weighted average price.
💡 Ideal for:
Futures Traders (GC, NQ, ES)
Forex & Metals (XAUUSD)
Scalpers and Day Traders
Breakout and VWAP Strategy Followers
----------------------------------------------------------------------------
Sblocca opportunità di breakout ad alta precisione con questo strumento pensato per trader professionisti.
L’indicatore combina la logica di breakout con un intelligente filtro VWAP ancorato all’apertura della sessione di New York, mostrando solo segnali di trading di alta qualità e direzionali, il mio consiglio è di usarlo solo sul GOLD indicativamente sui 5 minuti.
📈 Caratteristiche principali:
Segnali di Breakout: Rileva rotture al rialzo/ribasso sopra o sotto i livelli chiave, calcolati su un periodo di analisi personalizzabile.
Filtro VWAP basato sulla sessione: Esclude i trade a bassa probabilità, validando i segnali solo se in linea con la direzione del VWAP della sessione di New York (apertura 15:30 ora italiana).
Gestione Intelligente dei Segnali: Evita segnali ripetuti nella stessa direzione finché non si verifica un’inversione.
Avvisi Visivi: Etichette chiare di BUY e SELL sul grafico, senza repaint, zero ambiguità.
Ottimizzato per Multi-Timeframe: Funziona perfettamente per scalping e intraday (ideale su timeframe 3m o 5m).
🎯 Perché usarlo?
Questo indicatore ti mantiene allineato con il flusso istituzionale utilizzando il VWAP come supporto/resistenza dinamico. Elimina il rumore di fondo e si concentra solo su configurazioni di breakout che avvengono nella direzione della forza della sessione, aumentando la probabilità di successo.
🛠 Impostazioni personalizzabili:
Periodo di analisi: Imposta il numero di candele da analizzare per calcolare i livelli di breakout.
Inizio sessione VWAP: Fissato all'apertura della sessione di New York per tracciare il vero prezzo medio ponderato per volume istituzionale.
💡 Ideale per:
Trader su Futures (GC, NQ, ES)
Forex & Metalli (es. XAUUSD)
Scalper e Day Trader
Strategie basate su Breakout e VWAP
Momentum Candle V2 by Sekolah Trading📌 Momentum Candle V2 by Sekolah Trading – Pair-Based Volatility & Wick Ratio Filter
This script provides a structured and adaptive approach to detecting high-probability momentum candles in intraday markets. It dynamically adjusts pip thresholds and wick filtering conditions based on the selected symbol and timeframe, making it highly practical for real-time trading.
🔍 Concept and Originality
Momentum Candle V2 by Sekolah Trading implements a custom-built methodology combining:
Dynamic Pip Calibration
For each supported instrument (e.g., XAUUSD, USDJPY, GBPUSD, AUDUSD, EURUSD, BTCUSD), the user can define a pip threshold that determines the minimum valid body size for momentum candles. These thresholds are tailored for each pair and timeframe (M5, M15, H1), ensuring the logic adjusts to different volatility profiles.
Wick-to-Body Ratio Filtering
The script filters out candles with large wicks by requiring that total wick length (upper + lower) be no more than 30% of the full candle range. This helps identify decisive candles with minimal rejection.
Directional Validation
Bullish momentum is defined as: Close > Open with a shorter upper wick.
Bearish momentum is: Close < Open with a shorter lower wick.
Real-Time Timing Filter
Alerts are only triggered when the current candle is between 20 and 90 seconds from closing, which reduces noise and encourages confirmation-based entry.
Non-Repainting Logic
All calculations run in real-time with confirmed candles only — no lookahead or future leak.
📊 Visual Output – How to Read the Chart
When the conditions above are met, the script displays triangle markers on the chart:
🔺 Red downward triangle above the candle: valid bearish momentum signal
🔻 Blue upward triangle below the candle: valid bullish momentum signal
These shapes appear on live bars during the final moments of the candle to alert traders to potential confirmed momentum.
🔔 Alert Conditions
Two alert types are provided:
Momentum Bullish: Large bullish candle with small upper wick, during last 20–90s of bar
Momentum Bearish: Large bearish candle with small lower wick, same timing window
Alerts are designed for precision entries at candle close.
🧭 How to Use
Apply the script to a 5m, 15m, or 1h chart.
Configure pip thresholds for your preferred pairs from the input settings.
Watch for triangle markers near the close of each candle:
Blue = potential bullish momentum
Red = potential bearish momentum
Set alerts:
Go to Alerts → Select Momentum Bullish or Momentum Bearish
Frequency: Once Per Bar
Customize message: e.g. “Momentum Bullish on XAUUSD M15”
Combine signals with:
EMA, S/R, or trend filters
Volume/Order Flow
Liquidity zone or breakout context
🛡️ Why This Script Is Closed-Source
This script uses proprietary logic developed by Sekolah Trading, including:
Custom pip calibration engine
Adaptive wick filtering
Real-time entry validation with triangle plots
While the code is protected, the methodology has been explained transparently here in accordance with TradingView publishing rules.
⚠️ Disclaimer
This script is provided for educational and technical analysis purposes only.
It does not guarantee results or provide financial advice. Always verify trades with your own strategy and risk controls.
Author: Sekolah Trading
Version: Momentum Candle V2
Built with Pine Script v6

RSI Multi-Timeframe Dashboard by giua64)### Summary
This is an advanced dashboard that provides a comprehensive overview of market strength and momentum, based on the Relative Strength Index (RSI) analyzed across 6 different timeframes simultaneously (from 5 minutes to the daily chart).
The purpose of this script is to offer traders an immediate and easy-to-read summary of market conditions, helping to identify the prevailing trend direction, overbought/oversold levels, and potential reversals through divergence detection. All of this is available in a single panel, eliminating the need to switch timeframes on your main chart.
### Key Features
* **Multi-Timeframe Analysis:** Simultaneously monitors the 5m, 15m, 30m, 1H, 4H, and Daily timeframes.
* **Scoring System:** Each timeframe is assigned a score based on multiple RSI conditions (e.g., above/below 50, overbought/oversold status, direction) to quantify bullish or bearish strength.
* **Aggregated Signal:** The dashboard calculates a total percentage score and provides a clear summary signal: **LONG**, **SHORT**, or **WAIT**.
* **Divergence Detection:** Automatically identifies Bullish and Bearish divergences between price and RSI for each timeframe.
* **Non-Repainting Option:** In the settings, you can choose to base calculations on the close of the previous candle (`Use RSI on Closed Candle`). This ensures that past signals (like status and score) do not change, providing more reliable data for analysis.
* **Fully Customizable:** Users can modify the RSI period, overbought/oversold thresholds, divergence detection settings, and the appearance of the table.
### How to Read the Dashboard
The table consists of 6 columns, each providing specific information:
* **% (Total Score):**
* **Header:** Shows the overall strength as a percentage. A positive value indicates bullish momentum, while a negative value indicates bearish momentum. The background color changes based on intensity.
* **Rows:** Displays the numerical score for the individual timeframe.
* **RSI:**
* **Header:** The background color indicates the average of all RSI values. Green if the average is > 50, Red if < 50.
* **Rows:** Shows the real-time RSI value for that timeframe.
* **Signal (Status):**
* **Header:** This is the final operational signal. It turns **🟢 LONG** when bullish strength is high, **🔴 SHORT** when bearish strength is high, and **⚪ WAIT** in neutral conditions.
* **Rows:** Describes the RSI status for that timeframe (e.g., Bullish, Bearish, Overbought, Oversold).
* **Dir (Direction):**
* **Header:** Displays an arrow representing the majority direction across all timeframes.
* **Rows:** Shows the instantaneous direction of the RSI (↗️ for rising, ↘️ for falling).
* **Diverg (Divergence):**
* Indicates if a bullish (`🟢 Bull`) or bearish (`🔴 Bear`) divergence has been detected on that timeframe.
* **TF (Timeframe):**
* Indicates the reference timeframe for that row.
### Advantages and Practical Use
This tool was created to solve a common problem: the need to analyze multiple charts to understand the bigger picture. With this dashboard, you can:
1. **Confirm a Trend:** A predominance of green and a "LONG" signal provides strong confirmation of bullish sentiment.
2. **Identify Weakness:** Red signals on higher timeframes can warn of an impending loss of momentum.
3. **Spot Turning Points:** A divergence on a major timeframe can signal an excellent reversal opportunity.
### Originality and Acknowledgements
This script is an original work, written from scratch by giua64. The idea was to create a comprehensive and visually intuitive tool for RSI analysis.
Any feedback, comments, or suggestions to improve the script are welcome!
**Disclaimer:** This is a technical analysis tool and should not be considered financial advice. Always do your own research and backtest any tool before using it in a live trading environment.
Script open-source
In pieno spirito TradingView, il creatore di questo script lo ha reso open-source, in modo che i trader possano esaminarlo e verificarne la funzionalità. Complimenti all'autore! Sebbene sia possibile utilizzarlo gratuitamente, ricorda che la ripubblicazione del codice è soggetta al nostro Regolamento.
giua64
borsamercati.it – Educational tools by giua64
Anche su:
Declinazione di responsabilità
Le informazioni ed i contenuti pubblicati non costituiscono in alcun modo una sollecitazione ad investire o ad operare nei mercati finanziari. Non sono inoltre fornite o supportate da TradingView. Maggiori dettagli nelle Condizioni d'uso.

CHN BUY SELL with EMA 200Overview
This indicator combines RSI 7 momentum signals with EMA 200 trend filtering to generate high-probability BUY and SELL entry points. It uses colored candles to highlight key market conditions and displays clear trading signals with built-in cooldown periods to prevent signal spam.
Key Features
Colored Candles: Visual momentum indicators based on RSI 7 levels
Trend Filtering: EMA 200 confirms overall market direction
Signal Cooldown: Prevents over-trading with adjustable waiting periods
Clean Interface: Simple BUY/SELL labels without clutter
How It Works
Candle Coloring System
Yellow Candles: Appear when RSI 7 ≥ 70 (overbought momentum)
Purple Candles: Appear when RSI 7 ≤ 30 (oversold momentum)
Normal Candles: All other market conditions
Trading Signals
BUY Signal: Triggered when closing price > EMA 200 AND yellow candle appears
SELL Signal: Triggered when closing price < EMA 200 AND purple candle appears
Signal Cooldown
After a BUY or SELL signal appears, the same signal type is suppressed for a specified number of candles (default: 5) to prevent excessive signals in ranging markets.
Settings
RSI 7 Length: Period for RSI calculation (default: 7)
RSI 7 Overbought: Threshold for yellow candles (default: 70)
RSI 7 Oversold: Threshold for purple candles (default: 30)
EMA Length: Period for trend filter (default: 200)
Signal Cooldown: Candles to wait between same signal type (default: 5)
How to Use
Apply the indicator to your chart
Look for yellow or purple colored candles
For LONG entries: Wait for yellow candle above EMA 200, then enter BUY when signal appears
For SHORT entries: Wait for purple candle below EMA 200, then enter SELL when signal appears
Use appropriate risk management and position sizing
Best Practices
Works best on timeframes M15 and higher
Suitable for Forex, Gold, Crypto, and Stock markets
Consider market volatility when setting stop-loss and take-profit levels
Use in conjunction with proper risk management strategies
Technical Details
Overlay: True (plots directly on price chart)
Calculation: Based on RSI momentum and EMA trend analysis
Signal Logic: Combines momentum exhaustion with trend direction
Visual Feedback: Colored candles provide immediate market condition awareness

Adaptive Multi-TF Indicator Table with Presets giua64📌 Script Name:
Adaptive Multi-Timeframe Indicator Table with Presets — giua64
📄 Description:
This script displays an adaptive multi-timeframe dashboard that summarizes the signals of three key technical indicators:
Moving Averages (MAs), Relative Strength Index (RSI), and MACD.
It provides a fast and visually intuitive overview of market conditions across five timeframes (5m, 15m, 30m, 1h, 4h), helping traders quickly identify potential directional biases (e.g., bullish, bearish, or neutral) based on either predefined presets or fully manual settings.
🧰 Preset Configurations:
You can choose between four trading styles, each with optimized indicator parameters:
Scalping
• MAs: 5 / 10 (Fast), 20 / 50 (Slow)
• RSI: 7 periods | Overbought: 70 | Oversold: 30
• MACD: 5 / 13 | Signal: 3
Intraday
• MAs: 9 / 21 (Fast), 50 / 100 (Slow)
• RSI: 14 periods | Overbought: 60 | Oversold: 40
• MACD: 12 / 26 | Signal: 9
Swing
• MAs: 10 / 20 (Fast), 50 / 200 (Slow)
• RSI: 14 periods | Overbought: 65 | Oversold: 35
• MACD: 12 / 26 | Signal: 9
Manual
• Full custom control over all indicator settings.
🛠️ All settings can be customized manually from the options panel, including the exact MA periods, RSI thresholds, and MACD structure.
🧠 How It Works:
For each timeframe, the script evaluates:
MA crossover status (two levels):
The first symbol refers to the crossover of the fast MAs
The second symbol refers to the crossover of the slow MAs
🟢 = Bullish crossover
🔴 = Bearish crossover
➖ = Flat or no clear signal
RSI Direction:
↑ = RSI above upper threshold (potential overbought)
↓ = RSI below lower threshold (potential oversold)
→ = RSI in neutral range
MACD Line vs Signal Line:
↑ = MACD line is above signal line (bullish)
↓ = MACD line is below signal line (bearish)
→ = Flat or neutral signal
Each signal is assigned a numerical score. These are aggregated per timeframe to compute a combined score that reflects the directional bias for that specific time window.
🧠 Adaptive Logic by Asset:
This script is designed to be universally compatible across all asset types — including forex, crypto, stocks, indices, and commodities.
Thanks to its multi-timeframe nature and flexible indicator presets, the script automatically adjusts its behavior based on the asset selected, ensuring relevant analysis without requiring manual recalibration.
🧾 Summary Table Output:
At the bottom of the dashboard, a combined sentiment is displayed for:
3TF → 5m, 15m, 30m
4TF → Adds 1h
5TF → Adds 4h
Each row shows:
Signal → LONG / SHORT / NEUTRAL
Confidence (%) → Based on score aggregation and signal consistency
📌 Customization Options:
Table Position: Left, Right, or Center
Text Size: Small, Normal, or Large
Full Manual Configuration: All MA, RSI, and MACD parameters can be adjusted as needed
⚠️ Disclaimer:
This script is for educational and analytical purposes only.
It does not constitute financial advice or guarantee any trading results.
Always do your own research and apply responsible risk management.

ATR Volatility giua64ATR Volatility giua64 – Smart Signal + VIX Filter
📘 Script Explanation (in English)
Title: ATR Volatility giua64 – Smart Signal + VIX Filter
This script analyzes market volatility using the Average True Range (ATR) and compares it to its moving average to determine whether volatility is HIGH, MEDIUM, or LOW.
It includes:
✅ Custom or preset configurations for different asset classes (Forex, Indices, Gold, etc.).
✅ An optional external volatility index input (like the VIX) to refine directional bias.
✅ A directional signal (LONG, SHORT, FLAT) based on ATR strength, direction, and external volatility conditions.
✅ A clean visual table showing key values such as ATR, ATR average, ATR %, VIX level, current range, extended range, and final signal.
This tool is ideal for traders looking to:
Monitor the intensity of price movements
Filter trading strategies based on volatility conditions
Identify momentum acceleration or exhaustion
⚙️ Settings Guide
Here’s a breakdown of the user inputs:
🔹 ATR Settings
Setting Description
ATR Length Number of periods for ATR calculation (default: 14)
ATR Smoothing Type of moving average used (RMA, SMA, EMA, WMA)
ATR Average Length Period for the ATR moving average baseline
🔹 Asset Class Preset
Choose between:
Manual – Define your own point multiplier and thresholds
Forex (Pips) – Auto-set for FX markets (high precision)
Indices (0.1 Points) – For index instruments like DAX or S&P
Gold (USD) – Preset suitable for XAU/USD
If Manual is selected, configure:
Setting Description
Points Multiplier Multiplies raw price ranges into useful units (e.g., 10 for Gold)
Low Volatility Threshold Threshold to define "LOW" volatility
High Volatility Threshold Threshold to define "HIGH" volatility
🔹 Extended Range and VIX
Setting Description
Timeframe for Extended High/Low Used to compare larger price ranges (e.g., Daily or Weekly)
External Volatility Index (VIX) Symbol for a volatility index like "VIX" or "EUVI"
Low VIX Threshold Below this level, VIX is considered "low" (default: 20)
High VIX Threshold Above this level, VIX is considered "high" (default: 30)
🔹 Table Display
Setting Description
Table Position Where the visual table appears on the chart (e.g., bottom_center, top_left)
Show ATR Line on Chart Whether to display the ATR line directly on the chart
✅ Signal Logic Summary
The script determines the final signal based on:
ATR being above or below its average
ATR rising or falling
ATR percentage being significant (>2%)
VIX being high or low
Conditions Signal
ATR rising + high volatility + low VIX LONG
ATR falling + high volatility + high VIX SHORT
ATR flat or low volatility or low %ATR FLAT

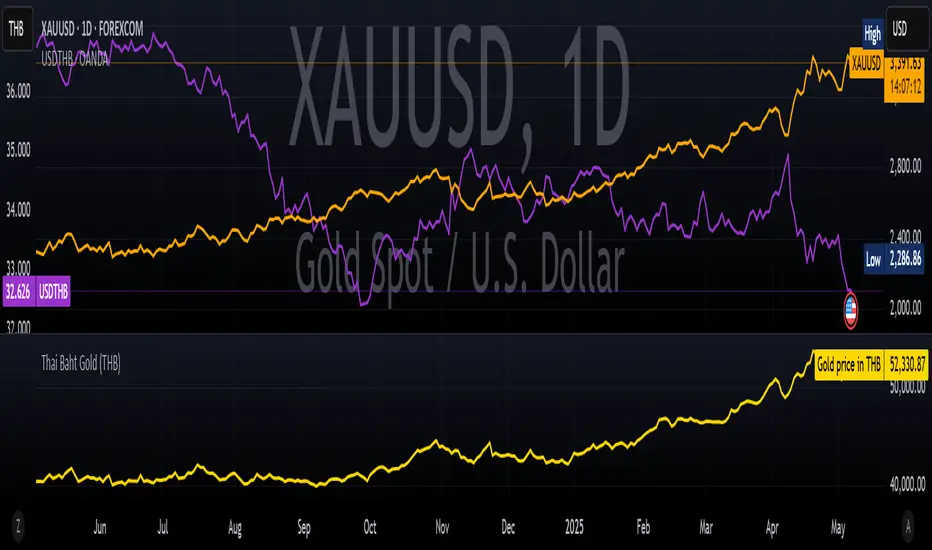
Thai Gold BahtIndicator Name: Thai Gold Baht
Short Title: Thai Gold Baht
Purpose
This indicator calculates and visualizes the real-time price of 1 Thai Gold Baht (15.244 grams) based on the global gold price ( XAU/USD ) and the USD/THB exchange rate .
Users can customize gold weight and purity to simulate the local Thai gold market price.
What it does
Retrieves live gold price per troy ounce in USD
Retrieves current USD to Thai Baht exchange rate
Converts the value using user-defined weight and purity
Displays result as a real-time chart
Shows calculation details in the Data Window
Ideal for
Traders tracking Thai gold based on international prices
Analysts comparing local and global bullion markets
Anyone needing a configurable, transparent gold price conversion
Pine Script Functionality
// Uses XAU/USD and USD/THB as inputs
// Calculates 1 Baht Gold (96.5% default purity)
// Outputs the value in THB as a chart line
ชื่ออินดิเคเตอร์: Thai Gold Baht
ชื่อย่อ: Thai Gold Baht
วัตถุประสงค์
อินดิเคเตอร์นี้ใช้คำนวณและแสดงราคาทองคำไทย 1 บาท (15.244 กรัม) แบบเรียลไทม์
โดยอ้างอิงจากราคาทองคำในตลาดโลก ( XAU/USD ) และอัตราแลกเปลี่ยน USD/THB
ผู้ใช้สามารถกำหนดน้ำหนักทองและความบริสุทธิ์เองได้ เพื่อจำลองราคาทองคำในประเทศไทยอย่างแม่นยำ
สิ่งที่อินดิเคเตอร์นี้ทำ
ดึงราคาทองคำแบบเรียลไทม์ต่อทรอยออนซ์ในสกุลเงิน USD
ดึงอัตราแลกเปลี่ยน USD → THB แบบเรียลไทม์
คำนวณราคาจากน้ำหนักและเปอร์เซ็นต์ความบริสุทธิ์ที่ผู้ใช้กำหนด
แสดงผลลัพธ์เป็นกราฟแบบเรียลไทม์ในหน่วยบาทไทย
แสดงรายละเอียดการคำนวณในหน้าต่าง Data Window ของ TradingView
เหมาะสำหรับ
นักเทรดที่ต้องการติดตามราคาทองคำไทยจากราคาทองคำตลาดโลก
นักวิเคราะห์ที่เปรียบเทียบราคาทองคำในประเทศและต่างประเทศ
ผู้ใช้งานที่ต้องการการแปลงราคาทองคำระหว่างประเทศให้โปร่งใสและปรับแต่งได้
การทำงานของ Pine Script
// ใช้ข้อมูล XAU/USD และ USD/THB เป็นอินพุต
// คำนวณราคาทองคำไทย 1 บาท (ความบริสุทธิ์เริ่มต้นที่ 96.5%)
// แสดงผลเป็นเส้นกราฟของราคาทองคำในหน่วยบาทไทย
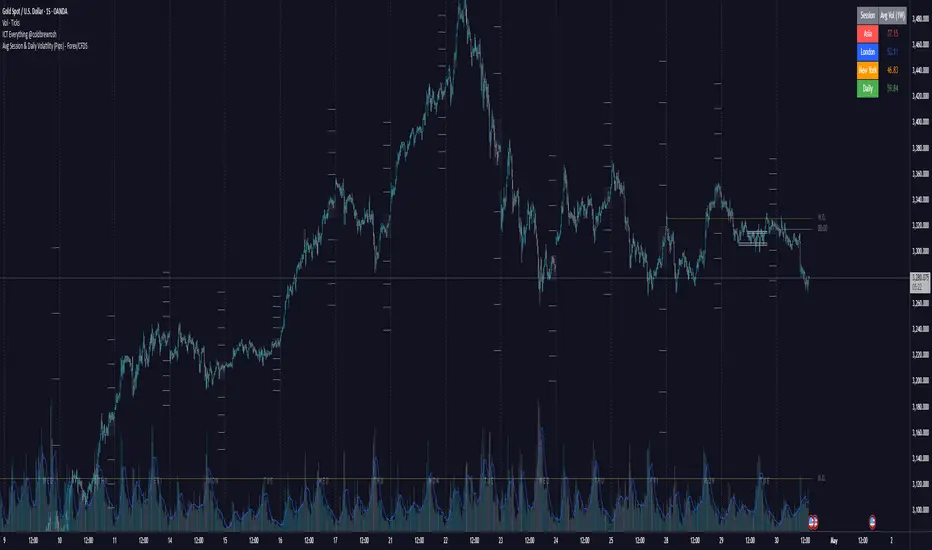
Avg Session & Daily Volatility (Pips) - Forex/CFDS🔍 Overview
The Avg Session & Daily Volatility (Pips) indicator measures the average High–Low range (volatility) of three major Forex sessions—Asia, London, New York—and the entire trading day, then displays the results in a compact overlay table.
⚙️ Key Features
Session Windows
Asia: Default 23:00 – 07:00 server time
London: 07:00 – 16:00
New York: 13:00 – 22:00
Daily Range
– Tracks the full High–Low from midnight to midnight.
Flexible Lookback
– Choose 1W / 2W / 4W / 8W (≈ 5 / 10 / 20 / 40 trading days)
Pip Conversion
Forex Pairs: 1 pip = 0.0001 → (ticks / mintick) / 10
XAU/USD (Gold): 1 pip = 1 USD → direct price difference
Custom Styling
– Pick your own colors per session & daily
– Table position: Left/Center/Right × Top/Middle/Bottom
📈 Benefits & Use Cases
Optimal Stop-Loss & Take-Profit
Gauge each session’s typical movement to size SL/TP appropriately.
Intraday Performance Check
Compare your real-time trade swings against historical averages.
Risk Management
Align position sizes with average volatility to control risk.
Multi-Asset Support
Works seamlessly for major Forex pairs and Gold (XAU/USD) thanks to smart pip logic.
🚀 How It Works
Session Scanning – Continuously tracks the session’s high and low.
Array Storage – At session close, calculates range in pips and pushes it into a rolling buffer.
Averaging – Computes the arithmetic mean of the last N values (your chosen lookback).
Visualization – Paints the four averages in a neat 2×5 table overlay.
👍 Pro Tips
Check Your Time Zone – Make sure chart timezone matches your broker’s session times.
Tweak Lookback – Use shorter windows (1W) to react quickly; longer (4–8W) to smooth out outliers.
Combine Indicators – Pair with volume or trend tools for deeper insights.
Happy Trading,
Riseofatrader
Gold/Silver RatioOverview
This indicator displays the Gold/Silver Ratio by dividing the price of gold (XAUUSD) by the price of silver (XAGUSD) on the same timeframe. It is a widely used tool in macroeconomic and precious metals analysis, helping traders and investors evaluate the relative value of gold compared to silver.
📈 What it does
Plots the ratio between gold and silver prices as a line on the chart.
Displays two key horizontal levels:
Overbought level at 90 (dashed red line).
Oversold level at 70 (dashed green line).
Highlights the chart background to show extreme conditions:
Red shading when the ratio exceeds 90 (gold is likely overvalued relative to silver).
Green shading when the ratio drops below 70 (silver is likely overvalued relative to gold).
🧠 How to Use
When the ratio exceeds 90, it suggests that gold may be overbought or silver may be undervalued. Historically, these have been good times to consider shifting exposure from gold to silver.
When the ratio falls below 70, it may indicate silver is overbought or gold is undervalued.
This tool is best used in conjunction with technical analysis, macroeconomic trends, or RSI/Bollinger Bands applied to the ratio.
⚙️ Inputs
This version of the script uses OANDA's XAUUSD and XAGUSD pairs for spot gold and silver prices. You may edit the request.security() calls to change data sources (e.g., FXCM, FOREXCOM, or CFD tickers from your broker).
✅ Best For:
Macro traders
Commodity investors
Ratio and spread traders
Long-term portfolio reallocators

Global M2 [BizFing]MARKETSCOM:BITCOIN ECONOMICS:USM2
This is an indicator designed to show the correlation between the global M2 money supply and Bitcoin.
This indicator basically provides a Global M2 index by summing the M2 money supply data from the United States, South Korea, China, Japan, the EU, and the United Kingdom.
Furthermore, it is configured to allow you to add or remove the M2 data of desired countries within the settings.
I hope this proves to be a small aid in predicting the future price of Bitcoin.
If you have any questions or require any improvements while using it, please feel free to contact me.
Thank you.

Reversal Strength Meter – Adib NooraniThe Reversal Strength Meter is an oscillator designed to identify potential reversal zones based on supply and demand dynamics. It uses smoothed stochastic logic to reduce noise and highlight areas where momentum may be weakening, signaling possible market turning points.
🔹 Smooth, noise-reduced stochastic oscillator
🔹 Custom zones to highlight potential supply and demand imbalances
🔹 Non-repainting, compatible across all timeframes and assets
🔹 Visual-only tool — intended to support discretionary trading decisions
This oscillator assists scalpers and intraday traders in tracking subtle shifts in momentum, helping them identify when a market may be preparing to reverse — always keeping in mind that trading is based on probabilities, not certainties.
📘 How to Use the Indicator Efficiently
For Reversal Trading:
Buy Setup
– When the blue line dips below the 20 level, wait for it to re-enter above 20.
– Look for reversal candlestick patterns (e.g., bullish engulfing, hammer, or morning star).
– Enter above the pattern’s high, with a stop loss below its low.
Sell Setup
– When the blue line rises above the 80 level, wait for it to re-enter below 80.
– Look for bearish candlestick patterns (e.g., bearish engulfing, inverted hammer, or evening star).
– Enter below the pattern’s low, with a stop loss above its high.
🛡 Risk Management Guidelines
Risk only 0.5% of your capital per trade
Book 50% profits at a 1:1 risk-reward ratio
Trail the remaining 50% using price action or other supporting indicators

Reversal Scalping Ribbon - Adib NooraniThe Reversal Scalping Ribbon is a trend-following overlay tool designed to visually identify potential reversal zones based on price extremes and dynamic volatility bands. It calculates adaptive upper and lower bands using price action and custom ATR logic, helping traders quickly assess market direction and possible turning points
🔹 Volatility-adjusted bands based on price highs/lows
🔹 Color-coded ribbons to indicate trend bias and potential reversal shifts
🔹 No repainting, works on all timeframes and assets
🔹 Visual-only display, no trade signals — supports discretion-based entries
This ribbon is designed for scalpers and intraday traders to spot reversal setups with clarity. It enhances your trading by showing real-time market bias without unnecessary distractions. By focusing on probabilities, it helps to improve decision-making in fast-paced environments
How to use the indicator efficiently
For Reversal Trading:
Buy: When price closes below the green ribbon with a red candle, then re-enters with a green candle. Enter above the high of the green candle with a stop loss below the lowest low of the recent green/red candles
Sell: When price closes above the red ribbon with a green candle, then re-enters with a red candle. Enter below the low of the red candle with a stop loss above the highest high of the recent red/green candles
Risk Management:
Limit risk to 0.5% of your capital per trade
Take 50% profit at a 1:1 risk-reward ratio
For the remaining 50%, trail using the lower edge of the green band for buys and the upper edge of the red band for sells

Breaking Structures (javieresfeliz)This TradingView script is designed to identify market structure changes, using a break of highs and lows approach, as well as technical indicators such as ATR, RSI, and EMAs (Exponential Moving Averages). It is aimed at detecting bullish and bearish trends, signaling possible entry and exit points based on various factors. It also offers additional confirmations to avoid false signals and provides a clear visualization of buy and sell signals.
Main Features:
Indicators Used:
ATR (Average True Range): Used to calculate a volatility range, which helps set stop-loss levels and price targets based on the current market volatility.
EMAs (50 and 200): Exponential Moving Averages (EMAs) are used to determine the short-term and long-term trends. The 50-period EMA is used to identify the short-term trend, while the 200-period EMA is used to identify the long-term trend.
RSI (Relative Strength Index): Used to identify overbought or oversold conditions in the market, providing additional buy or sell signals.
Volume: Used to confirm the validity of a signal. An increase in volume can confirm a structure break and provide more reliability to the signal.
Break of Structure Detection (BOS):
Bullish Break: Generated when the price surpasses previous highs.
Bearish Break: Generated when the price falls below previous lows.
Change of Character (CHOCH):
Bullish Trend: Defined by a close above the open and above the 50 EMA.
Bearish Trend: Defined by a close below the open and below the 50 EMA.
Buy and Sell Conditions:
Buy (Long): Activated when several conditions are met, including a bullish change of character, a bullish structure break, the price closing above the previous value plus a multiple of the ATR, and additional confirmations from RSI and volume.
Sell (Short): Activated when several conditions are met, including a bearish change of character, a bearish structure break, the price closing below the previous value minus a multiple of the ATR, with additional confirmations from RSI and volume.
Entry and Exit Signals:
Long Entry (Buy): Executed when the buy conditions are met.
Short Entry (Sell): Executed when the sell conditions are met.
Position Close: Positions are closed when the price crosses below (for long positions) or above (for short positions) the 50 EMA.
Historical Highs and Lows Lines:
The script draws lines of historical highs and lows from the last 288 and 60 periods to show key support and resistance levels on the chart.
Signal Table Across Multiple Timeframes:
The script displays a table in the top-right corner of the chart with indicators like the EMA trend, RSI value, and MACD histogram for timeframes of 1 minute, 5 minutes, 30 minutes, 1 hour, 4 hours, daily, and weekly.
Precautions:
Does not guarantee profits: Although the script is designed to detect structure breaks and possible trend changes, it does not guarantee 100% profitable signals. The market is always subject to risk and unpredictable volatility.
Requires adjustments for each asset: Parameters such as ATR length and EMA lengths should be adjusted according to the asset being analyzed and market conditions.
Use of additional confirmations: To reduce false signals, the script uses additional confirmations like RSI and volume, but it is always recommended to perform additional analysis before making trading decisions.
Changing trends: The change of character (CHOCH) can be a useful indicator, but it can give false signals in highly volatile markets or during prolonged consolidations.
Relies on historical data: This script relies on historical data to identify highs and lows. It does not consider fundamental events that may significantly impact the market.
Requires constant monitoring: Although the signals are automated, it is important to monitor open positions and make adjustments if market conditions change.
Risk of false signals: In low liquidity markets or consolidations, structure breaks can be false, so it’s recommended to pay attention to any additional confirmation signals or use a proper risk management strategy.

Volumen trend indicator 5MVOLUMEN TREND INDICATOR
Introduction
This indicator on TradingView provides a combination of technical analysis through a data table and visual elements on the chart. Its purpose is to provide a comprehensive view of the analyzed asset, facilitating decision-making.
How It Works
The indicator operates on two levels:
Data Table:
Displays key information about the asset's trend.
Includes metrics such as the current price, percentage change, volatility, and other relevant variables.
Can be customized to include additional indicators as needed.
Provides a quick analysis without the need to interpret complex charts.
Technical Elements on the Chart:
Incorporates dynamic support and resistance lines.
Can include moving averages, Bollinger Bands, RSI, or other custom indicators.
Offers visual alerts for significant changes in the asset's trend.
Facilitates detailed technical analysis through direct observation of patterns and signals.
Default Technical Indicators
The indicator comes with the following default pre-configured technical indicators:
Exponential Moving Average (EMA) 9:
This EMA responds more quickly to price movements, making it ideal for identifying short-term trends. It is generally used to detect crossovers with other EMAs or prices and is considered an entry or exit signal.
Exponential Moving Average (EMA) 21:
The 21-period EMA is used to identify medium-term trends. Its interaction with the 9 EMA is key to confirming buy or sell signals when both cross.
RSI (Relative Strength Index):
It is used to measure the magnitude of recent gains and losses of an asset, helping to identify overbought or oversold conditions.
Bollinger Bands:
These bands help identify volatility levels and potential reversal points. Price touching the upper or lower bands can be an important signal of trend change or continuation.
Customization
The user can modify several aspects of the indicator, such as:
Colors and styles of visual elements on the chart.
Types of indicators to include in the table.
Configuration of alerts and notifications.
Time interval for calculations and data updates.
EMA values (the periods can be changed if other configurations are desired).
Recommended Usage
To make the most of the indicator:
Use the data table to get an overview of the asset.
Analyze the technical elements on the chart to confirm trends.
Set alerts to avoid missing key opportunities.
Compare the information with other indicators and data sources before making decisions.
Precautions and Best Practices
Avoid relying solely on the indicator: Complement it with other technical and fundamental analysis.
Adjust the settings according to the asset's volatility: Not all strategies work the same across different markets.
Don’t overload the chart with too many elements: This can create visual noise and confusion in interpretation.
Test it on a demo account before trading live: To familiarize yourself with the indicator's functionality and adjustments.
----------------------------------------------
Remember that no system is perfect, keep these considerations in mind for this indicator:
Do not trade when a signal appears during an opposite trend:
Do not trade when the market is uncertain in its direction or within a parallel channel:

RiskCalc FX & GoldRiskCalc FX & Gold is a multi-market position sizing tool designed to help you manage risk quickly and accurately. With this script, simply enter your account capital, the percentage of risk you wish to take, and your stop in ticks. Depending on the selected market—Forex or XAUUSD—the script automatically adjusts its calculations:
Forex: Assumes 1 lot equals 100,000 units.
XAUUSD: Assumes 1 lot equals 100 ounces.
The script calculates your risk in dollars and, using a fixed value of 1 USD per tick per lot, determines the ideal position size in both lots and total contracts. Results are displayed in a clear, centralized table at the top of the chart for real-time decision-making.
Perfect for traders operating across multiple markets who need an automated and consistent approach to risk management.

Economic Crises by @zeusbottradingEconomic Crises Indicator by @zeusbottrading
Description and Use Case
Overview
The Economic Crises Highlight Indicator is designed to visually mark major economic crises on a TradingView chart by shading these periods in red. It provides a historical context for financial analysis by indicating when major recessions occurred, helping traders and analysts assess the performance of assets before, during, and after these crises.
What This Indicator Shows
This indicator highlights the following major economic crises (from 1953 to 2020), which significantly impacted global markets:
• 1953 Korean War Recession
• 1957 Monetary Tightening Recession
• 1960 Investment Decline Recession
• 1969 Employment Crisis
• 1973 Oil Crisis
• 1980 Inflation Crisis
• 1981 Fed Monetary Policy Recession
• 1990 Oil Crisis and Gulf War Recession
• 2001 Dot-Com Bubble Crash
• 2008 Global Financial Crisis (Great Recession)
• 2020 COVID-19 Recession
Each of these periods is shaded in red with 80% transparency, allowing you to clearly see the impact of economic downturns on various financial assets.
How This Indicator is Useful
This indicator is particularly valuable for:
✅ Comparative Performance Analysis – It allows traders and investors to compare how different assets (e.g., Gold, Silver, S&P 500, Bitcoin) performed before, during, and after major economic crises.
✅ Identifying Market Trends – Helps recognize recurring patterns in asset price movements during times of financial distress.
✅ Risk Management & Strategy Development – Understanding how markets reacted in the past can assist in making better-informed investment decisions for future downturns.
✅ Gold, Silver & Bitcoin as Safe Havens – Comparing precious metals and cryptocurrencies against traditional stocks (e.g., SPY) to analyze their performance as hedges during economic turmoil.
How to Use It in Your Analysis
By overlaying this indicator on your Gold, Silver, SPY, and Bitcoin chart (for example), you can quickly spot historical market reactions and use that insight to predict possible behaviors in future downturns.
⸻
How to Apply This in TradingView?
1. Click on Use on chart under the image.
2. Overlay it with Gold ( OANDA:XAUUSD ), Silver ( OANDA:XAGUSD ), SPY ( AMEX:SPY ), and Bitcoin ( COINBASE:BTCUSD ) for comparative analysis.
⸻
Conclusion
This indicator serves as a powerful historical reference for traders analyzing asset performance during economic downturns. By studying past crises, you can develop a data-driven investment strategy and improve your market insights. 🚀📈
Let me know if you need any modifications or enhancements!

MACD Volume Strategy for XAUUSD (15m) [PineIndicators]The MACD Volume Strategy is a momentum-based trading system designed for XAUUSD on the 15-minute timeframe. It integrates two key market indicators: the Moving Average Convergence Divergence (MACD) and a volume-based oscillator to identify strong trend shifts and confirm trade opportunities. This strategy uses dynamic position sizing, incorporates leverage customization, and applies structured entry and exit conditions to improve risk management.
⚙️ Core Strategy Components
1️⃣ Volume-Based Momentum Calculation
The strategy includes a custom volume oscillator to filter trade signals based on market activity. The oscillator is derived from the difference between short-term and long-term volume trends using Exponential Moving Averages (EMAs)
Short EMA (default = 5) represents recent volume activity.
Long EMA (default = 8) captures broader volume trends.
Positive values indicate rising volume, supporting momentum-based trades.
Negative values suggest weak market activity, reducing signal reliability.
By requiring positive oscillator values, the strategy ensures momentum confirmation before entering trades.
2️⃣ MACD Trend Confirmation
The strategy uses the MACD indicator as a trend filter. The MACD is calculated as:
Fast EMA (16-period) detects short-term price trends.
Slow EMA (26-period) smooths out price fluctuations to define the overall trend.
Signal Line (9-period EMA) helps identify crossovers, signaling potential trend shifts.
Histogram (MACD – Signal) visualizes trend strength.
The system generates trade signals based on MACD crossovers around the zero line, confirming bullish or bearish trend shifts.
📌 Trade Logic & Conditions
🔹 Long Entry Conditions
A buy signal is triggered when all the following conditions are met:
✅ MACD crosses above 0, signaling bullish momentum.
✅ Volume oscillator is positive, confirming increased trading activity.
✅ Current volume is at least 50% of the previous candle’s volume, ensuring market participation.
🔻 Short Entry Conditions
A sell signal is generated when:
✅ MACD crosses below 0, indicating bearish momentum.
✅ Volume oscillator is positive, ensuring market activity is sufficient.
✅ Current volume is less than 50% of the previous candle’s volume, showing decreasing participation.
This multi-factor approach filters out weak or false signals, ensuring that trades align with both momentum and volume dynamics.
📏 Position Sizing & Leverage
Dynamic Position Calculation:
Qty = strategy.equity × leverage / close price
Leverage: Customizable (default = 1x), allowing traders to adjust risk exposure.
Adaptive Sizing: The strategy scales position sizes based on account equity and market price.
Slippage & Commission: Built-in slippage (2 points) and commission (0.01%) settings provide realistic backtesting results.
This ensures efficient capital allocation, preventing overexposure in volatile conditions.
🎯 Trade Management & Exits
Take Profit & Stop Loss Mechanism
Each position includes predefined profit and loss targets:
Take Profit: +10% of risk amount.
Stop Loss: Fixed at 10,100 points.
The risk-reward ratio remains balanced, aiming for controlled drawdowns while maximizing trade potential.
Visual Trade Tracking
To improve trade analysis, the strategy includes:
📌 Trade Markers:
"Buy" label when a long position opens.
"Close" label when a position exits.
📌 Trade History Boxes:
Green for profitable trades.
Red for losing trades.
📌 Horizontal Trade Lines:
Shows entry and exit prices.
Helps identify trend movements over multiple trades.
This structured visualization allows traders to analyze past performance directly on the chart.
⚡ How to Use This Strategy
1️⃣ Apply the script to a XAUUSD (Gold) 15m chart in TradingView.
2️⃣ Adjust leverage settings as needed.
3️⃣ Enable backtesting to assess past performance.
4️⃣ Monitor volume and MACD conditions to understand trade triggers.
5️⃣ Use the visual trade markers to review historical performance.
The MACD Volume Strategy is designed for short-term trading, aiming to capture momentum-driven opportunities while filtering out weak signals using volume confirmation.
