MomentumLibrary "Momentum"
Contains utilities varying algorithms for measuring momentum.
simple(fast, slow, src, fastType, slowType) Derives momentum from two moving averages of different lengths.
Parameters:
fast : The length of the fast moving average.
slow : The length of the slow moving average.
src : The series to measure from. Default is 'close'.
fastType : The type of moving average the fast should use. Values allowed are: SMA, EMA, WMA, VWMA and VAWMA.
slowType : The type of moving average the slow should use. Values allowed are: SMA, EMA, WMA, VWMA and VAWMA.
stochRSI(fast, fast, rsiLen, stochLen, src, kmode) Returns the K and D values of a Stochastic RSI. Allows for different moving averages to produce the K value.
Parameters:
fast : The length to average the stochastic.
fast : The length to smooth out K and produce D.
rsiLen : The length of the RSI.
stochLen : The length of stochastic.
src : The series to measure from. Default is 'close'.
kmode : The type of moving average to generate. Values allowed are: SMA, EMA, WMA, VWMA and VAWMA.
Returns:
macd(fast, slow, signal, src, fastType, slowType, slowType) Same as well-known MACD formula but allows for different moving averages types to be used.
Parameters:
fast : The length of the fast moving average.
slow : The length of the slow moving average.
signal : The length of average to applied to smooth out the signal.
src : The series to measure from. Default is 'close'.
fastType : The type of moving average the fast should use. Values allowed are: SMA, EMA, WMA, VWMA and VAWMA.
slowType : The type of moving average the slow should use. Values allowed are: SMA, EMA, WMA, VWMA and VAWMA.
slowType : The type of moving average the signal should use. Values allowed are: SMA, EMA, WMA, VWMA and VAWMA.
Returns:
Pengayun Momentum

CryptoGraph 3.2CryptoGraph 3.2 is an extensive version of CryptoGraph 3.
CryptoGraph 3.2 is based on 4 VWAP oscillator timeframes instead of 3.
What does it do?
CryptoGraph 3.2 visualises four different VWAPs based on four different timeframes.
- Whenever all four timeframes are increasing (this can either be above or below the 0 line), a green dot will be printed.
A green dot generally is a bullish indication.
- Whenever all four timeframes are decreasing (this can either be above or below the 0 line), a red dot will be printed.
A red dot generally is a bearish indication.
- Whenever all four timeframes have crossed above the 0 line, a green triangle will be printed.
A green triangle generally is a bullish indication.
- Whenever all four timeframes have crossed below the 0 line, a red triangle will be printed.
A red triangle generally is a bearish indication.
- Whenever the second timeframe switches from upward direction to downward, a green x will be printed.
A green x generally is a take profit indication for a long position.
- Whenever the second timeframe switches from downward direction to upward, a red x will be printed.
A red x generally is a take profit indication for a short position.
The green and red x's are by default set to 0% opacity so they won't be visible. Make sure to increase the opacity to have them visible on your chart.

+ REX OscillatorSo, what is the REX oscillator, you might be asking yourself.
"The Rex oscillator is an indicator that measures market behavior based on the relationship of the close to the open, high and low values of the same bar. A big difference between the high and close on a bar indicates weakness, and wide disparity between the low and close indicates strength. The difference between open and close also indicates market performance."
The True Value of a Bar (TVB) gives an indication of how healthy the market is. A negative close and a positive TVB (or vice versa) is an indication of the market building strength on the opposing side of the trend. The Rex oscillator is a moving average of the TVB value with the specified period.
I first came across this watching one of many No Nonsense Forex videos. Mostly, from comments I've read, it is used as an exit indicator for people who trade with a system similar or identical to the one VP espouses in his NNFX blog. I think it's perfectly apt to use as an entry indicator as well, or even as both, perhaps, depending on the moving average you chose to apply to the TVB.
There are a few other versions of this on tradingview, but I thought I'd make an updated version. Added Donchian Channels because I like the idea of a dynamic sort of overbought/sold area. I left out the basis because the indicator pivots around a center line, and has a signal line as well. A basis line just seemed like too much, and would likely not be very useful.
The additional usual things that I incorporate into my indicators are included here: optional candle coloring, alerts, and probably a too large selection of moving averages.
Credit to Nemozny for the FRAMA calculation. I may add that to other indicators I have.

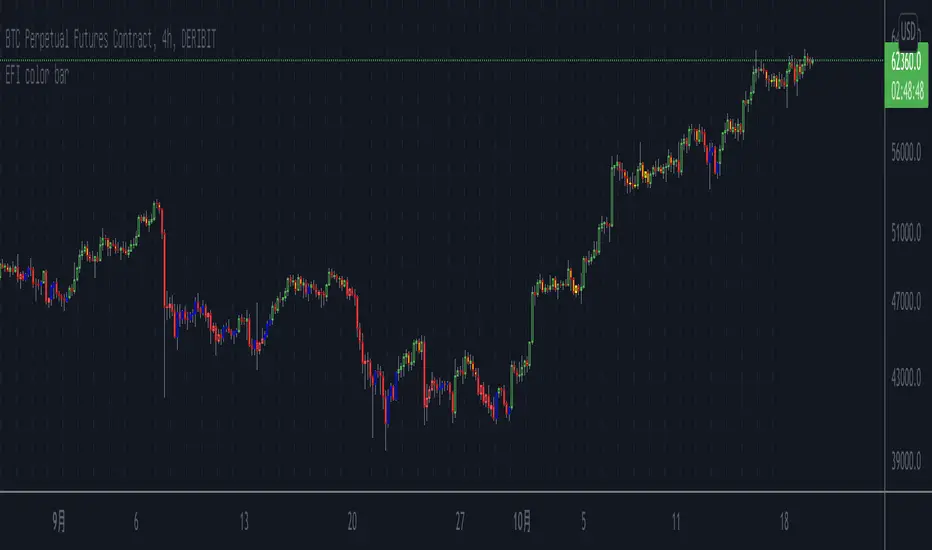
Elder's Force Index Color BarBased on the Elder's Force Index (EFI) , +/- of the EFI and its ema is used to describe the rise, fall or possible reversal of the market, and finally shown by bar color.
The green bar represents a strong bull and the red bar represents a strong bear;
The blue bar indicates that the downtrend is exhausted and may rise. Likewise the yellow bar.
Of course, it is difficult to buy the bottom and sell the top at any time. This indicator needs to be judged together with the pattern or other indicators that predict reversals in order to increase the win rate.
Happy Trading.
根据Elder's Force Index修改而成,取消了幅图指标,仅用bar color来表现上涨,下跌和转折。
绿色k线代表上涨动能充足,红色k线表示下跌动能充足;
蓝色k线表示下跌力竭,可能会上涨;
黄色k线表示上涨力竭,可能会下跌。
当然,任何时候抄底摸顶都是困难的,该指标需要和形态或者其他预测反转的指标一起判断才能增加成功率。
祝交易愉快。
緑は上昇トレンドで、赤は下落トレンドです;
青は下落が尽きて上昇する可能性があることを示すことで、黄色は上昇が終わり、下落の可能性があることを示しています。
成功率を高めるためには、パターンや反転を予測する他の指標と合わせて判断する必要があります。
Happy Trading。
Momentum and AccelerationThe following oscillator is a twist on momentum, incorporating a 2nd derivative "acceleration" to help determine changes in momentum. Both are plotted directly accessing previous series values rather than using a moving average.
The script has an option to divide so the formula is d(Price)/d(Time), like a derivative. The script also provides options for the user to use their price source, volume, or a combination of price and volume.
Credit: This script utilizes the "color gradient framework" tutorial by LucF (PineCoders) to create user-adjustable gradient visuals.
Definitions
"1st Derivative - Momentum" - Momentum is most commonly referred to as a rate and measures the acceleration of the price and/or volume of a security.
"2nd Derivative - Acceleration" - Acceleration is the rate of change of momentum.
Value Added
This script may help the trader to assess directional changes in momentum easier.
This script also plots using previous series values rather than using a moving average function. To my knowledge, I was unable to find one that does this for "2nd derivative", so it had to be created.
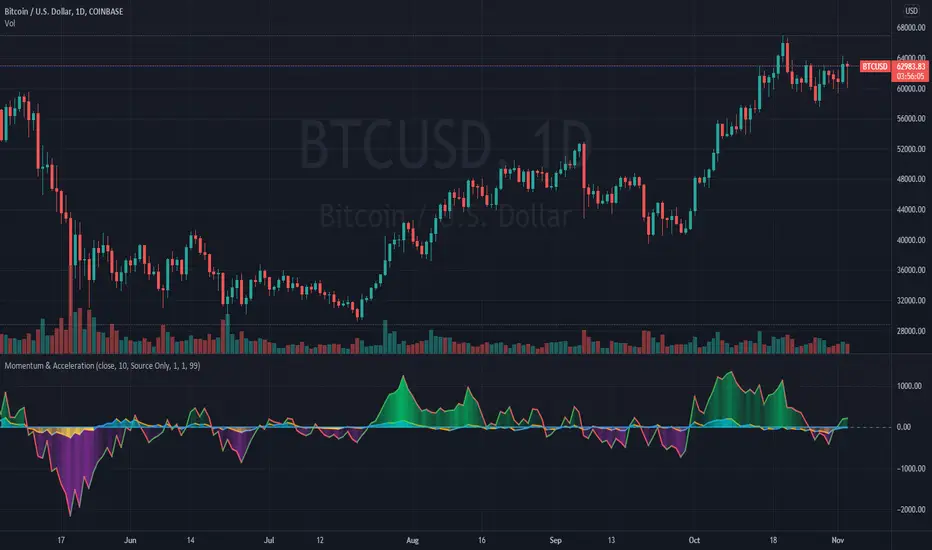
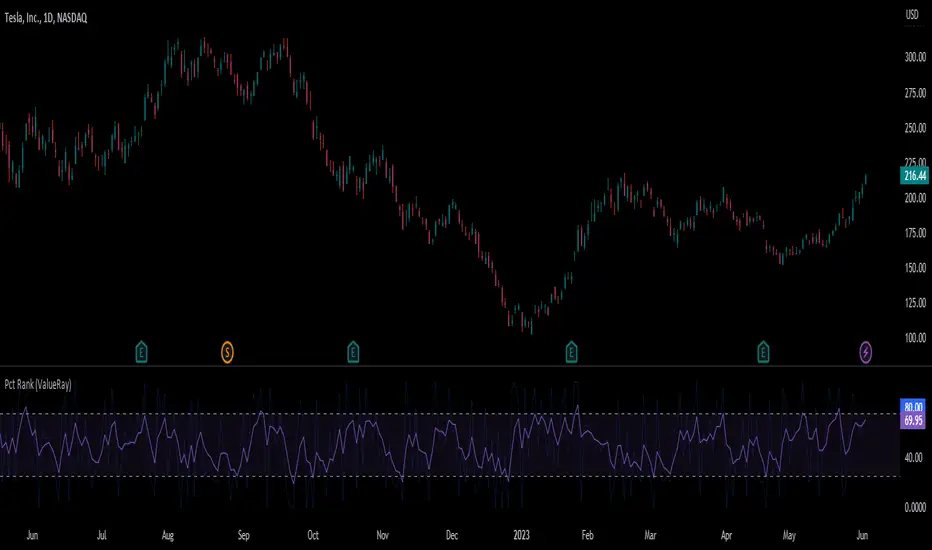
Percent Rank (ValueRay)The Percent Rank is naturally quite choppy. I therefor placed an EMA(3) over it and make the origin Percent Rank only slightly visible. I also add some boundaries.
Note that the EMA of the Percent Rank looks quite similiar to the Connors RSI.
Use it as the RSI.
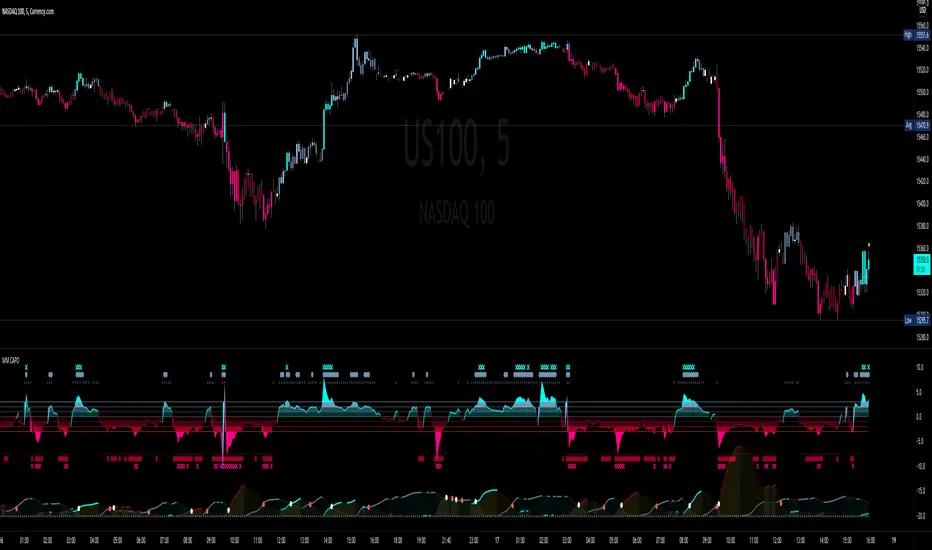
MM CAPOA Dons right Hand
Standard Deviation is the game we are playing here
-3 levels to show the strength of both buy/sell
-Colors the candles based on signal (momentum) strength
-Multi timeframe feature
-Color candles for on chart confirmation ( with sensitivity the High you set it will only give you stronger signals)
-Alerts for different level signals including 0 crossover
-Can change the strength of the signal to show what Level you would like to confirm your trades with
Also built in Momentum squeeze indicator
-the Grey line indicates (BBands) SQUEEZE setting in
-the Bright Blue line indicates the EXPANSION of the BBands ( BUY )
-the Red line indicates the Expansion of the BBands ( Sell )
How to use
Confirm your on chart Strategy with the Momentum signal Of the MM capo with your preferred level of confirmation ( Level 1-3 )
You can set alerts to let you know when momentum as pick up and you can start looking for entry ( Usually means breaks of structure )
The Squeeze Indicator can show you if the momentum confirmation is goin to continue in that directions by seeing if you are in a tight BB squeeze or not
Video Explanation On YouTube channel
Link below or PM us for access to this indicator Happy Trading
+ WaveTrend OscillatorI'm guessing most of you are familir with LazyBear's adaptation of the Wavetrend Oscillator; it's one of the most popular indicators on TradingView. I know others have done adaptations of it, but I thought I might as well, because that's kind of a thing I like doing.
In this version I've added a second Wavetrend plot. This is a thing I like to do. The longer plot gives you a longer timeframe momentum bias, and the shorter plot gives you entries and/or exits. Here we have one plot with a lookback period of 55, and another with the default set to 6 (change this to 14 if you think you might prefer something slower and that will plot similarly to the default RSI settings). With the traditional Wavetrend Oscillator there is a simple moving average on the WTO that is to help provide entries and exits. I've done away with this as there are already two plots, and I felt more would just clutter the indicator. Instead of plotting the SMA I've plotted the crosses along the bottom and top of the indicator. Also, as is not the case in LazyBear's version, this SMA length is adjustable. By default it is set to 3, which is the default setting on the original indicator.
I've also plotted background colors for when there is what I call a momentum shift. If one or the other oscillators crosses the centerline a colored bar is plotted. By default it is turned on for both WTOs, though in practice you might only want it on for the longer one.
I would say use of the indicator is similar to the original WTO or many other oscillators. Buying oversold and selling overbought, but being mindful of the momentum of the market. If the longer WTO is above the centerline it's best to be looking for dips to the centerline, or for an overbought signal by the faster WTO, and vice versa if the longer WTO is below the centerline. That said, you can also adjust the length of the SMA on the faster WTO to fine tune entries or exits, which is kind of how you would trade LazyBear's version. In this case you have that additional confirmation of market momentum.
You can set colored candles to either of the WTO plots via a dropdown menu.
There are alerts for overbought and oversold situations, centerline crosses, and Wavetrend crosses.
That's about it. Hope you enjoy this particular implementation of LazyBear's well known indicator.
Ah yes, last thing: Original version the source is set to hlc3. I've given you the opportunity to change that, so if you prefer using close you can, or whatever you want.

+ JMA KDJ with RSI OB/OS SignalsSo, what is the KDJ indicator? If you're familiar with the Stochastic, then you'll know that the two oscillating lines are called the 'K' and 'D' lines. Now you know that this is some sort of implementation of the Stochastic. But, then, what is the J? The 'J' is simply the measure of convergence/divergence of the 'K' and 'D' lines, and the 'J' crossing the 'K' and 'D' lines is representational of the 'K' and 'D' lines themselves crossing. Is this an improvement over simply using the Stochastic as it is? Beats me. I don't use the Stochastic. I stumbled upon the KDJ while surfing around the web, and it sounded cool, so I thought I'd look at it. I do like it a bit more as the 'J' line being far overextended from the other two (usually into overbought/sold territory) does give a clear visual representation of the divergence of the 'K' and 'D' lines, which you might not notice otherwise. So, from that perspective I suppose it is nicer.
But let's get to the good stuff now, shall we? What did I do here?
Well, first thing you're wondering is why there are only two lines when based on my explanation (or your previous experience with the indicator) there should be three. I found this script here on TV, by x4random, who took the 'K' and 'D' lines and made an average of them, so there is only one line instead of the two. So, fewer lines on the indicator, but still the same usefulness. It was in older TV code, so I took it to version4 and cleaned up the code slightly. His indicator included the RSI ob/os plots, and I thought this was neat (even though the RSI being os/ob doesn't tell you much except that the trend is strong, and you should be buying pullback or selling rallies) so I kept them in. His indicator was also the most visually appealing one that I saw on here, so that attracted me too. Credit to x4random for the indicator, though.
Aside from code cleanup and adding the usual bells and whistles (which I will get to) the big thing I did here was change is RMA that he was using for the 'K' and 'D' lines to a Jurik MA's, which smooth a lot of the noise of other moving averages while maintaining responsiveness. This eliminates noise (false signals) while keeping the signals of significance. It took me a while to figure out how to substitute the JMA for the RMA, but thanks to QuantTherapy's "Jurik PPO" indicator I was able to nail down the implementation. One thing you might notice is that there is no input to change signal length. I fiddled with this for a time before sticking to using the period, instead of the signal (thus eliminating the use of the signal input altogether), length to generate the 'K' and 'D' calculations. To make any adjustments other than the period length use the Jurik Power input. You can use the phase input as well, but it has much less of an effect.
Everything else I changed is pretty much cosmetic.
Candle coloring with the option to color candles based on either the 'J' line or the 'KD' line.
color.from_gradients with color inputs to make it beautiful (this is probably my best looking indicator, imo)
plots for when crosses occur (really wish there was a way to plot these over candlesticks! If anyone has any suggestions I'd love to see!)
I think that's about it. Alerts of course.
Enjoy!
Below is a comparison chart of my JMA implementation to the original RMA script.
You can see how much smoother the JMA version is. Both of these had the default period of 55 set, and the JMA version is using the default settings, while the original version is using a length of 3 for the signal line.

Ocean Indicator [CC]The Ocean Indicator was created by Jim Sloman (Ocean Theory pgs 39-47). Sadly he passed away a few years ago so it is extremely hard to find his code or more information about his trading system other than through his books so I did my best to replicate all of his work and I will be publishing his indicators over the next few weeks. Big thanks to @altcoinz for giving me all of the information I needed to replicate his work. Since this is his basic foundation for everything else he has done, I will be publishing it first. I had to change things a bit to provide clear buy and sell signals so let me know your thoughts.
This is essentially his version of a momentum indicator and the basics of it are to buy when momentum is increasing and sell when it is decreasing. I have included strong buy and sell signals in addition to normal ones and darker colors are for strong signals and lighter colors are for normal signals. Buy when the line turns green and sell when it turns red.
Let me know if there are any other indicators you would like to see me publish!

All in One StudyHere is my All in One Strategy converted into a Study with Alert Conditions you can use for whatever purpose you wish.
Each condition is set up similarly to the way I had the strategy set up, if you pick the indicators you want to base your alerts on it will alert you only if the check box is true.
You can pick one or more of the indicators if you'd like. I only suggest to pick one at a time so you don't have overlapping buy/sell alerts.
I think everyone will find the message of the market falling alert amusing :-)

All in One Strategy no RSI Label - For higher dollar cryptoThis is the All in One Strategy without the RSI suggestion label that will work well for any of the crypto currencies trading above $500 so the overlay shows up better. I am using ETH as an example on this.
Based on some comments on my previously published script that has been replaced I have added Alert Conditions to this version that can be used in other bots. You can also copy and paste these alert conditions into the other All in One script I published for the lower priced cryptocurrencies.
To use the alert conditions I have in here, you will need to convert this strategy into a study to do so. Delete the entry and exit logic at the end (lines 299 through 351), delete line 18 and paste the following in place of line 18:
study(shorttitle='Ain1 No Label',title='All in One Strategy no RSI Label', overlay=true, scale=scale.left)
Here are the settings to mimic what you see here in the back test strategy I am publishing. Remember that previous results do not guarantee future results.
Chart Time = 30 Minutes (if you didn't read my original All in One post, read it. Shorter isn't better. You lose your money faster in a shorter amount of time and I learned that the hard way)
Start Time = 1 April 2021 00:00
End Time = 31 December 2021 00:00
Trade Type = Long/Short
Stop Loss % = 20.1
Take Profit % = 14.57
RSI Length = 20
Overbought = 44
Oversold = 45
EMA Fast Length = 5
EMA Slow Length = 15
Overbought Lookback Minimum Value = 62
Overbought Lookback Bars = 3
Oversold Minimum Value = 43
Oversold Lookback Bars = 5
Source = Close
Max Lookback Period = 5
Use EMA Only = True (check the box)
K = 9
D = 17
K Mode = SMA
High Source = ohlc4
Low Source = ohlc4
Properties - Starting Amount is $3500, everything else is the same.
Any questions, feel free to ask. I will answer as soon as I can.

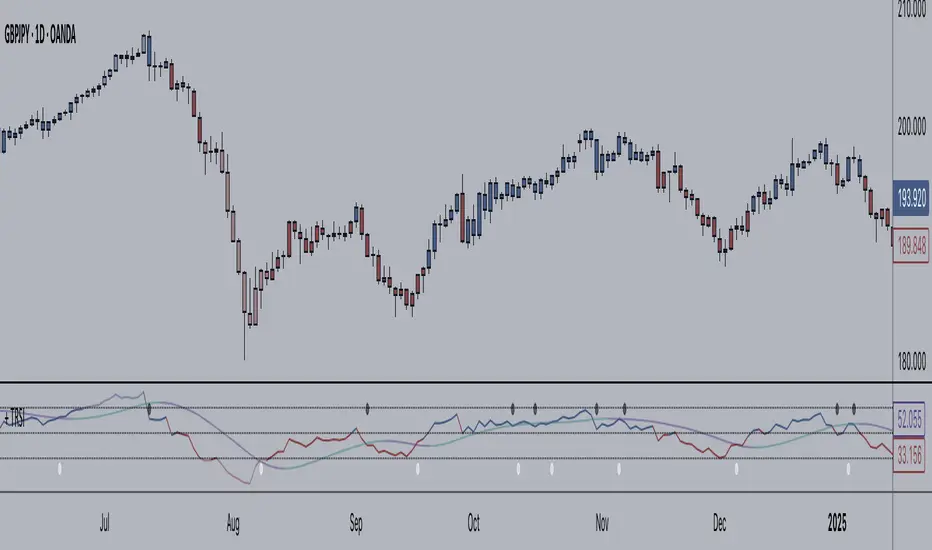
+ TRSIHello again.
Here I have an improved version of the RSI that is similar to my "+ %B" indicator (that, an improved version of the %B).
This version of the RSI includes candle coloring for bullish or bearish bias (is the RSI above or below its median line?), as well as candle coloring for overbought and oversold areas. Additionally, there is an option for coloring candles based on the RSI crossing up or down its moving average.
So, that takes us on to the moving average. You have a selection of these, namely: SMA, EMA, DEMA, TEMA, HMA, JMA, LSMA, MF, SMA (the default), TMA, VAMA, and WMA. These are all very different, so play around and choose one that fits your trading style, or whatever it is you're looking for (or even turn it off if you like!).
I've added alerts, so you can be alerted based on wherever the RSI goes. Is it oversold? Did it just cross the median? Did it cross up or down its MA?
I hope you enjoy it!

+ True RSIThis is a better, cleaner version (in my opinion) of an part of an indicator I was using that was coded up by cI8DH. I reached out to him about cleaning up the code (things weren't working) for Pinescript v4, but he no longer seems to be active, so I thought I might take it upon myself to at least work out this portion of the indicator.
Much credit goes to him. Below is the indicator that he coded, of which only one part have I made additions to.
So, he calls this the True RSI. I was using it as part of the USI, which I posted above (it's the MA Percent indicator type). To my eyes it's not far different from the standard RSI, so I probably could have just made a version of that, but I like this one, and I was excited to add a few things (like candle coloring, which no longer works with his version!).
So, what's different?
I added two different background fills.
I made the lines types for the extremities and midline more appropriate for the indicator.
I added bullish, bearish, overbought, and oversold candle coloring.
I added a multitude of moving averages as well.
If this looks like my '+ %B' indicator, that is because I basically just moved the MA's and candle coloring code over. One could probably do this with many different indicators.
In the future I will probably add alerts, and maybe MA cross candles as well. Or not. Well, almost certainly alerts. Please enjoy!
+ BB %B: MA selection, bar coloring, multi-timeframe, and alerts+ %B is, at its simplest, the classic Bollinger Bands %B indicator with a few added bells and whistles.
However, the right combination of bells and whistles will often improve and make a more adaptable indicator.
Classically, Bollinger Bands %B is an indicator that measures volatility, and the momentum and strength of a trend, and/or price movements.
It shows "overbought" and "oversold" spots on a chart, and is also useful for identifying divergences between price and trend (similar to RSI).
With + %B I've added the options to select one or two moving averages, candle coloring, and a host of others.
Let's start with the moving averages:
There are options for two: one faster and one slower. Or combine them how you will, or omit one or both of them entirely.
Here you will find options for SMA, EMA (as well as double and triple), Hull MA, Jurik MA, Least Squares MA, Triangular MA, Volatility Adjusted MA, and Weighted MA.
A moving average essentially helps to define trend by smoothing the noise of movements of the underlying asset, or, in this case, the output of the indicator.
All of these MAs available track this in a different way, and it's up to the trader to figure out which makes most sense to him/her.
MA's, in my opinion, improve the basic %B by providing a clearer picture of what the indicator is actually "seeing", and may be useful for providing entries and exits.
Next up is candle coloring:
I've added the option for this indicator to color candles on the chart based on where the %B is in relation to its upper and lower bounds, and median line.
If the %B is above the median but below the upper bound, candles will be green (showing bullish market structure). If %B is below the median but above the lower bound, candles will be red (denoting bearish market structure).
Overbought and oversold candles will also be colored on the chart, so that a quick glance will tell you whether price action is bullish/bearish or "oversold"/"overbought".
I've also added functionality that enables candles to be colored based on if the %B has crossed up or crossed down the primary moving average.
One example as a way to potentially use these features is if the candles are showing oversold coloration followed by the %B crossing up your moving average coloration. You might consider a long there (or exit a short position if you are short).
And the last couple of tweaks:
You may set the timeframe to whatever you wish, so maybe you're trading on the hourly, but you want to know where the %B is on the 4h chart. You can do that.
The background fill for the indicator is split into bullish and bearish halves. Obviously you may turn the background off, or make it all one color as well.
I've also added alerts, so you may set alerts for "overbought" and "oversold" conditions.
You may also set alerts for %B crossing over or under the primary moving average, or for crossing the median line.
All of these things may be turned on and off. You can pretty much customize this to your heart's delight. I see no reason why anyone would use the standard %B after playing with this.
I am no coder. I had this idea in my head, though, and I made it happen through referencing another indicator I was familiar with, and watching tutorials on YouTube.
Credits:
Firstly, thanks to www.tradingview.com for his brilliant, free tutorials on YouTube.
Secondly, thanks to www.tradingview.com for his beautiful SSL Hybrid indicator (and his clean code) from which I obtained the MAs.
Please enjoy this indicator, and I hope that it serves you well. :)

Customizable Percentage Price Oscillator (PPO)The PPO is basically the MACD but in percentage terms. This is better for comparing momentum across different securities.
This script is a standard PPO but with many options for customization. You can set the moving average type of the signal and the oscillator lines separately. You can also weight any moving average of the PPO by volume.
Supported Types of MA:
SMA
EMA
ALMA
HMA
WMA
Personally, I believe weighting by volume is helpful across markets but especially helpful for equities. I like to use 3,10,16 settings similar to Linda Raschke but with EMA instead of SMA. This indicator is especially useful for signaling trend continuation and generating exit signals. For entries, I believe this indicator should not be blindly followed and works better when combined with a trend or price action signal.
If there are requests for more types of moving average to be used with the PPO, I would be down to implement them, but I believe most moving averages are pretty similar.
Unleash Elder Force on Your ChartI had searched for a proper indicator to recognize important impulses, so I just need to take a look at the indicator to quickly find them on the chart. Alexander Elder's Force is the answer, although I made a few changes to the design.
First, I found more accuracy using Hull Moving Average. It steers faster making sudden spikes even more visible. Second, it is faster to catch up and therefore ready for another impulse to measure.
The second change is to the visual presentation of the Elder Force. Columns look prettier and there needs to be a manually set value that gives regular sideways moves a border beside which it is likely to be either an institutional interference or a trend.
Furthermore, you can plot (minus) Elder Force in the indicator window too. This should be used to compare upside and downside thrusts with each other.
I don't use nor intend to use Elder Force as a buy/sell indicator. The point is to highlight certain price-action moments that I will then review and consider an entry after. I believe most indicators should be used like that.
:)

Confirmation (Expo)
Confirmation (Expo) is a trading confirmation tool that can confirm any indicator, trend, setup, signal, or strategy. Once you have chosen the input source (any indicator) you can use the tool to confirm the trend, trend strength, overbought/oversold areas, retracements, and reversals. This tool is built for traders that already have a strategy or preferred indicator that they want to confirm. As a default, the indicator oscillates between overbought (or strong positive trend)/oversold (or strong negative trend). However, depending on the settings and input source many different layouts can occur.
Real-Time Alerts
No Repainting
Works on any market and in any timeframe
HOW TO USE
To confirm any indicator, trend, setup, signal, or strategy
INDICATOR IN ACTION
4 hour - chart
I hope you find this indicator useful , and please comment or contact me if you like the script or have any questions/suggestions for future improvements. Thanks!
I will continually work on this indicator, so please share your experience and feedback as it will enable me to make even better improvements. Thanks to everyone that has already contacted me regarding my scripts. Your feedback is valuable for future developments!
-----------------
Disclaimer
Copyright by Zeiierman.
The information contained in my scripts/indicators/strategies/ideas does not constitute financial advice or a solicitation to buy or sell any securities of any type. I will not accept liability for any loss or damage, including without limitation any loss of profit, which may arise directly or indirectly from the use of or reliance on such information.
All investments involve risk, and the past performance of a security, industry, sector, market, financial product, trading strategy, or individual’s trading does not guarantee future results or returns. Investors are fully responsible for any investment decisions they make. Such decisions should be based solely on an evaluation of their financial circumstances, investment objectives, risk tolerance, and liquidity needs.
My scripts/indicators/strategies/ideas are only for educational purposes!
ACCESS THE INDICATOR
• Contact me on TradingView or use the links below

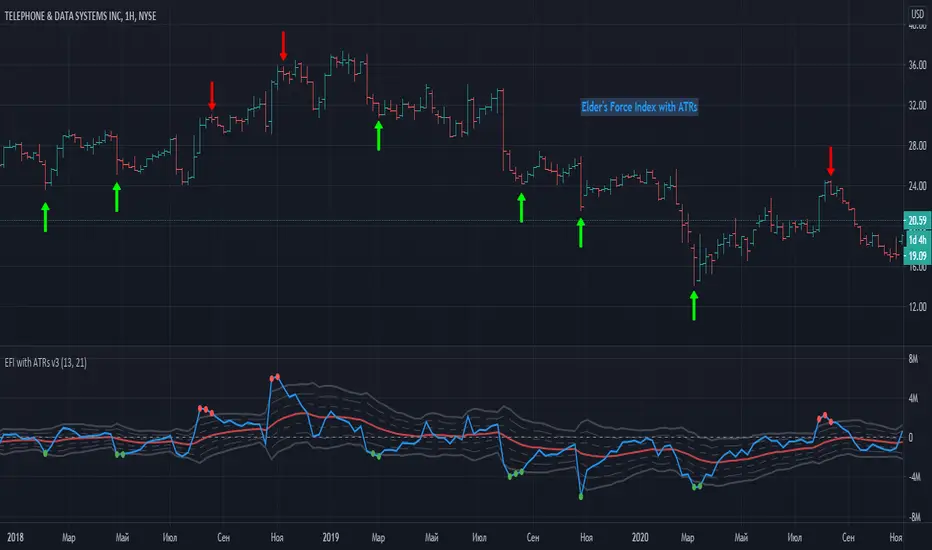
Elder Force Index With ATR ChannelsInspired by the new version of the "Force Index" announced by Dr. Alexander Elder a few years ago - "Elder Force Index With ATR Channels".
Unfortunately original version of script only works on MetaTrader platforms, so this is an attempt to
implement this great idea on TradingView too.
------------------------------------------------------------------------------------------------------------------------------------------------------------------------
Here is original script explanation by Dr. Elder himself
-------------------------------------------------------------------
Adding Average True Range (ATR) channels to Force Index had been suggested by Kerry Lovvorn.
Adding these channels turns Force Index into an excellent tool for identifying intermediate tops and bottoms.
Force Index with ATR channels does not catch all turns, but the ones it identifies deserve very serious attention.
Note: the word “true” in Average True Range refers to dealing with price gaps. Since there are no gaps in Force Index, here ATR is the same as the Average Range.
Whenever the Force Index rises above or falls below its 3-ATR channel, it signals that the ticker has reached an area of an unsustainable extreme.
That’s where rallies and declines become exhausted and prices tend to reverse. This is one of very few tools that are equally efficient in calling both top and bottom areas.
In our experience, these signals work especially well on the weekly charts.
Of course, users are welcome to experiment with them in any timeframe.
One possible option is to use the new Force Index with ATR Channels on your weekly charts and the original Force Index on your daily chart.
------------------------------------------------------------------------------------------------------------------------------------------------------------------------
- The Force Index is drawn in blue with a thick line.
- The Averaged Force is a solid red line.
- The upper and lower bands at 1 ATR are drawn in dotted lines.
- The upper and lower bands at 2 ATR use dashed lines.
- The upper and lower bands at 3 ATR are solid gray lines.
- Red dots placed above the plot when the EMA of Force Index rises above the 3-ATR channel.
- Green dots placed underneath the plot when that EMA declines below the 3-ATR channel.
***** Original script programmed to truncate values at the 4-ATR level to prevent any extreme value from flattening the rest of the plot -
- I'm not yet implemented this feature here - hopefully coming soon.
Force Index with Advanced Features [Quant_]This is the traditional Force Index indicator developed by Alexander Elder and described in his book "Trading For a Living" . As you probably know, the Force Index measures the amount of power used to move the price of an asset. The formula is pretty simple - the difference between the current and the previous close is multiplied by the volume of the current close. However, I wanted to add some additional features to the indicator, so that you have more control over it. Improvements include:
- Choose the length of the Force Index
- Choose the time frame of the FI (you can choose a smaller time frame and get a more detailed overview);
- Smoothing of the results through a Moving Average (Simple, Exponential, Weighted, Running or Hull);
- Choose the time frame of the smoothing MA for even greater control;
- Color changing depending on the increasing or decreasing smoothed Force Index;
I used to use Force Index for spotting divergences and exhaustions and it worked pretty well, but it does require some time until you get used to it. Bear in mind that you shouldn't jump against the trend on every divergence that occurs, but use it as a complementary indicator to your trading system. I am planning to add some additional features to this indicator to make it more robust, so stay tuned.
I hope you find this indicator useful. As usual, if you have any questions or suggestions on how to improve my indicators, please let me know. Thanks.

Cycle Swing MomentumAdaptive Ultra-Smooth Momentum indicator
The Cycle-Swing-Indicator "CSI" provides an optimized "momentum" oscillator based on the current dominant cycle by looking at the swing of the dominant cycle instead of the raw source momentum. Offering the following improvements:
Smoothness
Zero delay
Sharpness at turning points
Robust and adaptable to market conditions
Accurate deviation detection
The following common problems with standard indicators are solved by this indicator:
First, normal indicators introduce a lot of false signals due to their noisy signal line. Second, to compensate for the noise, one would normally try to add some smoothing. But this only results in adding more delay to the indicator, which makes it almost useless. Third, standard indicators require a length adjustment to derive reliable signals. However, you never know how to set the right length.
All three problems described above are solved by the developed adaptive cyclic algorithm.
The above chart shows current Bitcoin 4h data from the last days as of writing with the proposed signal reading for this indicator. The standard momentum indicator is included for comparison.
HOW TO USE
The indicator works without any parameter and can be applied to any chart and any time-frame. It will adapt automatically to the Dominant Cycle and use the dominant cycle of the source data to derive the ultra smooth momentum curve. Adaptive upper/lower bands are included and highlight areas with extreme readings. Automatic divergence detection can be turned off/on.
HOW TO READ
The indicator can be used like any oscillator. In addition, it provides adaptive high and low bands.
* Look for turns above the upper/lower bands
* Look for divergences between source and signals line
Further reading/Original source:
The indicator uses the dominant cycle to optimize signal, smoothing and cyclic memory. To get more in-depth information on the Cycle Swing Indicator, please read Chapter 10 "Cycle Swing Indicator: Trading the swing of the dominant cycle" of the book "Decoding the Hidden Market Rhythm, Part 1" available at your favorite book store.
Related ideas:
Please also check the cyclic RSI indicator which also uses cyclic information to improve the signal.

Momentum Drift Oscillator™TradeChartist Momentum Drift Oscillator is a elegantly designed Oscillator that uses both trend following and mean reversion models, that helps visualize the price momentum, based on user defined lookback period and standard deviation.
===================================================================================================================
Momentum Drift Oscillator ( MDO ) Features:
MDO shows how far away the price is, from the mean, based on Lookback Length (21, 34, 55, 89, 144, 233) and Standard Deviation input (Min - 0.236, Max - 2.0) , and helps understand potential price reversal points based on mean reversion principles.
Drift Visualizer helps visualise the velocity with which Price moves and helps the trader spot various momentum drift zones like Fuel zones, Overbought/Oversold areas and Bull/Bear Exhaustion limits. Drift Visualizer above 150 is usually Overbought and value above 200 is Super Overbought. Similarly, value below -150 is usually Oversold and value below -200 is Super Oversold.
Option to enable and disable coloured bars based on Momentum Drift. (Colour intensity on Price bars helps visualise the price momentum - 2 Colour Schemes available from the settings - Chilli and Flame).
Long and Short Trade Alerts can be created using Once Per Bar Close .
The indicator does not repaint. Alerts may display potential repaint warning, but this is because the code uses bar index for Drift Visualizer labels. For confidence in the indicator, it can be tested using bar replay to make sure the real-time and bar replay trade entries and plots stay on the same bar/timestamp.
MDO can be connected to ™TradeChartist Plug and Trade to generate Trade Entries, Targets, Sop Loss plots etc and to create all types of alerts.
===================================================================================================================
Why is Momentum Drift Oscillator ( MDO ) different from traditional Momentum based indicators?
This Momentum Drift model truly combines mean reversion and trend following principles, but with a unique original idea.
It needs 2 user defined inputs - Lookback length and Standard Deviation. If for example, say the trend is Bullish and MDO is above 0, the Oscillator doesn't go below 0, even if there is extreme bull exhaustion, if the trend based on lookback and standard deviation is not favorable to reverse trades.
Only Fibonacci lookback periods (21, 34, 55, 89, 144, 233) are used as they have been found more effective than other periods. The default Lookback period is 55 and Standard Deviation is 1, but this can be changed from the settings. Lower values of Lookback period go well with higher Standard Deviation and higher values of Lookback period go well with lower Standard Deviation (0.5, 0.618, 0.786, 0.886, 1 etc.), based on trading style and personal risk strategy.
The indicator includes a Drift Visualizer that helps spot important trade zones based on Price Velocity, calculated dynamically for every bar based on user defined parameters. The first move above or below 0 always opens at Bull Fuel or Bear Fuel zone and the exhaustion zones are reached only at the time of price returning to the mean. But it doesn't change direction if the trend is still up, so the trader can make an informed decision as to when to reverse trades, based on another confirmator.
Similarly, when the Visualizer reaches Fuel or Support/Resistance zones, it normally needs a bit of a push to reach the Overbought - Super Overbought/Oversold - Super Oversold levels where the price normally starts reversing back to the mean and this whole process can be visualized through Visualizer labels on MDO. This process eliminates a lot of noise that normally comes with traditional Momentum indicators.
===================================================================================================================
Example Charts:
1. XAU-USD 1hr chart - Lookback - 55, Std Dev - 2
2. ADA-USDT 4hr chart - Lookback - 89, Std Dev - 1
3. WTI - USOIL Daily chart - Lookback - 34, Std Dev - 1.618
4. SPX Daily chart - Lookback - 144, Std Dev - 0.236
5. GBP-USD 15m chart - Lookback - 144, Std Dev - 0.618
6. BTC-USD 1hr connected to Plug and Trade - Lookback - 55, Std Dev - 1
===================================================================================================================
Best Practice: Test with different settings first using Paper Trades before trading with real money
===================================================================================================================
This is not a free to use indicator. Get in touch with me (PM me directly if you would like trial access to test the indicator)
Premium Scripts - Trial access and Information
Trial access offered on all Premium scripts.
PM me directly to request trial access to the scripts or for more information.
===================================================================================================================

Relative Strength of Volume Indicators by DGTThe Relative Strength Index (RSI) , developed by J. Welles Wilder, is a momentum oscillator that measures the speed and change of price movements.
• Traditionally the RSI is considered overbought when above 70 and may be primed for a trend reversal or corrective pullback in price, and oversold or undervalued condition when below 30. During strong trends, the RSI may remain in overbought or oversold for extended periods.
• Signals can be generated by looking for divergences and failure swings. If underlying prices make a new high or low that isn't confirmed by the RSI, this divergence can signal a price reversal. If the RSI makes a lower high and then follows with a downside move below a previous low, a Top Swing Failure has occurred. If the RSI makes a higher low and then follows with an upside move above a previous high, a Bottom Swing Failure has occurred
• RSI can also be used to identify the general trend. In an uptrend or bull market, the RSI tends to remain in the 40 to 90 range with the 40-50 zone acting as support. During a downtrend or bear market the RSI tends to stay between the 10 to 60 range with the 50-60 zone acting as resistance
This study aim to implement Relative Strength concept on most common Volume indicators, such as
• Accumulation Distribution is a volume based indicator designed to measure underlying supply and demand
• Elder's Force Index (EFI) measures the power behind a price movement using price and volume
• Money Flow Index (MFI) measures buying and selling pressure through analyzing both price and volume (used as it is)
• On Balance Volume (OBV) , created by Joe Granville, is a momentum indicator that measures positive and negative volume flow
• Price Volume Trend (PVT) is a momentum based indicator used to measure money flow
Plotting will be performed for regular RSI and RSI of Volume indicator (RSI(VOLX)) selected from the dialog box, where the possibility to apply smoothing is provided as option. Additionally, labels can be added optionally to display the value and name of selected volume indicator
Secondly, ability to present Volume Histogram within the same study along with its Moving Average or Volume Oscillator based on selection
Finally, Volume Based Colored Bars , a study of Kıvanç Özbilgiç is added to emphasis volume changes on top of the bars
Nothing excessively new, the study combines RSI with;
- RSI concept applied to some of the common Volume indicators presented with a highlighted over/under valued threshold area, optional labeling and smoothing,
- added Volume data with additional information and
- colored bars based on volume
Thanks @Vishant_Meshram for the inspiration 🙏
Disclaimer:
Trading success is all about following your trading strategy and the indicators should fit within your trading strategy, and not to be traded upon solely
The script is for informational and educational purposes only. Use of the script does not constitute professional and/or financial advice. You alone have the sole responsibility of evaluating the script output and risks associated with the use of the script. In exchange for using the script, you agree not to hold dgtrd TradingView user liable for any possible claim for damages arising from any decision you make based on use of the script
