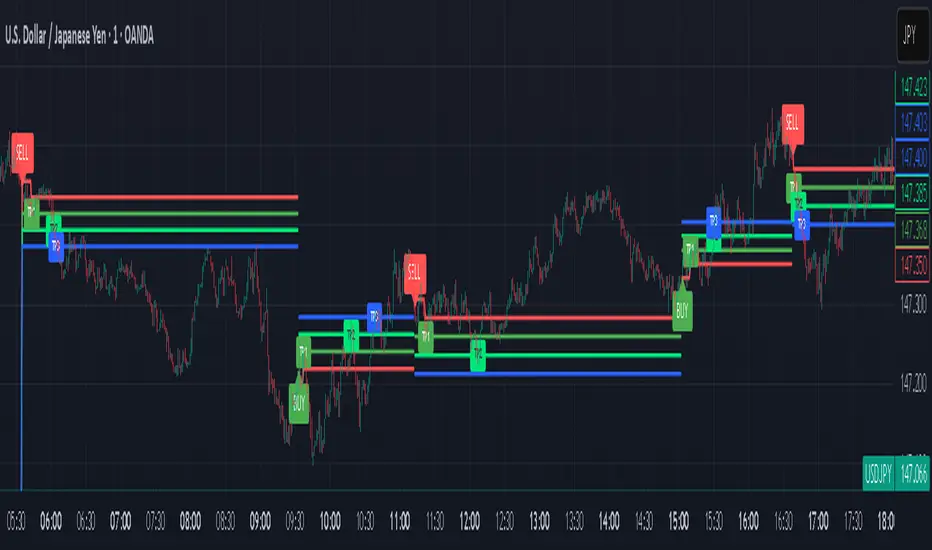
HTF MACD Dual Zero Cross + First EMA PullbackThis script aims to get the trader on the right side of the momentum and get better entries by only alerting when price pulls back to the trader's specified EMA.
This script isnt meant to catch tops or bottoms but to trade with the momentum once it starts.
This script will alert whe nthe MACD and signal line both cross the zero line, after that the script waits for price to make a pullback and then alet either a sell or buy. Ive found this works best when you trade with the trend on a higher timeframe.
You can use whatever MACD settings you prefer and really customize this to the asset youre trading.
You can also change whether you get an alert based on a wick touch of the EMA or a candle close.
Momentumstrategy

RSI(Min-Max)RSI (Min-Max) is an enhanced version of Welles Wilder's Relative Strength Index, designed to offer greater analytical precision and dynamic insight into the behavior of the RSI within each candlestick.In addition to displaying the traditional RSI value, this script calculates the possible extreme values — the minimum and maximum RSI — based on the low and high prices of the current candle. This allows you to estimate how the RSI would react if the price moved to the extremes of the bar, providing a predictive and refined reading of momentum.

True Strength Index with Crossovers Alerts🚀 True Strength Index (TSI) with Visual Crossover Alerts
Hey everyone! I’m sharing my customized True Strength Index (TSI) indicator, which I've boosted with clear visual signals and alert conditions based on my personal, high-probability trading strategy.
The True Strength Index is a powerful, oscillation-based momentum indicator that smooths price movements twice using Exponential Moving Averages (EMAs). This double-smoothing process helps to filter out market noise, giving you a much clearer view of momentum changes than basic indicators.
🛠️ How This Script Works
This script focuses on the crucial interaction between the TSI line and its Signal Line:
TSI Line (Blue): Tracks momentum direction and strength.
Signal Line (Red): A simple EMA of the TSI line, used to determine short-term trend shifts.
Visual Buy/Sell Signals:
To make signals impossible to miss, I've added distinct visual markers:
🟢 Green Dot: A "Buy Signal" is plotted at the bottom of the indicator pane when the TSI crosses above the Signal Line (bullish crossover).
🔴 Red Dot: A "Sell Signal" is plotted at the bottom when the TSI crosses below the Signal Line (bearish crossover).
Additionally, I've included named alertconditions so you can set up real-time notifications for these exact crossovers in the TradingView Alert system.
🧠 My Trading Logic: Combining TSI with RSI
I don't use the TSI in isolation. My favorite approach is to use this TSI indicator as a timing tool, but only when it aligns with the overall momentum context defined by the Relative Strength Index (RSI).
This is the key to my strategy:
Bullish Trade Filter: I only take a BUY signal (Green Dot) when my RSI indicator is already in a bullish territory (above 50).
Bearish Trade Filter: I only take a SELL signal (Red Dot) when my RSI indicator is already in a bearish territory (below 50).
This combination ensures you are trading with the underlying momentum trend, improving the probability of success.
⚙️ My Recommended Custom Settings
For the best results with this strategy, I recommend using the following custom settings. You can enter these values in the "Inputs" tab when adding the indicator to your chart.
1. TSI (Alerts) Settings
Long Length - 60
Higher value for smoother price change data.
Short Length -30
Medium-term smoothing for clearer momentum shifts.
Signal Length - 9
Short length for a responsive signal line.
2. Companion RSI Settings (RSI+)
RSI Length - 150
A long look-back period for highly accurate trend filtering.
MA1 Length - 60
Used for additional smoothing.
MA2 Length - 150
Used for powerful trend confluence.

Momentum Swing 1–3 Weeks
✅ Entry (LONG) Conditions
Price above EMA9 and SMA20
SMA20 > SMA50 (trend confirmation)
MACD above the signal line
RSI between 50–65 (healthy momentum)
Volume at least 20% above the 20-day average
When all conditions align, a LONG signal is generated.
✅ Exit (SELL) Conditions
Price closes below EMA9
MACD gives a bearish crossover
Or TP/SL levels are hit
Position is closed.
✅ Multi-Stage Take Profit
TP1: ATR × 1.5 → closes 50% of the position
TP2: ATR × 3.0 → closes remaining 50%
✅ Stop Loss
ATR × 1.5 dynamic SL
✅ What This Strategy Aims For
Catching early trend continuation signals
Filtering weak / low-volume breakouts
Exiting when momentum fades
Eliminating emotional decision-making through rules
📌 Note
Backtest performance may vary by symbol and volatility. Proper risk management is strongly recommended.

Hello Crypto! Modern Combo Snapshot
Unified long/short analyzer blending EMA structure, SuperTrend, WaveTrend, QQE, and volume pressure.
Background shading flags “watch” and “ready” states; optional long/short modules let you focus on one side.
Alerts fire when every checklist item aligns, while the side-panel table summarizes trend, momentum, liquidity, and overall score in real time.
Indicator → Trend Analysis
Indicator → Momentum Oscillators
Indicator → Volume Indicators
Tags:
cryptocurrency, bitcoin, altcoins, trend-following, momentum, volume, ema, supertrend, intraday, swing-trading, alerts, checklist, trading-strategy, risk-management

Divergences: Price × RSI × OBV The Triple Confirmation Divergence indicator is a sophisticated momentum and volume-based tool designed to identify high-probability trend exhaustion points and potential reversals. It moves beyond traditional single-indicator divergence analysis by synthesizing signals from three core pillars of technical analysis: Price Action, Momentum, and Volume Flow.
This indicator works better on the time frames: 1H, 4H, 1D, 1W and 1M.

Smart Breakout Detector: Trendline Retest & Angle FilteringDetect trendline breakouts with two important filtering controls: retest validation and angle filtering. Require multiple price retests (2-4 touches) before a trendline is considered valid, eliminating weak single-touch lines. Set precise angle limits to filter out unreliable steep or shallow trendlines. Three independent timeframe sets (fast/medium/slow) with customizable pivot lengths allow you to get low risk entry point for both short-term and major trend continuations/reversals.
═══════════════════════════════════════════
CORE METHODOLOGY
═══════════════════════════════════════════
This indicator identifies trendline breakouts using two configurable filtering parameters that are uncommon in publicly available indicators:
1. RETEST VALIDATION
Requires a specified number of price touches (2-4) before considering a trendline valid. This reduces false signals from randomly aligned single-touch lines. Higher thresholds decrease signal frequency while increasing reliability.
2. ANGLE FILTERING
Applies maximum angle constraints (0-20) to trendlines independently for resistance and support, both upward and downward slopes. This filters trendlines with extreme angles that typically lack predictive value.
═══════════════════════════════════════════
TECHNICAL IMPLEMENTATION
═══════════════════════════════════════════
DETECTION ALGORITHM:
1. Identifies pivot highs/lows using configurable lookback periods
2. Connects pivots within ATR-based proximity threshold
3. Validates trendlines only after minimum retest requirement is met
4. Applies angle constraints using arctangent calculations
5. Verifies no price penetration occurred between pivot points
6. Triggers breakout signals when price breaches validated lines
THREE INDEPENDENT TREND LINE BANKS:
The indicator operates three parallel detection systems with separate parameters:
- Level Set A: Short pivot periods (default 5 bars)
- Level Set B: Medium pivot periods (default 10 bars)
- Level Set C: Long pivot periods (default 6 bars)
Each system maintains independent arrays of resistance and support lines.
ADAPTIVE COMPONENTS:
- Proximity tolerance scales with ATR(40) to accommodate volatility
- Angle thresholds adjust using combined absolute and percentage ATR factors
- Line lifespan configurable by bar count (default 180/200/300 bars per set)
══════════════════════════════════════════
USE CASES
══════════════════════════════════════════
Appropriate for:
- Filtering breakout candidates by reliability metrics
- Multi-timeframe trendline analysis
- Automated breakout monitoring
- Reducing chart noise from weak trendlines
Not appropriate for:
- Range-bound or highly choppy markets
- Instruments with insufficient historical data
- Strategies requiring predictive (non-historical) trendlines

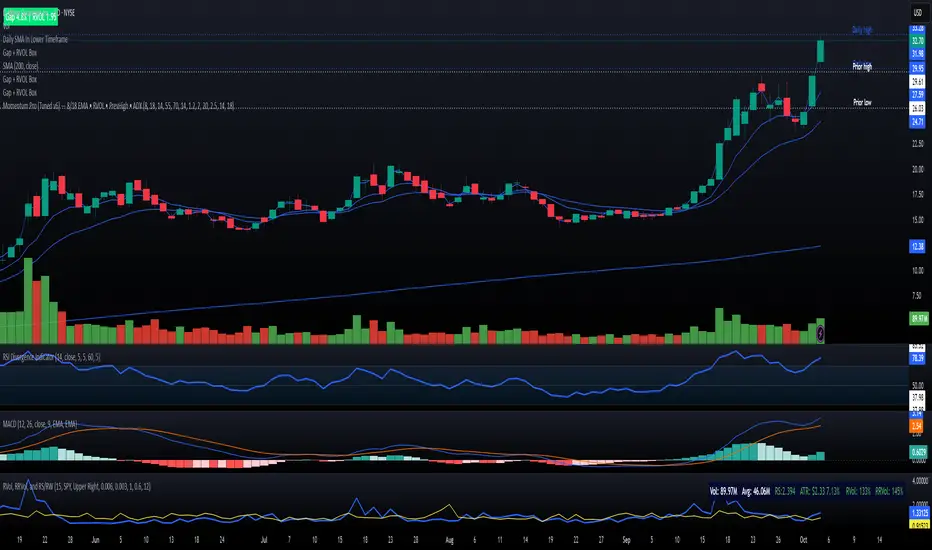
Momentum Pro (Tuned v6) — 8/18 EMA • RVOL • PrevHigh • ADXMomentum strategy with signals (VWAP + 9/20 EMA alignment, MACD hist > 0, RSI 55–70, RVOL filter, ATR stop, 2R target
RSI Momentum ScalperOverview
The "RSI Momentum Scalper" is a Pine Script v5 strategy crafted for trading highly volatile markets, with a special focus on newly listed cryptocurrencies. This strategy harnesses the Relative Strength Index (RSI) alongside volume analysis and momentum thresholds to pinpoint short-term trading opportunities. It supports both long and short trades, managed with customizable take profit, stop loss, and trailing stop levels, which are visually plotted on the chart for easy tracking.
Why I Created This Strategy
I developed the "RSI Momentum Scalper" because I was seeking a reliable trading strategy tailored to newly listed, highly volatile cryptocurrencies. These assets often experience rapid price fluctuations, rendering traditional strategies less effective. I aimed to create a tool that could exploit momentum and volume spikes while managing risk through adaptable exit parameters. This strategy is designed to address that need, offering a flexible approach for traders in dynamic crypto markets.
How It Works
The strategy utilizes RSI to identify momentum shifts, combined with volume confirmation, to trigger long or short entries. Trades are controlled with take profit, stop loss, and trailing stop levels, which adjust dynamically as the price moves in your favor. The trailing stop helps lock in profits, while the plotted exit levels provide clear visual cues for trade management.
Customizable Settings
The script is highly customizable, allowing you to adjust it to various market conditions and trading styles. Here’s a brief overview of the key settings:
Trade Mode: Select "Both," "Long Only," or "Short Only" to determine the trade direction.
(Default: Both)
RSI Length: Sets the lookback period for the RSI calculation (2 to 30).
(Default: 8)
A shorter length increases RSI sensitivity, suitable for volatile assets.
RSI Overbought: Defines the upper RSI threshold (60 to 99) for short entries.
(Default: 90)
Higher values signal stronger overbought conditions.
RSI Oversold: Defines the lower RSI threshold (1 to 40) for long entries.
(Default: 10)
Lower values indicate stronger oversold conditions.
RSI Momentum Threshold: Sets the minimum RSI momentum change (1 to 15) to trigger entries.
(Default: 14)
Adjusts the sensitivity to price momentum.
Volume Multiplier: Multiplies the volume moving average to filter high-volume bars (1.0 to 3.0).
(Default: 1)
Higher values require stronger volume confirmation.
Volume MA Length: Sets the lookback period for the volume moving average (5 to 50).
(Default: 13)
Influences the volume trend sensitivity.
Take Profit %: Sets the profit target as a percentage of the entry price (0.1 to 10.0).
(Default: 4.15)
Determines when to close a winning trade.
Stop Loss %: Sets the loss limit as a percentage of the entry price (0.1 to 6.0).
(Default: 1.85)
Protects against significant losses.
Trailing Stop %: Sets the trailing stop distance as a percentage (0.1 to 4.0).
(Default: 2.55)
Locks in profits as the price moves favorably.
Visual Features
Exit Levels: Take profit (green), fixed stop loss (red), and trailing stop (orange) levels are plotted when in a position.
Performance Table: Displays win rate, total trades, and net profit in the top-right corner.
How to Use
Add the strategy to your chart in TradingView.
Adjust the input settings based on the cryptocurrency and timeframe you’re trading.
Monitor the plotted exit levels for trade management.
Use the performance table to assess the strategy’s performance over time.
Notes
Test the strategy on a demo account or with historical data before live trading.
The strategy is optimized for short-term scalping; adjust settings for longer timeframes if needed.

EMA / WMA RibbonMomentum Flow Ribbon
Unlock a clear, visual edge in identifying short-term momentum shifts with the Momentum Flow Ribbon.
This indicator was born from a simple yet powerful concept: to visually represent the dynamic relationship between a fast-reacting Exponential Moving Average (EMA) and the smoother, more methodical Wilder's Moving Average (WMA). While both moving averages use the same length, their unique calculation methods cause them to separate and cross, creating a "ribbon" that provides an immediate and intuitive gauge of market momentum.
This tool is designed for the disciplined trader who values clean charts and actionable signals, helping you to execute your strategies with greater confidence and precision.
How It Works
The script plots an EMA and a Wilder's Moving Average (referred to as rma in Pine Script) of the same length. The space between these two lines is then filled with a colored ribbon:
Bullish Green/Teal: The ribbon turns bullish when the faster EMA crosses above the slower Wilder's MA, indicating that short-term momentum is strengthening to the upside.
Bearish Red: The ribbon turns bearish when the EMA crosses below the Wilder's MA, signaling that short-term momentum is shifting to the downside.
The inherent "lag" of the Wilder's MA, a feature designed by J. Welles Wilder Jr. himself, acts as a steady baseline against which the more sensitive EMA can be measured. The result is a simple, zero-lag visual that filters out insignificant noise and highlights meaningful changes in trend direction.
Key Features
Customizable Length and Source: Easily adjust the moving average length and price source (close, hl2, etc.) to fit your specific trading style and the instrument you are trading, from futures like MES and MNQ to cryptocurrencies and forex.
Customizable Colors: Tailor the ribbon's bullish and bearish colors to match your personal chart aesthetic.
Built-in Alerts: The script includes pre-configured alerts for both bullish (EMA crosses above WMA) and bearish (EMA crosses below WMA) signals. Never miss a potential momentum shift again.
Clean & Lightweight: No clutter. Just a simple, effective ribbon that integrates seamlessly into any trading system.
Practical Application for the Discerning Trader
For a futures trader, timing is everything. This ribbon is not just another indicator; it's a tool for confirmation.
Imagine you've identified a key level—a Volume Profile POC, the previous day's low, or a critical accumulation zone. As price approaches this level pre-London session, you're watching for a sign of institutional activity. A flip in the ribbon's color at that precise moment can provide the powerful confirmation you need to enter a trade, trusting that you are aligning with the building liquidity and momentum heading into the New York open.
This is a tool for those who aspire to greatness in their trading—who understand that the edge is found not in complexity, but in the flawless execution of a simple, well-defined plan.
Add the Momentum Flow Ribbon to your chart and start seeing momentum in a clearer light.

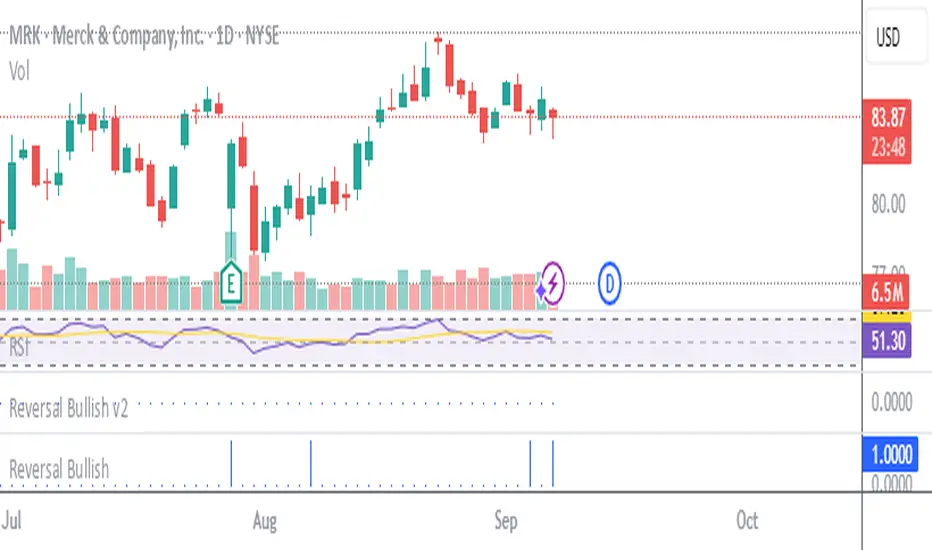
Stockbee Reversal BullishCustom indicator for identifying stocks that meet the Stockbee's Reversal Bullish criteria. This can be used as a standalone indicator or use it to screen for stocks in Pine Screener.

Momentum Index [BigBeluga]The Momentum Index is an innovative indicator designed to measure the momentum of price action by analyzing the distribution of positive and negative momentum values over a defined period. By incorporating delta-based calculations and smoothing techniques, it provides traders with a clear and actionable representation of market momentum dynamics.
🔵 Key Features:
Delta-Based Momentum Analysis:
Calculates the momentum of price by comparing its current state to its value from a defined number of bars back.
Inside a loop, it evaluates whether momentum values are above or below zero, producing a delta value that reflects the net momentum direction and intensity.
Double EMA Smoothing:
Smooths the raw delta-based momentum values with a double EMA filter, reducing noise and providing a clearer trend signal.
tmi(len) =>
sum = 0.0
sum1 = 0.0
above = 0.0
below = 0.0
src_ = src - src
for i = 0 to len
sum := sum + (src_ > nz(src_ ) ? 1 : -1)
sum1 := sum1 + (sum > 0 ? 1 : -1)
sum1 := emaEma(sum1, 10)
for i = 1 to len
above := above + (sum1 > 0 ? 1 : 0)
below := below + (sum1 > 0 ? 0 : 1)
Directional Momentum Signals:
Generates momentum shift signals and displays them on both the oscillator and the main chart:
- △ Aqua Triangles: Represent upward momentum shifts.
- ▽ Red Triangles: Represent downward momentum shifts.
Dynamic Gradient Display:
Highlights momentum zones with gradient fills:
- Aqua shades for positive momentum (above zero).
- Red shades for negative momentum (below zero).
Dashboard Display:
A dashboard summarizing the count of momentum values above and below zero for the defined period (Sentiment Length e.g. 100), helping traders assess market sentiment at a glance.
🔵 How It Works:
The indicator takes price momentum as its source and evaluates the number of momentum values above and below zero within a defined period.
The delta calculation aggregates this information, providing a net representation of the prevailing market momentum.
A double EMA filter is applied to the delta values, smoothing the momentum line and enhancing signal clarity.
Momentum shifts are highlighted with visual signals on the oscillator and price chart, while the gradient display provides a visual representation of intensity.
🔵 Use Cases:
Momentum Tracking: Identify whether market momentum is predominantly bullish or bearish.
Signal Confirmation: Use chart-based signals to confirm potential trend reversals or continuation.
Analyze Market Strength: Leverage the dashboard to quickly assess the distribution of momentum over the chosen period.
Overbought/Oversold Conditions: Utilize gradient zones to detect areas of momentum extremes and possible price exhaustion.
Momentum Index offers a refined approach to analyzing momentum dynamics, combining delta-based calculations with smoothing techniques and intuitive visuals, making it an essential tool for traders looking to anticipate market movements effectively.

Distance from 50 SMA in ADR TermsIndicator produces a multiple of ADR% from the 50-day simple moving average to determine is a stock or etf is extended.
Signalgo VSignalgo V: Technical Overview and Unique Aspects
Signalgo V is a technical indicator for TradingView that integrates multiple layers of analysis: moving averages, MACD, Bollinger Bands and RSI to deliver buy and sell signals. Below is an informational breakdown of how the indicator functions, its input parameters, signal logic, exit methodology, and how it stands apart from traditional moving average (MA) tools, without disclosing specifics that allow for code duplication.
How Signalgo V Works
1. Multi-Layered Technical Synthesis
Signalgo V processes several technical studies simultaneously:
Fast/Slow Moving Averages: Uses either EMA or SMA (user-selected) with adjustable periods. These are central to initial trend detection through crossovers.
MACD Filter: MACD line vs. signal line cross-check ensures trend direction is supported by both momentum and MA structure.
RSI Confirmation: The RSI is monitored to verify that signals are not excessively overbought or oversold, tuning the system to changing momentum regimes.
Bollinger Bands Context: Entry signals are only considered when price action is beyond the Bollinger Bands envelope, which further filters for unusually strong movements.
These strict, multi-indicator entry criteria are designed to ensure only the most robust signals are surfaced, each is contingent on the presence of aligned trend, momentum and volatility.
2. Exit Methodology
Take-Profit Levels: After entering a trade, the strategy automatically sets three predefined profit targets (TP1, TP2, TP3). If the price reaches any of these targets, the system marks it, helping you lock in profits at different stages.
Stop-Loss System: Simultaneously, a stop-loss (SL) value is set, protecting you from significant losses if the market moves against your position.
Dynamic Adjustment: When the first profit target (TP1) is hit, the system can automatically move the stop-loss to your entry price. This means your worst-case outcome is break-even from that point, reducing downside risk.
Trailing Stop-Loss: After TP1 is reached, a dynamic trailing stop can activate. This allows the stop-loss to follow the price as it moves in your favor, aiming to capture more profit if the trend continues, while still protecting your gains if the price reverses.
Visual Markers: The system plots all important exit levels (profit targets, stop-loss, trailing stop) directly on the chart. Optional labels also appear whenever a target or stop-loss is hit, making it easy to see progress.
Visual cues (labels) are plotted directly on the bar where a buy or sell signal triggers, clarifying entry points and aiding manual exit/risk management decisions.
Input Parameters
rsiLen: Lookback period for RSI calculation.
rsiOB and rsiOS: Overbought/oversold thresholds, adaptive to the indicator’s multi-layered logic.
maFastLen and maSlowLen: Periods for fast and slow MAs.
maType: EMA or SMA selectable for both MAs.
bbLen: Length for Bollinger Bands mean calculation.
bbMult: Standard deviation multiplier for BB width.
macdFast, macdSlow, macdSig: Standard MACD parameterization for nuanced momentum oversight.
What Separates Signalgo V from Traditional Moving Average Indicators
Composite Signal Architecture: Where traditional MA systems generate signals solely on MA crossovers, Signalgo V requires layered, cross-confirmational logic across trend (MAs), momentum (MACD), volatility (Bollinger Bands), and market strength (RSI).
Adaptive Volatility Context: MA signals only “count” when price is meaningfully breaking out of its volatility envelope, filtering out most unremarkable crosses that plague basic MA strategies.
Integrated Multi-Factor Filters: Strict compliance with all layers of signal logic is enforced. A marked improvement over MA strategies that lack secondary or tertiary confirmation.
Non-Redundant Event Limiting: Each entry is labeled as a unique event. The indicator does not repeat signals on subsequent bars unless all entry conditions are freshly met.
Trading Strategy Application
Trend Identification: By requiring concurrence among MA, MACD, RSI, and BB, this tool identifies only those trends with robust, multifactor support.
Breakout and Momentum Entry: Signals are bias-toward trades that initiate at likely breakout points (outside BB range), combined with fresh momentum and trend alignment.
Manual Discretion for Exits: The design is to empower traders with high-confidence entries and leave risk management or partial profit-taking adaptive to trader style, using visual cues from all component indicators.
Alert Generation: Each buy/sell event optionally triggers an alert, supporting systematic monitoring without constant chart watching.
Market State Momentum OscillatorMarket State Momentum Oscillator (MSMO)
Overview
The MSMO combines three elements in one panel:
Momentum oscillator (gray/blue area with aqua signal line)
Market State filter (green/red background area)
Money Flow Index (orange line)
Works on all markets and all timeframes. Non-repainting at bar close.
Colors and meaning
Gray area: Momentum above 0 (bullish bias)
Blue area: Momentum below 0 (bearish bias)
Aqua line: Signal line smoothing the oscillator
Green background: Market state bullish (price above moving average)
Red background: Market state bearish (price below moving average)
Orange line: Money Flow Index (volume-weighted momentum)
How to use
Always wait for confirmation of the green or red market state before acting.
Trend alignment: Watch the slope of the Weekly and Daily 200 MA and Weekly and Daily 50 MA to understand higher-timeframe trend direction. Trade only in alignment with the broader trend.
Entries:
Long: Green state + gray histogram rising + MFI trending up
Short: Red state + blue histogram falling + MFI trending down
Exits: Histogram crossing back through 0, or state background flips against the position.
Users can add chart alerts on plot crossings if needed.
Inputs
Lengths for oscillator pivot, signal smoothing, state moving average, trend weight, return %, and Money Flow Index. Defaults work for most charts.
Note
Educational use only. Not financial advice.
Tags
trend, oscillator, market state, momentum, money flow, crypto, forex, stocks, indices, futures

REMS Snap Shot OverlayThe REMS Snap Shot indicator is a multi-factor, confluence-based system that combines momentum (RSI, Stochastic RSI), trend (EMA, MACD), and optional filters (volume, MACD histogram, session time) to identify high-probability trade setups. Signals are only triggered when all enabled conditions align, giving the trader a filtered, visually clear entry signal.
This indicator uses an optional 'look-back' feature where in it will signal an entry based on the recency of specified cross events.
To use the indicator, select which technical indicators you wish to filter, the session you wish to apply (default is 9:30am - 4pm EST, based on your chart time settings), and if which cross events you wish to trigger a reset on the cooldown.
The default settings filter the 4 major technical indicators (RSI, EMAs, MACD, Stochastic RSI) but optional filters exist to further fine tune Stochastic Range, MACD momentum and strength, and volume, with optional visual cues for MACD position, Stochastic RSI position, and volume.
EMAs can be drawn on the chart from this indicator with optional shaded background.
This indicator is an alternative to REMS First Strike, which uses a recency filter instead of a cool down.
ORB FVG Strategy with telegram V6.1Summary
Intraday NY-session strategy with Opening-Range bias (09:30–10:00 NY), FVG entries (incl. optional HTF FVGs), momentum filters (LinReg slope & Williams %R), limit entries inside the zone, SL from FVG anchors, and TP via risk-reward. Includes session/trade caps, pending-order handling, auto-cancel at NY time, and optional Telegram webhook alerts.
Feature Overview
Opening Range & Bias: OR high/low built until 10:00 NY, then frozen. Bias from confirmed 5-minute candles (modes: Body Close, Complete Candle, Wick Only).
FVG Scanner: Bull/bear FVGs (choose wick or body gaps), min size, auto-extend, mitigation cleanup (touch or 50%).
HTF FVG (10 min): Optional – displayed after ≥ 2 consecutive FVGs; cleans up on touch/50%.
Entry/SL/TP: Entry at X% fill (+extra %) within the FVG; SL from FVG candle / FVG-1 / FVG-2 (smart) + buffer; TP via risk-reward.
Momentum Filters: LinReg slope (MLL) + Williams %R with threshold/slope filters (individually switchable).
Intrabar Mode (optional): Immediate Open/intrabar entry on touch (calc_on_every_tick=true) or classic bar-close confirmation (toggle).
Trade Management: Max trades/day, pending cap, auto-cancel at defined NY time, pause after first winner (optional).
Telegram: Programmatic alerts via alert() with Telegram-ready JSON payload.
Parameters (compact)
Group Parameter Purpose
Sessions Trading session, Opening range Trading/OR window (internal NY TZ)
Bias Body Close / Complete Candle / Wick Only Bias confirmation relative to OR
Liquidity LQ session, lookback days, cleanup points, show lines Intraday liquidity marks & cleanup
FVG Min size, wick/body, colors, extend, cleanup Detection/visualization & validity
HTF FVG (10 m) Toggle/Display/Colors Conservative HTF filter/POI
Entry Fill %, extra %, max pending, validity (bars), cancel time, intrabar switch Execution timing, order caps, auto-cancel
Stop Loss Source: Candle / -1 / -2 (smart), buffer (points) SL anchor from FVG history + safety offset
Take Profit Risk-Reward (R:R) Target calculation
Momentum LinReg length/min slope, W%R length/min slope, HUD Trend/momentum filters
Trade Mgmt Max trades/day, pause after win Daily cap / risk cooldown
Telegram Enabled, tester, interval, channel id Webhook output & test signals
Debug & Info Debug panel, rejection reasons On-chart status/diagnostics
Alerts / Telegram Webhook (Quick Setup)
Create an alert with Condition: “Any alert() function call”.
Webhook URL: api.telegram.org
Message: leave empty (the strategy provides JSON via alert() – includes chat_id, parse_mode, text).
Ensure your bot can post to the channel and the chat_id is valid.
Repainting & Backtesting
HTF series via lookahead_off on closed higher-TF candles; FVG detection on confirmed bars (barstate.isconfirmed).
Intrabar/Open entries allow earlier fills but typically cause differences between backtest and live (tick granularity/slippage, limit touch on bar OHLC).
For reproducibility, trade without intrabar (bar-close only).
Limitations
No full tick simulation; limit fills rely on bar OHLC.
Liquidity “cleanup” is rule-based (not an orderbook).
Telegram depends on correct webhook configuration.
Tips
Timeframes: M5 (intrabar)
Start with modest R:R (e.g., 1.5–2.0) and tune filters carefully.
Disclaimer
No financial advice. Past results do not guarantee future performance. Use responsibly and follow Public Library rules.
License / Credits
© 2025 Lean Trading (Lennart Pomreinke). License: MPL-2.0.
Changelog
V06.1: Intrabar switch (Open/intrabar vs bar-close), Telegram sanitizer & tester, HTF-FVG cleanup, refined pending/cancel logic, debug panel (status & rejections).

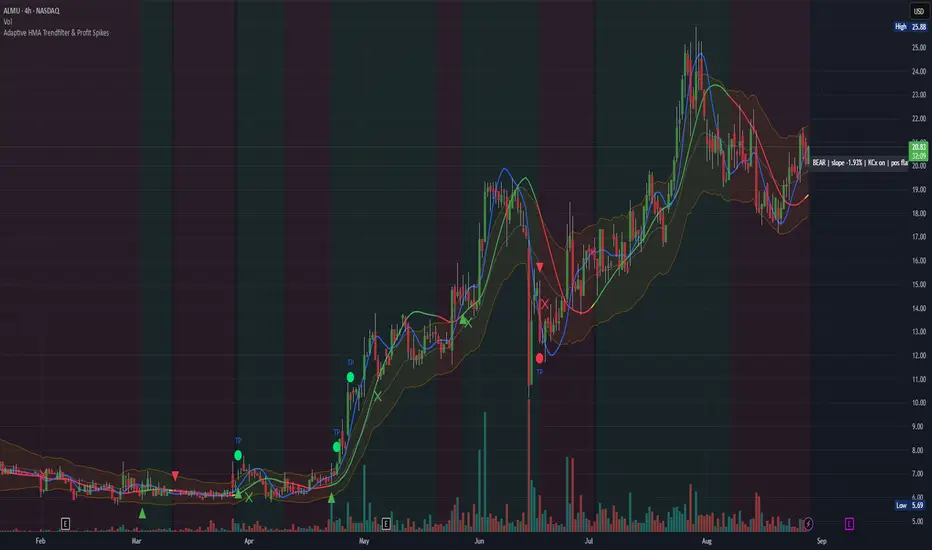
Adaptive HMA Trendfilter & Profit SpikesShort Description
Adaptive trend-following filter using Hull Moving Average (HMA) slope.
Includes optional Keltner Channel entries/exits and dynamic spike-based take-profit markers (ATR/Z-Score).
Optional Fast HMA for early entry visualization (not included in logic).
USER GUIDE:
1) Quick Overview
Trend Filter: Slow HMA defines Bull / Bear / Sideways (via slope & direction).
Entries / Exits:
Entry: Color change of the slow HMA (red→green = Long, green→red = Short), optionally filtered by the Keltner basis.
Exit: Preferably via Keltner Band (Long: Close under Upper Band; Short: Close above Lower Band).
Fallback: exit on opposite HMA color change.
Take-Profit Spikes: Marks abnormal moves (ATR, Z-Score, or both) as discretionary TP signals.
Fast HMA (optional): Purely visual for early entry opportunities; not part of the core trading logic (see §5).
2) Adding & Basic Setup
Add the indicator to your chart.
Open Settings (gear icon) and configure:
HMA: Slow HMA Length = 55, Slope Lookback = 10, Slope Threshold = 0.20%.
Keltner: KC Length = 20, Multiplier = 1.5.
Spike-TP: Mode = ATR+Z, ATR Length = 14, Z Length = 20, Cooldown = 5.
Optionally: enable Fast HMA (e.g., length = 20).
3) Input Parameters – Key Controls
Slow HMA Length: Higher = smoother, fewer but cleaner signals.
Slope Lookback: How far back HMA slope is compared against.
Slope Threshold (%): Minimum slope to avoid “Sideways” regime.
KC Length / Multiplier: Width and reactivity of Keltner Channels.
Exits via KC Bands: Toggle on/off (recommended: on).
Entries only above/below KC Basis: Helps filter out chop.
Spike Mode: Choose ATR, Z, or ATR+Z (stricter, fewer signals).
Spikes only when in position: TP markers show only when you’re in a trade.
4) Entry & Exit Logic
Entries
Long: Slow HMA turns from red → green, and (if filter enabled) Close > KC Basis.
Short: Slow HMA turns from green → red, and (if filter enabled) Close < KC Basis.
Exits
KC Exit (recommended):
Long → crossunder(close, Upper KC) closes trade.
Short → crossover(close, Lower KC).
Fallback Exit: If KC Exits are off → exit on opposite HMA color change.
Spike-TP (Discretionary)
Marks unusually large deviations from HMA.
Use for partial profits or tightening stops.
⚠️ Not auto-traded — only marker/alert.
5) Early Entry Opportunities (Fast HMA Cross – visual only)
The script can optionally display a Fast HMA (e.g., 20) alongside the Slow HMA (e.g., 55).
Bullish early hint: Fast HMA crosses above Slow HMA, or stays above, before the Slow HMA officially turns green.
Bearish early hint: opposite.
⚠️ These signals are not part of the built-in logic — they are purely discretionary:
Advantage: Earlier entries, more profit potential.
Risk: Higher chance of whipsaws.
Practical workflow (early long entry):
Fast HMA crosses above Slow HMA AND Close > KC Basis.
Enter small position with tight stop (under KC Basis or HMA swing).
Once Slow HMA confirms green → add to position or trail stop tighter.
6) Recommended Presets
Crypto (1h/2h):
HMA: 55 / 10 / 0.20–0.30%
KC: 20 / 1.5–1.8
Spikes: ATR+Z, ATR=14, Z=20, Cooldown 5
FX (1h/4h):
HMA: 55 / 8–10 / 0.10–0.25%
KC: 20 / 1.2–1.5
Indices (15m/1h):
HMA: 50–60 / 8–12 / 0.15–0.30%
KC: 20 / 1.3–1.6
Fine-tuning:
Too noisy? → Raise slope threshold or increase HMA length.
Too sluggish? → Lower slope threshold or shorten HMA length.
7) Alerts – Best Practice
Long/Short Entry – get notified when trend color switches & KC filter is valid.
Long/Short Exit – for KC exits or fallback exits.
Long/Short Spike TP – for discretionary profit-taking.
Set via TradingView: Create Alert → Select this indicator → choose condition.
8) Common Pitfalls & Tips
Too many false signals?
Raise slope threshold (more “Sideways” filtering).
Enable KC filter for entries.
Entries too late?
Use Fast HMA cross for early discretionary entries.
Or lower slope threshold slightly.
Spikes too rare/frequent?
More frequent → ATR mode or lower ATR multiplier / Z-threshold.
Rarer but stronger → ATR+Z with higher thresholds.
9) Example Playbook (Long Trade)
Regime: Slow HMA still red, Fast HMA crosses upward (early hint).
Filter: Close > KC Basis.
Early Entry: Small size, stop below KC Basis or recent swing low.
Confirmation: Slow HMA turns green → scale up or trail stop.
Management: Partial profits at Spike-TP marker; full exit at KC upper band break.
Consecutive Candle Body Expansion with VolumeConsecutive Candle Body Expansion with Volume
This tool is designed to help traders identify moments of strong directional momentum in the market. It highlights potential buy and sell opportunities by combining candlestick behavior with volume confirmation.
✨ Key Features
Detects when the market shows consistent momentum in one direction.
Filters signals with volume confirmation, avoiding low-activity noise.
Highlights possible continuation signals for both bullish and bearish moves.
Works on any asset and any timeframe — from scalping to swing trading.
🛠 How to Use
Green labels suggest potential buying opportunities.
Red labels suggest potential selling opportunities.
Best used in combination with your own risk management rules and other indicators (like support/resistance or moving averages).
⚠️ Note: This is not financial advice. Always backtest before applying in live trading.

Momentum Breakout StrategyBacktest a strategy where, when a candlestick on a timeframe rises more than a certain %, it enters a trade.

FluidFlow OscillatorFluidFlow Oscillator: Study Material for Traders
Overview
The FluidFlow Oscillator is a custom technical indicator designed to measure price momentum and market flow dynamics by simulating fluid motion concepts such as velocity, viscosity, and turbulence. It helps traders identify potential buy and sell signals along with trend strength, momentum direction, and volatility conditions.
This study explains the underlying calculation concepts, signal logic, visual cues, and how to interpret the professional dashboard table that summarizes key indicator readings.
________________________________________
How the FluidFlow Oscillator Works
Core Mechanisms
1. Price Flow Velocity
o Measures the rate of change of price over a specified flow length (default 40 bars).
o Calculated as a percentage change of closing price: roc=close−closelen_flowcloselen_flow×100\text{roc} = \frac{\text{close} - \text{close}_{len\_flow}}{\text{close}_{len\_flow}} \times 100roc=closelen_flowclose−closelen_flow×100
o Smoothed by an EMA (Exponential Moving Average) to reduce noise, generating a "flow velocity" value.
2. Viscosity Factor
o Analogous to fluid viscosity, it adjusts the flow velocity based on recent price volatility.
o Volatility is computed as the standard deviation of close prices over the flow length.
o The viscosity acts as a damping factor to slow down the flow velocity in highly volatile conditions.
o This results in a "flow with viscosity" value, that smooths out the velocity considering market turbulence.
3. Turbulence Burst
o Captures sudden changes or bursts in the flow by measuring changes between successive viscosity-adjusted flows.
o The turbulence value is a smoothed absolute change in flow.
o A burst boost factor is added to the oscillator to incorporate this rapid change component, amplifying signals during sudden shifts.
4. Oscillator Calculation
o The raw oscillator value is the sum of flow with viscosity plus burst boost, scaled by 10.
o Clamped between -100 and +100 to limit extremes.
o Finally, smoothed again by EMA for cleaner visualization.
________________________________________
Signal Logic
The oscillator works with complementary components to produce actionable signals:
• Signal Line: An EMA-smoothed version of the oscillator for generating crossover-based signals.
• Momentum: The rate of change of the oscillator itself, smoothed by EMA.
• Trend: Uses fast (21-period EMA) and slow (50-period EMA) moving averages of price to identify market trend direction (uptrend, downtrend, or sideways).
Signal Conditions
• Bullish Signal (Buy): Oscillator crosses above the oversold threshold with positive momentum.
• Bearish Signal (Sell): Oscillator crosses below the overbought threshold with negative momentum.
Statuses
The oscillator provides descriptive market states based on level and momentum:
• Overbought
• Oversold
• Buy Signal
• Sell Signal
• Bullish / Bearish (momentum-driven)
• Neutral (no clear trend)
________________________________________
Color System and Visualization
The oscillator uses a sophisticated HSV color model adapting hues according to:
• Oscillator value magnitude and sign (positive or negative)
• Acceleration of oscillator changes
• Smooth color gradients to facilitate intuitive understanding of trend strength and momentum shifts
Background colors highlight overbought (red tint) and oversold (green tint) zones with transparency.
________________________________________
How to Understand the Professional Dashboard Table
The FluidFlow Oscillator offers an integrated table at the bottom center of the chart. This dashboard summarizes critical indicator readings in 8 columns across 3 rows:
Column Description
SIGNAL Current signal status (e.g., Buy, Sell, Overbought) with color coding
OSCILLATOR Current oscillator value (-100 to +100) with color reflecting intensity and direction
MOMENTUM Momentum bias indicating strength/direction of oscillator changes (Strong Up, Up, Sideways, Down, Strong Down)
TREND Current trend status based on EMAs (Strong Uptrend, Uptrend, Sideways, Downtrend, Strong Downtrend)
VOLATILITY Volatility percentage relative to average, indicating market activity level
FLOW Flow velocity value describing price momentum magnitude and direction
TURBULENCE Turbulence level indicating sudden bursts or spikes in price movement
PROGRESS Oscillator's position mapped as a percentage (0% to 100%) showing proximity to extreme levels
Rows Explained
• Row 1 (Header): Labels for each metric.
• Row 2 (Values): Current numerical or descriptive values color-coded along a professional scheme:
o Green or lime tones indicate positive or bullish conditions.
o Red or orange tones indicate caution, sell signals, or bearish conditions.
o Blue tones indicate neutral or stable conditions.
• Row 3 (Status Indicators): Emoji-like icons and bars provide a quick visual gauge of each metric's intensity or signal strength:
o For example, "🟢🟢🟢" suggests very strong bullish momentum, while "🔴🔴🔴" suggests strong bearish momentum.
o Progress bar visually demonstrates oscillator movement toward oversold or overbought extremes.
________________________________________
Practical Interpretation Tips
• A Buy signal with green colors and strong momentum usually precedes upward price moves.
• An Overbought status with red background and red table colors warns of potential price corrections or reversals.
• Watch the Turbulence to gauge market instability; spikes may precede price shocks or volatility bursts.
• Confirm signals with the Trend and Momentum columns to avoid false entries.
• Use the Progress bar to anticipate oscillations approaching key threshold levels for timing trades.
________________________________________
Alerts
The oscillator supports alerts for:
• Buy and sell signals based on oscillator crossovers.
• Overbought and oversold levels reached.
These help traders automate awareness of important market conditions.
________________________________________
Disclaimer
The FluidFlow Oscillator and its signals are for educational and informational purposes only. They do not guarantee profits and should not be considered as financial advice. Always conduct your own research and use proper risk management when trading. Past performance is not indicative of future results.
________________________________________
This detailed explanation should help you understand the workings of the FluidFlow Oscillator, its components, signal logic, and how to analyze its professional dashboard for informed trading decisions.

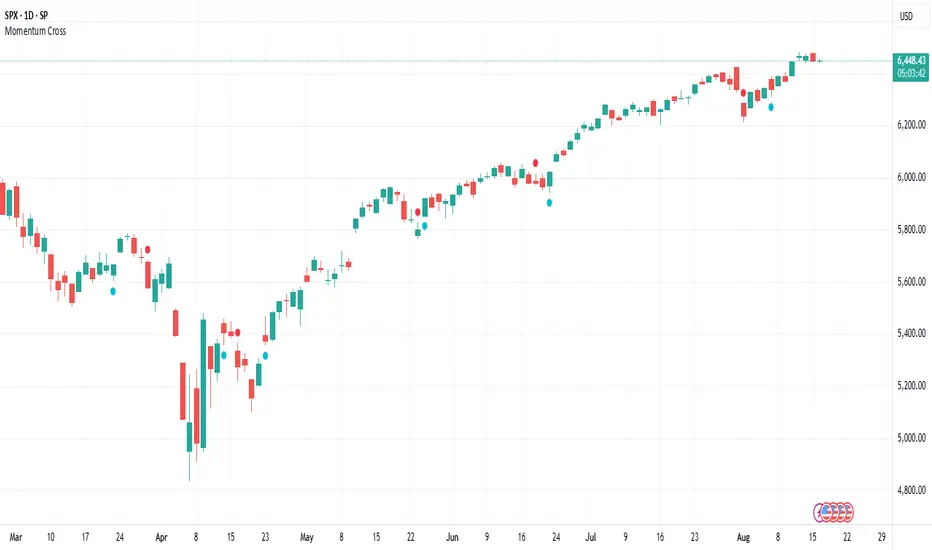
Momentum CrossThis indicator tracks momentum shifts using a 3-period EMA crossing above or below an 8-period EMA. It's simple, and quite effective as a momentum confirmation signal.
Signals:
Cyan circles below bars - Bullish momentum (3 EMA crosses above 8 EMA)
Red circles above bars - Bearish momentum (3 EMA crosses below 8 EMA)
Setups to Use:
V-Shaped Reversals: When price hits major support/resistance and shows rejection, the momentum cross confirms whether the reversal has legs or not. Helps separate real bounces from dead cat bounces.
One-Two Punch Pattern: My favorite high-probability setup: Initial cross shows momentum shifting, counter-move gets rejected quickly, second cross in original direction with follow-through.
Opening Range Breakout Confirmation: Use momentum crosses to confirm pullbacks or retests to key levels after opening range breakouts. The cross timing shows when the retest is holding and momentum is resuming in the breakout direction.
Fibonacci Support/Resistance: Momentum crosses at key Fibonacci levels (38.2%, 50%, 61.8%, 1.272%, and 1.618%) help confirm whether the level will hold or break. Particularly useful for timing entries at these widely-watched levels.
Settings:
Default 3/8 EMAs work well for most situations. Faster settings (2/5) for active markets, slower (5/13) for cleaner signals in strong trends.
Notes:
This works best when combined with key levels, volume, and market context. The cross timing is what matters - it shows when momentum is actually shifting, not just when price bounces.