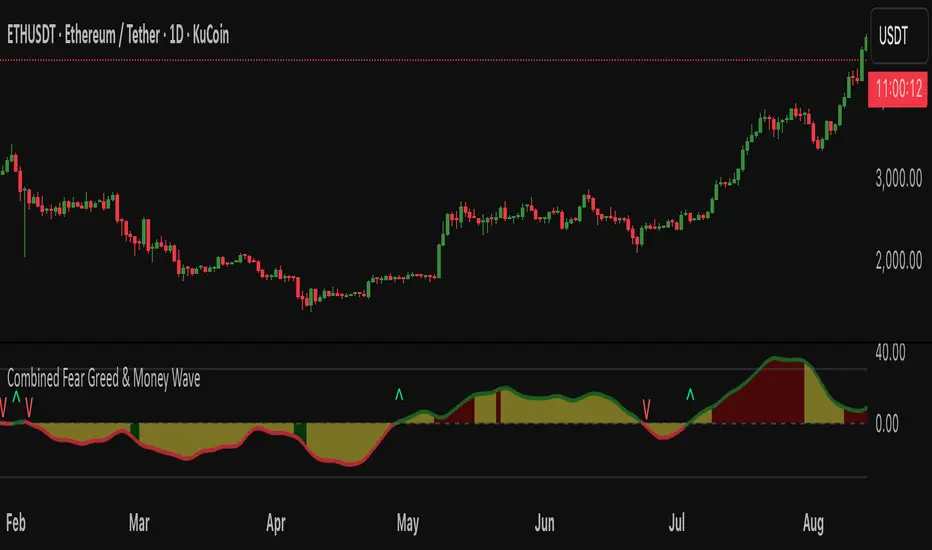
Fear Greed zones and Money Waves FusedThis indicator, named "Fear Greed zones and Money Waves" combines a smoothed Money Flow Index (MFI)-based wave and the Relative Strength Index (RSI) to visualize market sentiment through fear and greed zones and generate buy/sell signals.
Core Functions
- It calculates a zero-centered and smoothed version of the MFI (MoneyWave) using configurable smoothing methods (SMA, EMA, RMA) with parameters for length and smoothing intensity.
- It uses RSI to define fear and greed zones based on user-defined thresholds (e.g., RSI below 30 indicates fear, above 70 indicates greed).
- The MoneyWave area is color-coded based on these fear/greed RSI zones: dark green for fear, dark red for greed, and yellow neutral.
- The edge line of the MoneyWave shows bullish (lime) when above zero and bearish (red) when below zero.
Visual Elements
- Plots the MoneyWave as a colored area with an edge line.
- Displays horizontal lines representing the zero line and upper/lower bounds derived from MFI thresholds.
- Optionally shows direction change arrows when the MoneyWave sign changes and labels indicating BUY or SELL signals based on MoneyWave crossing zero combined with fear/greed conditions.
Trading Signals and Alerts
- Buy signal triggers when MoneyWave crosses upward through zero while in the fear zone (RSI low).
- Sell signal triggers when MoneyWave crosses downward through zero while in the greed zone (RSI high).
- Alerts can be generated for these buy/sell events.
In summary, this indicator provides a combined measure of money flow momentum (MoneyWave) with market sentiment zones (fear and greed from RSI), helping identify potential market entry and exit points with visual markers and alerts .
Moneyflows
Oath KeeperOath Keeper - Advanced Money Flow & Market Dynamics Indicator
A sophisticated indicator that analyzes market dynamics through money flow patterns, volume analysis, and liquidation detection to identify high-probability trading opportunities.
Core Features:
• Smart Money Flow Analysis: Proprietary calculation of institutional money movement
• Volume-Enhanced Signals: Multi-timeframe volume confirmation
• Liquidation Detection: Identifies potential forced liquidation events
• Advanced Signal Classification: Regular, Super, and Fakeout signals
Signal Types:
1. Regular Signals (Green/Purple Circles)
• Volume-confirmed momentum shifts
• Money flow threshold breaches
• Institutional participation confirmation
2. Super Signals (Green/Purple Squares)
• Deep oversold/overbought reversals
• High-volume rejection patterns
• Liquidation event confirmation
3. Fakeout Signals (Red X)
• Rapid sentiment shifts
• Trap detection
• False breakout warnings
Visual Components:
• Dynamic Money Flow Line (White/Purple)
• Order Flow Clouds (Green/Red with high transparency)
• Reference Levels (20, 50, 80)
• Multi-type Signal Markers
• Color-coded momentum visualization
Interpretation Guide:
• Green Cloud: Bullish money flow dominance
• Red Cloud: Bearish money flow dominance
• Circle Markers: Standard reversals
• Square Markers: High-conviction moves
• X Markers: Potential trap zones
Best Practices:
• Most effective on 1H+ timeframes
• Use with major trading pairs
• Wait for candle close confirmation
• Combine with support/resistance levels
• Monitor volume confirmation
• Use multiple timeframe analysis
This indicator helps traders identify institutional money flow, potential liquidation events, and market reversals by analyzing volume patterns and money flow dynamics, providing multiple confirmation layers for trade decisions.
Note: Performance varies with market conditions and timeframes. Always employ proper risk management.

PrimeMomentum 1.1The PrimeMomentum indicator is not just an adaptation of classic tools like MA, BB, RSI, or WaveTrend. It is an innovative tool that combines several key elements and offers a unique methodology for market analysis. Its primary goal is to help traders avoid false entries and provide signals for making trading decisions.
What Makes PrimeMomentum Unique?
Integration of Multi-Timeframe Data with a Unique Signal Filtering Approach
PrimeMomentum processes data from four timeframes simultaneously, not merely to display trends but to assess the synchronization of momentum across each timeframe. This allows traders to receive signals only when all intervals confirm the direction. This approach minimizes the risk of false signals often encountered with standard tools.
PrimeMomentum analyzes the market across four timeframes:
TF1 (long-term): Displays the overall market direction.
TF2 (medium-term): Refines the current dynamics.
TF3 (short-term): Provides detailed analysis.
TF4 (very short-term): Confirms entry or exit points.
The combination of data from these timeframes allows traders to avoid frequent switching between intervals, simplifying analysis.
Innovative Reversal Logic
PrimeMomentum features a specialized algorithm for identifying trend reversals. Its uniqueness lies in the interaction between dynamic smoothing (EMA) and multi-level momentum assessment, enabling accurate identification of potential trend reversal points.
Dynamic Adaptation to Market Conditions
The indicator automatically adjusts smoothing parameters and threshold values based on market volatility. This enables it to adapt effectively to both calm and volatile markets.
Signals for entering Long or Short positions are generated only when the following conditions are met:
- Momentum shifts from negative to positive (for Long) or from positive to negative (for Short).
- Dynamic smoothing confirms the trend.
- Defined thresholds are reached.
Trend Strength Assessment
Unlike traditional indicators, PrimeMomentum evaluates not only the direction but also the strength of a trend by analyzing the relationship between momentum across each timeframe. This helps traders understand how stable the current market movement is.
The indicator analyzes price changes over a specific period, determining how much current prices deviate from previous ones. This data allows for assessing the strength of market movements.
Combination of Classic Elements with Proprietary Logic
While PrimeMomentum may utilize some widely known components like EMA, its algorithm is built on proprietary logic for evaluating market conditions. This sets it apart from standard solutions that merely display basic indicators without deeper analysis.
Added Value of PrimeMomentum
Trend Visualization with Concept Explanations
PrimeMomentum provides traders with clear visual signals, simplifying market analysis. Each element (color, line direction) is based on momentum and trend-smoothing concepts, enabling traders to make decisions quickly.
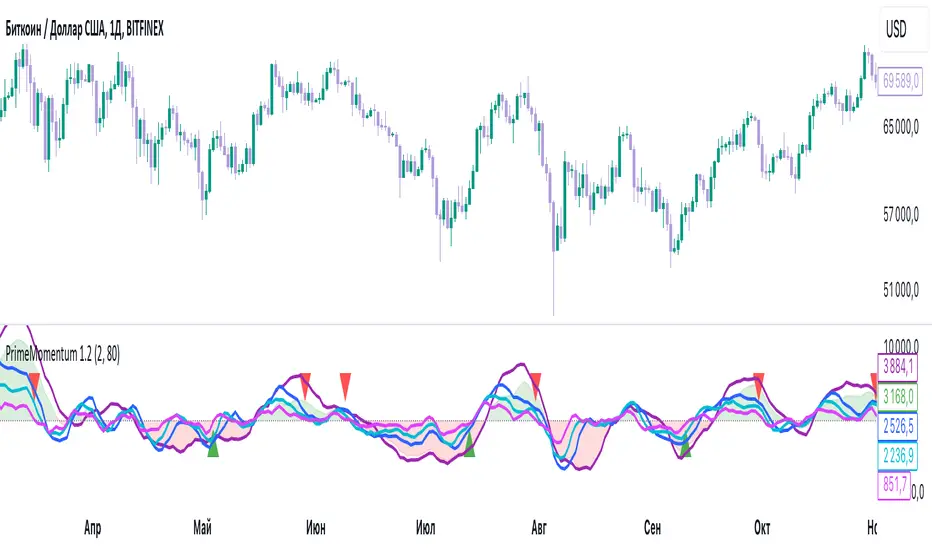
Results are displayed as color-coded lines:
- Dark violet: Long-term trend.
- Blue: Medium-term trend.
- Turquoise and light blue: Short-term trends.
If all momentum lines reach a peak and begin turning downward, it may indicate an approaching bearish trend.
If all lines reach a bottom and start turning upward, it may signal the beginning of a bullish trend.
Reversals can also serve as signals for exiting positions.
MoneyFlow
The PrimeMomentum indicator includes a visualization of MoneyFlow, allowing traders to assess capital flows within the selected timeframe. This functionality helps to analyze market trends more accurately and make well-informed decisions.
MoneyFlow Features:
Dynamic MoneyFlow Visualization:
MoneyFlow is displayed as an area that changes color based on its value:
- Green (with transparency) when MoneyFlow is above zero (positive flow).
- Red (with transparency) when MoneyFlow is below zero (negative flow).
Automatic Scaling:
MoneyFlow values automatically adjust to the chart’s scale to ensure visibility alongside the Momentum lines.
Double Smoothing:
To ensure a smoother and more representation, MoneyFlow uses double smoothing based on EMA.
Customizable Colors and Transparency:
Traders can customize the colors for positive and negative MoneyFlow and adjust the transparency level to fit their preferences.
How MoneyFlow Works:
- MoneyFlow calculations are based on the MFI (Money Flow Index), which considers both price and volume.
- MoneyFlow values are integrated into the overall PrimeMomentum chart and combined with other signals for deeper analysis.
Advantages of the New Functionality:
- Helps quickly identify capital flows into or out of the market.
- Complements Momentum analysis to provide a more comprehensive view of market conditions.
- Enhances decision-making efficiency through flexible visualization settings.
Note: MoneyFlow adapts to the selected timeframe and displays data corresponding to the current interval on the price chart.
Simplicity for Beginners and Depth for Professionals
The indicator is designed to be user-friendly for traders of all experience levels. Beginners benefit from intuitive signals, while experienced traders can leverage in-depth analysis for more complex strategies.
PrimeMomentum Usage Modes
PrimeMomentum adapts to various strategies and supports three modes:
Short-term: Recommended to use a 2H timeframe. Optimal for intraday trading with small TakeProfit levels.
Medium-term: Recommended to use a 1D timeframe for trades lasting several days.
Long-term: Use the 1W timeframe for analyzing global trends.
Support for Different Strategies
Thanks to its flexible settings and support for multiple timeframes, PrimeMomentum is suitable for both day trading and long-term analysis.
Why Is PrimeMomentum Worth Your Attention?
Unlike standard indicators, which often rely solely on basic mathematical models or publicly available components, PrimeMomentum offers a comprehensive approach to market analysis. It combines unique momentum assessment algorithms, multi-timeframe analysis, and volatility adaptation. This not only provides traders with signals but also helps them understand the underlying market processes, making it a truly innovative solution.
Disclaimer
The PrimeMomentum indicator is designed to assist traders in market analysis but does not guarantee future profitability. Its use should be combined with traders' own research and informed decision-making.
FloWave Oscillator [StabTrading]The FloWave Oscillator is a powerful trading tool designed to identify market trends and reversals by analysing reversal zones based on momentum and fear algorithms.
Serving as the first stage in a comprehensive trading system, it is intentionally straightforward, allowing traders to clearly see potential entry points across all charts and timeframes.
By inputting their own market sentiment, traders can customize the algorithm to align with their trading style. This flexibility helps traders navigate complex market environments with greater precision, whether they are seeking to capitalize on short-term opportunities or ride longer-term trends.
💡 Features
Reversal Zones - The FloWave Oscillator identifies key reversal zones driven by momentum and fear dynamics. Lighter green zones signal the initial stages of a potential reversal, while darker green zones indicate that a trend flip is imminent.
Trading Style Customization - The indicator allows traders to adjust their trading style with sensitivity settings ranging from Very Aggressive to Very Conservative. This flexibility lets traders tailor the indicator to their preferred time horizon—whether they seek to scalp short-term opportunities or capture long-term reversals.
🔥 Sensitivity Settings
Very Aggressive/Aggressive - These settings increase the indicator's sensitivity, generating more frequent signals, ideal for traders focused on short-term gains or those navigating choppy markets.
Neutral - Offers a balanced approach, combining both aggressive and conservative elements. It's a starting point for traders to evaluate performance before adjusting to more specific styles.
Conservative/Very Conservative - These settings reduce signal frequency, focusing on stronger, more reliable reversals. Best suited for long-term traders aiming to minimize risk and avoid premature market entries or exits.
🛠️ Usage/Practice
In the above example we’ll analysis how the indicator accurately predicts both the tops and bottoms of a market cycle.
Top of the Bull Market - The trendline initially shows two light red reversal zones, signalling a potential weakening in the upward momentum. As the trend progresses, a dark red zone emerges, confirming that a more substantial trend reversal to the downside is likely. This sequence provides an early warning, allowing traders to prepare for a possible market shift.
First Bull Signal - In the following phase, the indicator mirrors the previous action but in the opposite direction, identifying a reversal towards the upside. This behaviour demonstrates the indicator's ability to adapt to changing market conditions.
Bottom of the Bear Market - As the market continues its downward trajectory, the indicator presents two dark green reversal zones, highlighting areas where the selling pressure may be easing. These dark green zones offer three distinct opportunities to dollar-cost average (DCA) into the asset, allowing traders to build or enhance their positions during the end of the bear cycle. The indicator’s sensitivity in this phase ensures that traders can navigate the bearish market with confidence.
Continuation of Bull Cycle - In this segment, the indicator does not display any dark green reversal zones, implying that the uptrend remains robust. The absence of these zones suggests that the upward momentum is likely to continue, providing traders with another opportunity to add to their long positions. This scenario underscores the indicator’s capacity to identify when a trend is strong enough to warrant additional investment.
Potential Correction in an Uptrend - A light red zone appears, signalling a possible correction within the ongoing uptrend. However, the absence of a dark red zone indicates that the correction may be minor and that the overall trend is still upward. Traders might view this as a conservative point to take some profits off the table, managing risk while staying aligned with the broader bull market.
Bearish Signal - Eventually, a dark red reversal zone emerges, indicating that the trend has lost its upward momentum. This signal serves as a strong indicator that the uptrend may be concluding, prompting traders to consider exiting their positions or taking a more defensive stance. As the market enters a sideways phase, the trader can switch to a more aggressive trading style, seeking opportunities to scalp within the range while navigating the flat market conditions.
In this example, we demonstrate how to identify scalp trading opportunities by combining the Very Conservative and Very Aggressive settings. The key strategy is to use the Very Conservative trend to confirm the validity of reversal zones identified by the Very Aggressive setting.
The VC trend doesn’t indicate a buy reversal zone, but it shows an upward divergence. This suggests that the reversal buy zone on the VA chart is a potential entry point due to the supportive VC trend.
Multiple sell zones appear on the VA chart, but the VC trend shows a strong and steady uptrend. This suggests that we should wait for confirmation from the VC trend before considering a sell position, as the market is still moving upward strongly.
The VA chart shows several buy zones, but the VC trend indicates a strong downtrend, and no buy zone appears on the conservative setting. This suggests waiting for the next VA buy zone, confirmed by an upward divergence on the VC trend, before entering a trade.
Similar to Point 3 but in the opposite direction, the VA chart shows sell zones, but the VC trend indicates caution. The strategy would be to wait for confirmation from the VC trend before making a move.
🔶Conclusion
When used in conjunction with other indicators like the MeanRevert Matrix, the FloWave Oscillator becomes an integral part of a comprehensive trading system. It helps traders make informed decisions by providing clear signals that are aligned with the current market sentiment and broader economic trends. By following the implementation guidelines and adjusting the indicator settings as market conditions change, traders can effectively enhance their trading performance.

Degen Dominator - (Crypto Dominance Tool) - [mutantdog]A fairly simple one this time. Another crypto dominance tool, consider it a sequel to Dominion if you will. Ready to go out-of-the-box with a selection of presets at hand.
The premise is straightforward, rather than viewing the various marketcap dominance indexes as their standard percentage values, here we have them represented as basic oscillators. This allows for multiple indexes to be viewed in one pane and gives a decent overview of their relative changes and thus the flow of capital within the overall crypto market. As a general rule-of-thumb, when a plot is above zero then the dominance is climbing, thus capital is likely flowing in that direction. The inverse applies when below zero. When the market is quiet, all will be close to zero. Basic overbought/oversold conditions can also be inferred too.
Active as default are:
Bitcoin (0range): CRYPTOCAP:BTC.D
Ethereum (Blue): CRYPTOCAP:ETH.D
Stablecoins (Red): CRYPTOCAP:USDT.D + CRYPTOCAP:USDC.D
Altcoins (Green): 100 - (all of the above)
These are plotted according to the selected oscillator preset and it's length parameter. The default is set to 'EMA Centre'. An optional RMA(3) smoothing filter is also included and active as default. Each index plot has its own colour and opacity settings available on the main page.
Additionally, the following are also available (deactivated as default):
Total DeFi : CRYPTOCAP:TOTALDEFI.D
Current Symbol : Will try to match corresponding dominance index for the chart symbol if available.
Custom Input : Manual text input, will try to match if available.
-------------
The included presets determine the oscillator type used, all are fairly simple and easy to interpret:
EMA Centre
SMA Centre
Median Centre
Midrange Centre
The first 4 are all variations on the same theme, simply calculated as the difference between the actual value and its respective average. EMA is the default and is my personal preference, if you generally favour using an SMA then perhaps that would be your better choice. Like the two MAs, median and midrange are also dependant on the length parameter. Midrange is calculated from the difference between highest and lowest values within the length period, with a little extra smoothing from an RMA(3).
Simple Delta
Weighted Delta
Running Delta
Often referred to as momentum, delta is just change over time. 'Simple' is the most basic of these, the difference between the current value and the value (length) bars prior. A more long-winded way of calculating this would be to take the difference between each bar and its previous then average them with an SMA which results in the same value. 'Weighted' adopts that principle but instead uses a WMA, likewise 'Running' is the same but using an RMA. The latter is actually the basis of RSI calculations before any normalisation is applied, as you can see in the next preset.
RSI
CMO
RSI really should not need explaining, it is however applied a little differently here to the usual, in this case centred around 0. The x100 multiplication factor has been dropped too for the sake of consistency. The same principle applies with CMO, which is basically a 'Simple Delta' version of RSI.
Hard Floor
Soft Floor
These last two are a little different but both can provide useful interpretations. The floor here is simply the lowest value within the chosen length period. 'Hard' plots the difference between the current value and the floor, thus giving a value that is always above 0. In this case, focus should be given to the relative heights of each with a simple interpretation that capital is flowing into those that are climbing and out of those descending. 'Soft' is essentially the same except that the floor is smoothed with an RMA(3), the result being that when new lows are made, the plot will break below 0 before the floor corrects a few bars later. This soft break provides additional information to that given by 'Hard' so is probably the more useful of the two.
------------
To finish it off, a bunch of preset alerts are included for the various 0 crossings.
So that just about covers everything then, all quite straightforward really. Future updates may include some extra stuff, the composition of the stablecoin index may change if necessary too. While this is not really a tweaker's tool like some of my other projects, there's still some room for experimentation here. The 'current' and 'custom' indexes can provide some useful data for compatible altcoins and the possibility to compare inter-related tokens (eg: Doge vs Shib). While i introduced this as a sort of sequel to Dominion, it is not intended as a replacement but more of a companion. This initially started as a feature intended for that one but it quickly grew into its own thing. Both the oscillator view here and the more traditional view have merits, i personally use this one primarily now but frequently refer to Dominion for confirmations etc.
That's it for now anyway. As always, feedback is welcome below. Enjoy!

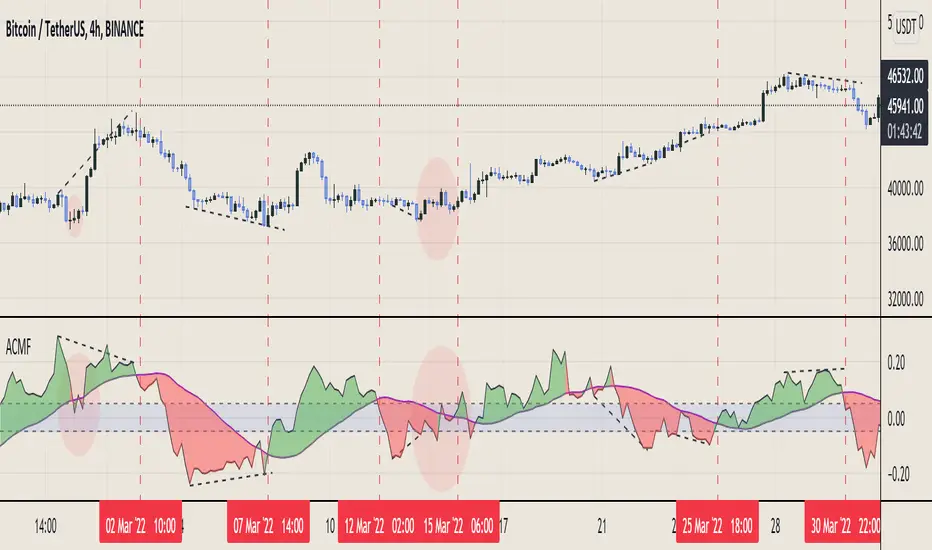
Aggregated Chaikin Money Flow - InFinitoModified Version of In-Built Chaikin Money Flow Indicator. Aggregated Volume is used for it's calculation + a couple of other features.
Aggregation code originally from Crypt0rus
***The indicator can be used for any coin/symbol to aggregate volume , but it has to be set up manually***
***The indicator can be used with specific symbol data only by disabling the aggregation option, which allows for it to be used on any symbol***
- Calculated based on Aggregated Volume instead of by symbol volume. Using aggregated data makes it more accurate and allows to compare volume flow between different kinds of markets (Spot, Futures , Perpetuals, Futures+Perpetuals and All Volume ).
- As well, in order to make the data as accurate as possible, the data from each exchange aggregated is normalized to report always in terms of 1 BTC. In case this indicator is used for another symbol, the calculations can be adjusted manually to make it always report data in terms of 1 contract/coin.
- Added Moving Average ( SMA , EMA , WMA , RMA, VWMA) that can be plotted to the CMF
- Changed 0 line to a small range which tends to be more relevant than the 0 line. This range can be manually modified
Things to look for:
- Divergences: Can be a very good reversal signal
- MA crossovers: Can be a very good confluent Buy/Sell signal
- Center range retests: CMF is normally defined as bullish above 0 and bearish below 0. In this case it is above or below the middle range. Even if the start of the move was missed. The retest of the middle range can give very good entries.
- Confluence of the latter
Money Flow Index With Bullish & Bearish SignalsMONEY FLOW INDEX WITH BULLISH AND BEARISH SIGNALS
Money Flow Index shows whether money is coming into the market or going out of the market. This can be used to gauge market sentiment and whether people are buying or selling at the current price.
***HOW TO USE***
If the MFI line is green, it is above the 50 line and in a bullish trend.
If the MFI line is red, it is below the 50 line and in a bearish trend.
If the background color is green, Money Flow is in a bullish trend, holding above the 50 line.
If the background color is red, Money Flow is in a bearish trend, holding below the 50 line.
If the MFI is above the 75 level it indicates a possible top or overbought conditions.
If the MFI is below the 25 level it indicates a possible bottom or oversold conditions.
***BULLISH/BEARISH LABELS***
There is also a label on the right side that tells you whether the overall trend is bullish or bearish, if there is a possible bottom or top and if the current money flow index is going up or down. This table updates in real time and changes colors so you can get an easy, quick interpretation of the current money flow without having to look at the data so you can make faster decisions on whether to enter or exit a trade. The flashing from red to green or the opposite also grabs your attention so you know immediately if there is a change in trend. The table changes colors in sync with the MFI line and it's trends and bottom/top areas. Green means money is coming in. Red means money is going out. Blue means a neutral amount of money flow.
***MARKETS***
This indicator can be used as a signal on all markets, including stocks, crypto, futures and forex.
***TIMEFRAMES***
This Money Flow Index indicator can be used on all timeframes.
***TIPS***
Try using numerous indicators of ours on your chart so you can instantly see the bullish or bearish trend of multiple indicators in real time without having to analyze the data. Some of our favorites are our Auto Fibonacci, DMI, Momentum, Auto Support And Resistance and Volume Profile in combination with this Money Flow Index. They all have real time Bullish and Bearish labels as well so you can immediately understand each indicator's trend.

ArtY Money Flow IndexThis is modification of built-in Money Flow Index with painting of oversold and overbought areas.

Chaikin Money FlowThis script plots the original Chaikin Money Flow in addition of highlighting positive/negative pressure areas.
