Financial Astrology Moon-Mars Longitude AngleMoon-Mars indicator show the angular distance in longitude between Moon and Mars and labels the angles that represent the astrological aspects used by financial astrologers to determine the energy trigger points. In financial astrology, Mars rules impulsive/risky actions and Moon is the strengthen/weakening emotion that trigger the desire to enter a trade without thinking too much in the risks or inclusive looking the risk adrenaline.
For any Moon aspects indicator we recommend to use 1H or 2H resolution to locate the exact aspect angle, this is because Moon moves very fast at average of 13 degrees per day.
Due to the limited UTF (Unicode Transformation Format) support of classical astrology aspects symbols, we needed to use a custom subset to represent the aspects:
⊚ = 0 degrees angle (conjuction)
⧌ = 30 degrees angle (semi-sextile)
⧆ = 45 degrees angle (semi-square)
⨺ = 60 degrees angle (sextile)
⧄ = 90 degrees angle (square)
⨹ = 120 degrees angle (trine)
⧇ = 135 degrees angle (sesqui-square)
◭ = 150 degrees angle (quincunx or inconjunct)
⚇ = 180 degrees angle (opposition)
Note: The Moon-Mars longitude angle indicator is based on an ephemeris array that covers years 2010 to 2030, prior or after this years the data is not available, this daily ephemeris are based on UTC time so in order to align properly with the price bars times you should set UTC as your chart timezone.
Moon
Financial Astrology Moon-Venus Longitude AngleMoon-Venus indicator show the angular distance in longitude between Moon and Venus and labels the angles that represent the astrological aspects used by financial astrologers to determine the energy trigger points. In financial astrology Venus rules speculation, bets and entertainment (gamblers traders) and Moon is the strengthen/weakening emotion that trigger the desire to bet and gamble.
For any Moon aspects indicator we recommend to use 1H or 2H resolution to locate the exact aspect angle, this is because Moon moves very fast at average of 13 degrees per day.
Due to the limited UTF (Unicode Transformation Format) support of classical astrology aspects symbols, we needed to use a custom subset to represent the aspects:
⊚ = 0 degrees angle (conjuction)
⧌ = 30 degrees angle (semi-sextile)
⧆ = 45 degrees angle (semi-square)
⨺ = 60 degrees angle (sextile)
⧄ = 90 degrees angle (square)
⨹ = 120 degrees angle (trine)
⧇ = 135 degrees angle (sesqui-square)
◭ = 150 degrees angle (quincunx or inconjunct)
⚇ = 180 degrees angle (opposition)
Note: The Moon-Venus longitude angle indicator is based on an ephemeris array that covers years 2010 to 2030, prior or after this years the data is not available, this daily ephemeris are based on UTC time so in order to align properly with the price bars times you should set UTC as your chart timezone.
Financial Astrology Moon-Mercury Longitude AngleMoon-Mercury longitude indicator show the angular distance in longitude between Sun and Mercury and labels the angles that represent the astrological aspects used by financial astrologers to determine the energy trigger points. In financial astrology Mercury rules the orders and commerce (trading transactions) and the Moon rules the emotions. Therefore, the Moon/Mercury aspects are essential to determine the volume turning points.
Consider that due to UTF (Unicode Transformation Format) charset limited support of the classical astrology aspects symbols, we needed to use a custom selection of UTF characters to represent the astrological aspects angles. This are different than the ones used by astrology, however, this was the only solution we found to symbolize the aspects.
For any Moon aspects indicator we recommend to use 1H or 2H resolution to locate the exact aspect angle, this is because Moon moves very fast at average of 13 degrees per day.
The symbols we used to represent the astrological aspects are:
⊚ = 0 degrees angle (conjuction)
⧌ = 30 degrees angle (semi-sextile)
⧆ = 45 degrees angle (semi-square)
⨺ = 60 degrees angle (sextile)
⧄ = 90 degrees angle (square)
⨹ = 120 degrees angle (trine)
⧇ = 135 degrees angle (sesqui-square)
◭ = 150 degrees angle (quincunx or inconjunct)
⚇ = 180 degrees angle (opposition)
Note: The Moon-Mercury longitude angle indicator is based on an ephemeris array that covers years 2010 to 2030, prior or after this years the data is not available, this daily ephemeris are based on UTC time so in order to align properly with the price bars times you should set UTC as your chart timezone.
Financial Astrology Moon-Sun Longitude AngleMoon-Sun longitude indicator show the angular distance in longitude between Sun and Moon and mark the angles that represent the astrological aspects used by financial astrologers to determine the energy trigger points.
Consider that due to UTF (Unicode Transformation Format) charset limited support of the classical astrology aspects symbols, we needed to use a custom selection of UTF characters to represent the astrological aspects angles. This are different than the ones used by astrology, however, this was the only solution we found to symbolize the aspects. Hopefully, once you are familiarized with this symbols, will be quite simple to identify the aspect type. Additionally, if you hover your mouse over the aspect symbol you are able to see a tooltip of with the aspect name.
Please note that for any Moon aspects indicator we recommend to use 1H, 2H resolution to locate the exact aspect angle, this is because Moon moves very fast at average of 13 degrees per day.
The symbols we used to represent the astrological aspects are:
⊚ = 0 degrees angle (conjuction)
⧌ = 30 degrees angle (semi-sextile)
⧆ = 45 degrees angle (semi-square)
⨺ = 60 degrees angle (sextile)
⧄ = 90 degrees angle (square)
⨹ = 120 degrees angle (trine)
⧇ = 135 degrees angle (sesqui-square)
◭ = 150 degrees angle (quincunx or inconjunct)
⚇ = 180 degrees angle (opposition)
We are happy to demonstrate to all the traders that believe that Moon phase is enough to determine the pivot points that this assumption is incorrect. Astrology works but not with Moon alone as you can verify combining all the indicators that the Financial Astrology Research group have contributed in TradingView platform.
Note: The Moon-Sun longitude angle indicator is based on an ephemeris array that covers years 2010 to 2030, prior or after this years the data is not available, this daily ephemeris are based on UTC time so in order to align properly with the price bars times you should set UTC as your chart timezone.
The Moon█ OVERVIEW
The Moon is a script that is designed to help Traders analyse their charts using the moon. This script consists of three main features :
1. Moon Phases Pro : This is a more powerful version of the default built-in Moon Phases where it would plot both past cycles and Future cycles with a better accuracy.
2. Moon Lines : This plots the moon's longitude into price. you can also select your desired $/degree ( price vs time unit) to make these lines better suited for your chart and the asset your playing with. We also didn't forget to add an option to enable harmonics of these lines. In addition, you can select "reverse" to get the downtrending plants as well.
3. Moon Angles : This allows you to highlight areas where the moon is at X degree. you can get the Moon at zero aris or 180 degrees or any other degree!.
We also added some styling options to help with the visuals.
█ Future Plans and upgrades to this script may include :
1. Enhanced algorithm for a faster loading/processing script.
2. More future dates plotting.
And more! Feel free to contact me with any feature that you would like to see in this script
█ How to use :
1. Open the settings.
2. Enable your desired tool and adjust the settings.
Give the script a few seconds and you should be set. Don't enable more than 2 tools at the same time, but if you want to do that, you can insert the same script twice or more in your chart.
This script is coded as an addon to the Gann ToolBox package/scripts.
[astropark] Moon Phases [alarms]Dear Followers,
today I'm glad to present you an indicator which calculates Moon Phases and let's you set an alert over it.
This is a public free indicator based on the public one by @paaax:
I added my usual alert system logic, plus some more customization inputs for easy coloring.
The lower the timeframe you use it and set your alerts on, the more precise the alert value you get.
Here below the script for backtesting it:
Enjoy!
-- astropark
Financial Astrology Moon SpeedThe acceleration of the Moon seems to be important in determining the periods of increasing volatility, when the speed is accelerating we can note that the price range of the candles during the acceleration period is greater than the candles during the deceleration period. In other words, the speed increase produce stronger effect in the price action and is expected that Moon aspects during speed acceleration are more intense than the ones formed during deceleration.
In order to evaluate this astro trading pattern, observe when Moon touch the speed minima around 11.5 degrees per day, at that point the speed curve start to increase until it reach the maxima around 15 degrees per day, within this period the candles price range seems to be more intense.
Note: The Moon speed indicator is based on an ephemeris array that covers years 2010 to 2030, prior or after this years the speed is not available, this daily ephemeris are based on UTC time so in order to align properly with the price bars times you should set UTC as your chart timezone.
Financial Astrology Moon DeclinationIt's said by financial astrologers that Moon in extreme declinations above or below 22, tends to produce more extreme effects of the Moon energy effects. My friend Peter advised that extreme declinations are very intense energy points and when the extreme is reached a reversal effect is expected. We are not quite sure if this rule is valid so this indicator is to validate the this empirical observations.
Note: The Moon declination indicator is based on an ephemeris array that covers years 2010 to 2030, prior or after this years the declination is not available, this daily ephemeris are based on UTC time so in order to align properly with the price bars times you should set UTC as your chart reference timezone.
Financial Astrology Moon LongitudeMoon energy represent the masses, crowds, public places, children and emotions. The transit of the Moon through the zodiacal signs will color the crowd emotional responses that fluctuate based on the elemental qualities of the signs: fire (energetic and impulsive), earth (rigid, static, patient), water (assimilation, transformation, humor fluctuations), air (expansion, fervent, germination).
The daily average speed of the Moon is 13 degrees, for this reason the emotional elemental energy is transforming in average every 2 days and few hours, this mood fluctuations produces the short term instinctive and emotional actions performed by traders that forget the precise mathematical / statistical approach in favor of irrational and emotional impulses.
Based on statistical buy/sell frequency analysis we discovered that for BTC-USD, the Moon is usually bullish in zodiac signs: Aries, Libra, Scorpio, Aquarius and Pisces, the most relevant bullish sign is "Aquarius", from 206 observations in all the BTC-USD price history where Moon was in this sign the 60% of those days the price increased compared to the previous day. The bearish zodiac signs for BTC-USD are: Taurus, Cancer, Leo, Sagittarius and Capricorn, the most relevant bearish sign is "Capricorn".
Interestingly this zodiac sign locations tends to fluctuate during some periods of time and from the last 10 observations of the Moon transiting through Aries we noted that 7 of the 10 observations coincide with a dip, sometimes the Moon in Aries indicate the reversal of the short term trend, this is kind of expected considering that when Moon approaches Taurus the fall becomes more likely due to the fact that Moon in Taurus is a bearish signal.
With this indicator there is unlimited possibilities to explore across different markets and complementing with Moon phases this may be the perfect financial astrology indicator for those intraday traders that keep positions only for few hours.
We encourage you to analyze the Moon zodiac sign cycles in different markets and share with us your observations, leave us a comment with your research outcomes. Happy trading!
Note: The Moon longitude indicator is based on an ephemeris array that covers years 2010 to 2030, prior or after this years the longitude is not available, this daily ephemeris are based on UTC time so in order to align properly with the price bars times you should set UTC as your chart reference timezone.
Moon at ZeroMoon at Zero
// ========================================================================//
This script is better utilized on LTF ( Low Time Frames ) Up to the 1min chart.
This script helps you spot important events in the market using the moon at zero degree.
This script includes dates for the year 2020, 2021, and 2022.
This script also complements the Gann ToolBox that I have on my tradingview page giving you good measurement of the market and some of its volatility dates and locations in price.
// ========================================================================//
To get access to this add-on or for the full package including the toolbox you can see my information below.
Moon Bot Study w/ AlertsThis is an experimental strategy that trades based on the Moon Cycles
Works best on 4hr, tested mostly on BTC but maybe you can find other assets that also return profitably
Important: With much power comes much responsibility, use it wisely
*Study version of Moonbot Strategy with built-in alerts
Strategy Version:
Moon Phase This Script is calculating the Moon Phase IE full moon and new moon. In the past most of the time during these times the price action does a nice size move either up or down depending on the current trend that we are in. the New Moon and Full Moon are indicated by color and a moon printed on the chart.
[PX] Moon PhaseHello guys,
while scrolling through the public library, I was surprised that there was no Open-Source version of the Moon Phase indicator. All moon phase indicators in the public library were either protected or not exactly what I was looking for. There is a built-in "Moon Phase" indicator, but even for this one, we can't access its source code.
Therefore, I started searching for an algorithm that I could implement into PineScript.
So here we go, an Open-Source Moon Phase indicator. It comes with the option to color the background based on the recent moon. Compared to the built-in indicator, the moon is slightly shifted, because it is centered on the candle and not plotted between two candles like the built-in indicator is doing it.
Feel free to use the indicator for your analysis or build on top of it in an open-source fashion.
Happy trading,
paaax :)
Reference: This indicator is a converted and simplified version of the original javascript algorithm, which can be found here .
Moon phases 2020 for JapanMoon phases 2020 for Japan
月の満ち欠け 2020年度 日本向け
Full Moon is Purple line
満月は紫色
New Moon is Red line
新月は赤色
Exponential Least Squares Moving AverageModified LSMA (Least Squares Moving Average) to use exponential rates of growth instead of linear regression. Inputting a number into the confidence interval allows the user to have set percentage of statistical guarantee based on past movement. To set this percentage of guarantee (Default set to 97.5%), refer to the input values below:
0.000 = 50%
0.255 = 60%
0.525 = 70%
0.835 = 80%
1.040 = 85%
1.285 = 90%
1.645 = 95%
1.960 = 97.5%
2.330 = 99%
TD Moon Cycle Standard Deviation Z Score AlertsHas alerts for the TD 9 function, also the black is Z score and blue is STD Dev
Also the moon functionality of Ichimoonku is built into this as well because sometimes I just want to see the cycles of moon with TD9 ; see that script (Ichimoonku) for more info on moon functionality.
Much love
Enjoy
GL HF
xoxo
Snoop
[BERA] PILE OF SIGNALSHey bulas and beras, another indicator for help your decision.
Ok lets start.
PILE OF SIGNAL, i admit the last word of the title was a bad word and changed to avoid permaban ok lol ahah.
Description= this indicator use moving averages crosses and volume as decision point, what mean this? simple when a move is coming this indicator will show you the probable "direction" of next move. these signals are not buy and sell, also because multiple signals can occour, you should use it with you own TA.
-Moving Averages
-Crosses
-Volume
RED ARROW ABOVE BAR= PROBABILITY OF DOWN MOVE INCOMING
STARS BELOW BAR= PROBABILITY OF UP MOVE INCOMING
Simple.
Moon CyclesInformative Script for astrological seasonal changes
Equinoxes and Solstices
Full,New,Growing and waning lunar phases
Lunar Maturation counter
Trend coloring from one of my oscillators to give script something more than vanilla calculations and labels
Labels can be customized
Plotting set to absolute
First version is placeholder and will be updated with eclipse tracking,background coloration
Script is for seasonal and lunar study,Its not generating signals
The decay and lunar calculations borrowed from MQL
Astraea: Plantary Line Indicator (BennuQuants.net]BennuQuants presents:
Astrea: The Planetary Longitudinal Indicator
DOCUMENTATION: bennuquants.net
"Astraea is our version Gann’s planetary line indicator, and shows the longitude of a given planet. These lines can be used as harmonic pivot points. This is the first and only astro trading instrument available on TradingView at this time.
As a disclaimer, this is one of the most intensive indicators and areas we have found to in TA. We cannot determine the probability of success with any of these systems, but are providing the framework with which to find profitable systems. This system has been back tested against other experts and works in the same manner, bringing Astrotrading to TradingView for the first time."
This indicator was created from replicating and improving upon Gann based techniques which were somewhat hidden in nearly 1000 pages of writing and text. We strongly recommend reading the books found at the back of the documenation.
If you want a 7-day free trial, please join the Discord. There will also be a new channel available to astro-traders who are interested in learning more about Gann and harmonic trading. The asking price for the indicator currently is $100. If you have financial issues or a proposal, please feel free to reach out. If the quantity is an issue and you wish to make a charitable donation, that is also an option.
Legal Disclaimer: By using this indicator you agree that BennuQuants is not liable for any losses that may occur while trading financial assets. Trading is a risky endeavor and losses may occur. Your decisions are your own.
You are entitled to a copy of Astraea as long as TradingView as a platform exists. If for any unseen reason the hosting account is banned, we will restore access as soon as possible. If you are transferring TradingView accounts, we will work with you to assist the transition process.
More information can be found here: bennuquants.net
Mewn PhasesPhases of the moon, based on Julian date. Commissioned indicator. Option to highlight the background for the 4 other phases of the moon.
420_IchimoonkuSup all,
Snoop here with another script -- this time it is an ichimoku-type script. The ichimoku system is very powerful and the base script I have chosen to work from is the work of BrainZZ and Chris Moody; I added some alerts based on their signals and recolored to my liking. I suggest using the 'alert once per bar (on close)' if utilizing the alerts for TS crossing KS or the KS slope direction.
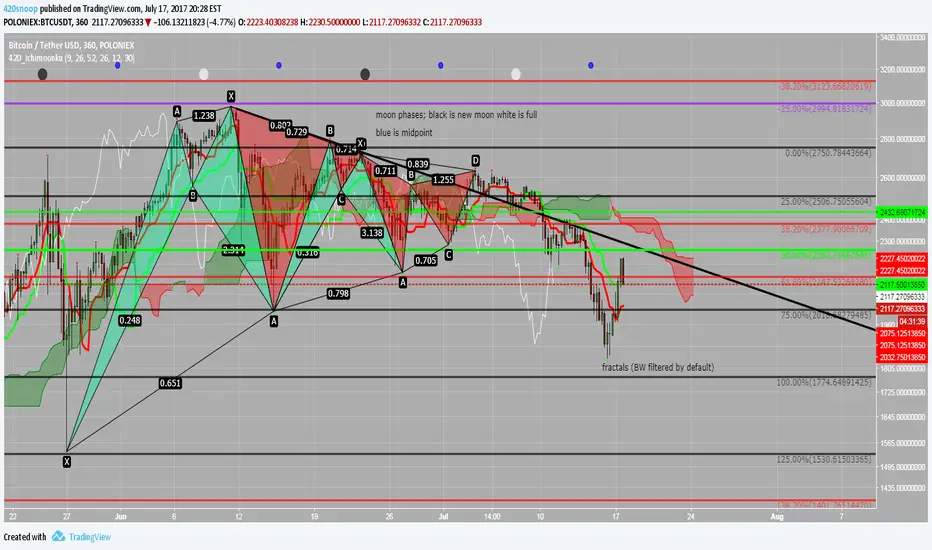
This script is great because it includes a moonphase indicator as well. This moonphase indicator was the work of Glaz and I appreciate the work he did on the base script which I have further modified and incorporated into this indicator. New moons are black, full moons are white, and the Q1 and Q3 are shown as blue.
The last thing in this script is the Williams Fractal and Higher High Higher Low fractal recognition. This is the work of JustUncleL and I appreciate the work he has done.
I hope everyone can get some good useage out of this it is packed full of some very powerful tools; feel free to PM me if you need resources on the ichimoku system or check out the education section of ichimoku_trader's posts.
As always good luck and happy trading!
xoxo
-- Snoop