Buy and sell alerts using Ema's***What this indicator does:***
1) It calculates two EMAs and an RSI
emaS = short EMA (default 9) → reacts faster to price
emaL = long EMA (default 21) → reacts slower, defines trend bias
rsi = RSI (default 14) → momentum confirmation
2) It defines a “trend state” (bull/bear) with optional RSI confirmation
Bull trend when:
9 EMA is above 21 EMA AND
RSI is ≥ 55 (only if useRSI = true)
Bear trend when:
9 EMA is below 21 EMA AND
RSI is ≤ 45 (only if useRSI = true)
This is why you see the green/red background tint—it’s marking the current trend state.
3) It generates Buy/Sell signals on EMA crossovers (plus optional RSI filter)
Buy signal happens only when:
9 EMA crosses above 21 EMA, and
RSI is ≥ 55 (if enabled)
Sell signal happens only when:
9 EMA crosses below 21 EMA, and
RSI is ≤ 45 (if enabled)
**Best timeframe to use (to reduce false signals)**
Because this is a crossover system, it will always whipsaw in chop—lower timeframes whip more.
✅ Best overall: 15-minute
Best balance of signal quality and frequency
EMA crosses mean more when candles are “real” and not micro-noise
RSI confirmation works better
Also very good: 5-minute (if you trade intraday a lot)
More signals than 15m, still usable
Expect some chop during lunchtime / ranges
Cleanest but fewer trades: 1-hour
Very low noise, great for swing/intraday trend holds
Fewer entries, but highest reliability
Avoid (unless you add filters): 1-minute / 3-minute
EMA crosses happen constantly in chop
RSI thresholds (55/45) get hit too easily and still whipsaw
My default recommendation:
Day trading: 15m
Faster scalps: 5m (with a filter)
Swing/position: 1h
*** Some Indicators that pair well with this (and why)***
1) ADX (Trend Strength Filter) — top pairing
Use ADX to avoid taking signals in chop.
Only take buys/sells when ADX > 18–25
If ADX is low, ignore EMA crosses (they’ll whipsaw)
2) VWAP (Intraday Bias Filter) — best for stocks/indices intraday
Prefer BUY only if price is above VWAP
Prefer SELL only if price is below VWAP
This cuts a ton of false signals on 5m/15m.
3) ATR (Stop/Target + Volatility Filter)
Not for entries—use it for:
Stop placement (e.g., 1–1.5× ATR)
Profit targets or trailing stops
Also helps you avoid tiny-chop sessions where ATR is very low.
4) Higher Timeframe Trend Filter (simple but powerful)
Example:
Trade 15m signals only in the direction of the 1h EMA trend
This is one of the easiest ways to reduce false trades.
5) Support/Resistance / Pivot Points
EMA cross signals work best when they break/hold key levels.
Use daily pivots, prior day high/low, OR key S/R zones
Take signals that align with a break + retest
The EMA’s alert with Buy/Sell Levels (v2) is a simple trend-following indicator designed to help traders identify directional bias and high-probability buy and sell opportunities using moving averages and momentum confirmation.
The script combines:
A fast and slow Exponential Moving Average (EMA) crossover for trend direction
An optional RSI confirmation filter to reduce false signals
Visual trend highlighting and clear on-chart buy/sell labels
Built-in alert conditions for automation and notifications
How It Works
Bullish Trend
Short EMA is above the Long EMA
RSI is above the user-defined buy threshold (default: 55)
Bearish Trend
Short EMA is below the Long EMA
RSI is below the user-defined sell threshold (default: 45)
Buy Signal
Short EMA crosses above Long EMA
RSI confirms bullish momentum (if enabled)
Sell Signal
Short EMA crosses below Long EMA
RSI confirms bearish momentum (if enabled)
The background color visually reflects the current trend state:
Green = Bullish
Red = Bearish
Recommended Timeframes
15-minute – Best balance of reliability and signal quality
5-minute – Faster signals (recommended with additional filters like VWAP or ADX)
1-hour – Higher-confidence swing and trend trades
Lower timeframes may produce more false signals due to market noise.
Best Use Cases
Trend continuation trades
Momentum breakouts
Intraday and swing trading
Important Notice: This indicator is intended for educational and informational purposes only.
It is not financial or investment advice. Market conditions can change rapidly, and no indicator can guarantee profitable results. Always use proper risk management and confirm signals with additional analysis before making any trading or investment decisions. You are solely responsible for any trades you place using this indicator.
Movingaveragecrossover


ColorFlow EMA📊 ColorFlow EMA — Trend Flow & Bias Indicator
🔹 What This Indicator Does
ColorFlow EMA is a clean, visual trend-flow indicator designed to show directional bias and momentum state at a glance.
It uses two exponential moving averages:
Fast EMA (default: 10)
Slow EMA (default: 20)
The area between the EMAs is color-shaded to clearly display whether price is in a bullish or bearish flow.
🎨 Visual Logic
🔵 Blue shading → Bullish flow
(Fast EMA above Slow EMA)
🔴 Red shading → Bearish flow
(Fast EMA below Slow EMA)
Optional crossover markers can be enabled for visual confirmation when EMA alignment changes.
🧠 How to Use ColorFlow EMA
This indicator is not a standalone strategy and is not intended for signal-chasing.
It is best used as a context and bias filter alongside:
Price action
Market structure (HH/HL, LH/LL)
Support & resistance or supply & demand zones
Pullbacks vs premium/discount
Typical use cases:
Favor longs when the flow is blue
Favor shorts when the flow is red
Avoid forcing trades when EMAs are tangled or flat
Wait for pullbacks into structure instead of chasing price
⚠️ Important Notes
EMA crossovers alone do not guarantee profitable trades
Market conditions, structure, and location always matter
Works best in trending or transitioning markets
Not designed for ranging/choppy environments without context
⚙️ Customization
EMA lengths can be adjusted
Crossover markers can be toggled on/off
Designed to stay visually clean and uncluttered
🎯 Who This Indicator Is For
Traders who prioritize price action over indicators
Intraday traders (forex, indices, ETFs, stocks)
Traders who want clarity, not noise
📝 Final Thought
ColorFlow EMA answers one simple question:
“Should I be looking for longs or shorts here?”
Use it for bias, not prediction.

Blockcircle Waveform BandsThe Blockcircle Waveform Bands is a comprehensive trend-following indicator built around a layered moving average ribbon system. The core idea is simple: when shorter-term averages stack above longer-term ones in proper sequence, the trend is healthy. When they compress, cross, or invert, something is changing.
This indicator was developed to solve a common problem. Traders often clutter their charts with multiple moving averages, each added separately, each requiring manual tweaking. Waveform Bands consolidates everything into a single, unified view.
You get fast, medium, and slow bands that expand and contract with momentum, change color based on trend direction, and provide clear reference points for entries, exits, and trend assessment.
Also included is a configurable higher-timeframe bias band, which allows you to track the macro trend without switching timeframes. Most useful is following the 21W EMA and 20W SMA crosses.
What Makes This Indicator Different
While moving average ribbons are a well-known concept, this indicator extends beyond simple MA plotting in several meaningful ways that justify its protected source status.
First, the indicator calculates a proprietary confluence score ranging from negative 100 to positive 100. This score is not just counting crossovers. It uses weighted contributions from band alignment, price position across multiple timeframe zones, and momentum confirmation via rate of change integration. The specific weighting logic and calculation method represent original development work not available in standard MA ribbon indicators.
Second, the summary scoring system evaluates trend quality on a 0 to 100 scale using a multi-factor algorithm. Trend state contributes up to 35 points, band alignment contributes up to 30 points, price position contributes up to 20 points, and momentum confirmation contributes up to 15 points. This weighted approach provides objective trend measurement rather than relying solely on visual interpretation.
Third, the signal generation framework offers five distinct signal methods, each with three sensitivity levels, creating fifteen unique configurations. This is a complete signal system with filtering logic, not simply MA crossover alerts. The interaction between signal type, sensitivity, and the optional trend filter creates a flexible framework that traders can calibrate to their specific style.
Fourth, the optional smoothing layer applies additional processing after the base MA calculations are complete. This reduces noise and whipsaws during choppy conditions while maintaining responsiveness during genuine trend moves.
These proprietary elements, particularly the scoring algorithms and signal framework, represent the original work that distinguishes this from standard open-source MA ribbons available elsewhere.
Key Features
Multi-Band Ribbon System: Three distinct bands covering short, medium, and long-term trend structure. The fast band uses configurable MAs with default periods of 8, 13, and 16 for immediate price action. The mid band spans 21 to 42 periods, capturing the intermediate swing structure. The slow band covers 50 to 60 periods, representing the underlying trend foundation. Each band can be independently toggled, colored, and adjusted.
Flexible Moving Average Types: Choose from eight MA calculation methods including EMA, SMA, WMA, VWMA, HMA, DEMA, TEMA, and ZLEMA. Set a default type for all bands or override individually per band. Useful for those who prefer Hull MA smoothness or the responsiveness of DEMA and TEMA.
Major Moving Averages: Built-in 200-period MA for institutional-level support and resistance. Pi cycle MA using 314 periods for longer-term cycle analysis. Fully customizable additional MA with adjustable length, type, and color. Clear visual distinction with configurable line widths.
Higher Timeframe Bias Band: Dual MA system pulled from any higher timeframe you choose. Default configuration mirrors the popular 21-week EMA versus 20-week SMA setup. Both MAs are fully adjustable in length, type, and timeframe. Automatic bullish or bearish fill coloring based on which MA leads. Keeps macro context visible without leaving your current chart.
Dynamic Trend Coloring: All bands automatically shift color based on detected trend state. Bullish alignment shows green spectrum, bearish shows red, neutral shows yellow.
Trend Detection and Scoring: Algorithmic trend state detection based on band alignment and price position. Confluence scoring system weighing multiple factors from negative 100 to positive 100. Band alignment tracking showing whether each band is internally bullish or bearish. Band expansion and contraction monitoring for momentum assessment. Strength percentage calculation for trend conviction measurement.
Signal Generation: Multiple signal type options including band crosses, price crosses, and full alignment signals. Three sensitivity levels to match different trading styles and timeframes. Optional filtering to show only signals confirmed by the slow band.
Dashboard Display: Comprehensive table with summary score, bias direction, and trend status. Compact mode available for reduced screen footprint.
Alerts: Pre-configured alerts for buy and sell signals. Trend change notifications when bias shifts bullish or bearish. Major MA cross alerts for the 200 MA and Pi MA. Band alignment alerts when all bands synchronize. Confluence threshold alerts for strong directional readings.
How To Use
Identifying Trend Direction: Look at the overall band structure first. In a healthy uptrend, the fast band sits above the mid band, which sits above the slow band. Price should be trading above the fast band or at least within it.
The dynamic coloring gives you an instant read. If everything is green, the trend structure is bullish. Red means bearish. Yellow or mixed colors indicate transition or consolidation.
Check the dashboard summary row for a quick score. Above 60 suggests a solid trend, while below 40 indicates weakness or chop.
Using the Bias Band for Macro Context: The higher timeframe bias band tells you whether the larger trend supports your trade idea. If you are looking to buy on a daily chart, check whether the weekly bias band is bullish, meaning the fast MA is above the slow MA.
When the price is above both bias MAs and the band is bullish, conditions favor long positions. When the price is below both and the band is bearish, conditions favor shorts or staying out.
The fill color between the bias MAs changes automatically. Green fill indicates bullish macro bias and red indicates bearish. This is visible at a glance without checking numbers.
Finding Entry Points: Look for pullbacks into the mid band during established trends. When the fast band compresses toward the mid band and then expands again, this often marks a continuation entry.
Band crossings can signal new trend initiations. When the fast band crosses above the mid band with confirming price action, it suggests a potential long entry. The opposite applies for shorts.
Use the signal markers as alerts to potential opportunities, but confirm with price action. A signal appearing while the price is holding above a key band carries more weight than one appearing in isolation.
Managing Risk and Exits: The slow band often acts as a trailing stop reference during trends. As long as price holds above the slow band on pullbacks, the trend remains intact. This is not always true, but it serves as a helpful general guideline.
Losing the mid band on a closing basis often warns that the move is weakening. This might prompt partial profit-taking or tightening stops.
The 200 MA serves as a major support or resistance level. Trends that break below the 200 after an extended move often accelerate to the downside.
Reading Momentum Through Band Width: When all bands are tightly compressed, expect a directional move soon. Compression represents energy building up.
Expanding bands confirm momentum is present in the current move. Watch for continued expansion on trend days.
Contracting bands during a trend may warn that momentum is fading, even if the price has not reversed yet.
Combining Multiple Timeframes: Enable multi-timeframe mode to see higher timeframe MAs plotted on your current chart. Be careful with this as it can crowd the display, but it is useful for seeing different timeframes stacked together.
This helps identify where significant support or resistance exists above your normal view.
The bias band already provides macro context, but you can set it to different timeframes for different purposes. Day traders might use daily bias bands while swing traders might prefer weekly.
How To Read The Table
The summary row gives you the overall picture. A high score with bullish bias and strong trend status represents ideal conditions for trend-following entries.
Individual band status rows tell you if any divergence exists between timeframes. If the fast band is bearish but mid and slow are bullish, you might be seeing a pullback rather than a reversal.
Price position percentages show how extended the price is from each band. Extreme readings in either direction suggest potential mean reversion or exhaustion.
Limitations
This indicator is designed for trending markets and performs best when clear directional movement exists. During extended consolidation or ranging conditions, the confluence score may oscillate near zero and signals may produce mixed results.
Like all moving average based systems, signals are lagging by nature. The indicator confirms trends rather than predicting them. Early entries require additional confirmation from price action or other methods.
The default settings are optimized for daily and higher timeframes on crypto and forex markets. Intraday traders and those analyzing other asset classes may need to adjust the band lengths to match their specific conditions.
This indicator should be used as part of a complete trading approach that includes proper risk management and position sizing. It is not intended as a standalone system.
Getting Started
Start with the default settings and observe how the indicator behaves on your preferred instruments and timeframes before customizing.
The indicator works on all markets and timeframes, but the default MA lengths are optimized for daily and higher charts. For intraday trading, consider reducing the band lengths proportionally.
Use the compact table mode if the full dashboard feels cluttered. The essential information remains visible while using less screen space.
Set up alerts for trend changes and major MA crosses so you do not need to watch charts constantly. Let the indicator notify you when conditions change.

EMA Tango [Ultima Edition]# EMA Tango
## Overview
EMA Tango is a precision-focused breakout system designed to filter out market noise and identify high-probability entries.
Many traders struggle because they enter during low-volatility "chop" or chase prices that are already overextended. EMA Tango solves this by enforcing a strict Multi-Factor Confluence rule. It identifies when the short-term and medium-term trends are tightly compressed (The Tango) and signals exactly when that energy is released with institutional backing.
It includes a built-in Visual Backtester to instantly gauge the historical win rate of the current settings on any timeframe directly on your dashboard.
## The Strategy Logic
The system is based on the physics of market volatility: Compression leads to Expansion.
1. **The Tango (Accumulation):** When the short-term EMA (9) and medium-term EMA (21) compress tightly together, the market is storing potential energy. This is the "Watch Zone."
2. **The Move (Expansion):** We wait for a volatility release (Squeeze Fired) or a decisive Crossover.
3. **The Validation:** A breakout is ONLY valid if all selected filters align:
* **Volume:** Institutional money is present (High Relative Volume).
* **Momentum:** Trend power (WAE) breaks the volatility bands.
* **Safety:** Price is not statistically overbought (Z-Score check).
* **MTF:** The macro trend agrees with the current chart.
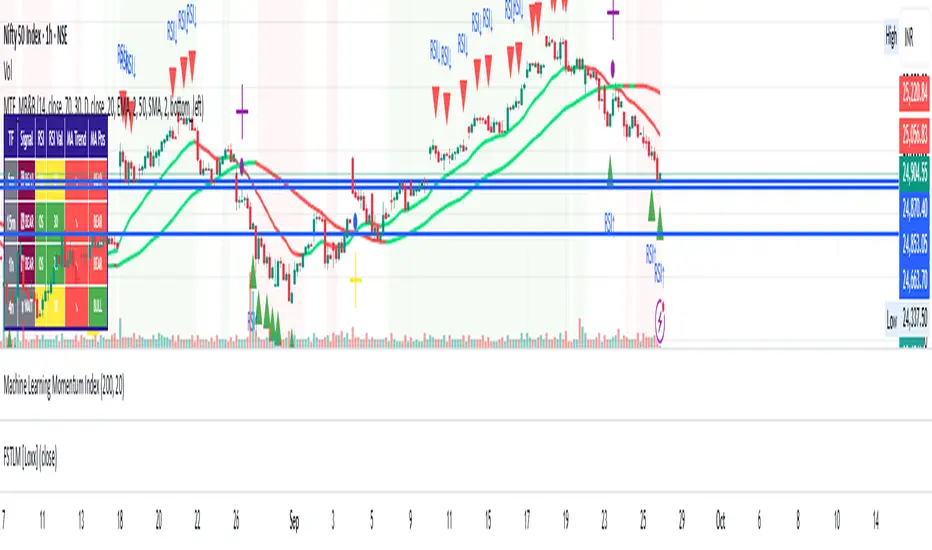
## Visual Guide & Dashboard
The chart visuals are designed to keep you focused on "Action" vs. "Waiting."
* **Yellow Background (The Watch Zone):**
* **Meaning:** The market is in a "Pinch." Volatility is low, and EMAs are dancing together.
* **Action:** Get ready. Do not trade yet. Wait for a breakout.
* **Green Background / Up Triangle:**
* **Meaning:** Confirmed LONG breakout. All factors (Trend, Volatility, Momentum, MTF) are aligned.
* **Red Background / Down Triangle:**
* **Meaning:** Confirmed SHORT breakdown. All factors are aligned.
* **Bottom Dashboard:**
* Displays the real-time status of every factor (Trend, Momentum, Volume, etc.).
* **Win Rate:** Shows the historical performance of the strategy on the current chart based on ATR targets.
## Configuration & Settings
This script is highly customizable. You can toggle every factor on or off to suit your trading style.
### 1. Factor Switches (Crucial)
You can relax or tighten the strategy by enabling/disabling these filters:
* **Trend Filter:** Checks EMA 9/21 alignment.
* **Volatility:** Requires a TTM Squeeze release or fresh Cross.
* **Momentum (WAE):** Requires strong momentum (Explosion).
* **Volume (RVOL):** Requires volume to be higher than average.
* **Z-Score:** Prevents buying tops or selling bottoms (Mean Reversion protection).
* **MTF Check:** Requires the higher timeframe to match your direction.
### 2. Volume Settings
* **RVOL Threshold:** How much volume is needed relative to the average (Default: 1.5x).
* **Use Projected Volume:** Highly Recommended. This calculates where the volume will likely end up based on the current elapsed time of the candle. This allows signals to appear before the candle closes if volume is rushing in.
### 3. Backtester Settings
* **ATR Length:** Sensitivity of the volatility calculation.
* **Stop Loss (xATR):** Distance of the stop loss (e.g., 1.5x ATR).
* **Reward to Risk:** Target profit multiplier (e.g., 1.5R).
* *Note: The Win Rate on the dashboard is calculated based on these parameters.*
### 4. UI & Visuals
* **Colors:** Fully customizable colors for Long, Short, and Pinch signals.
* **Plot EMA:** Toggle the EMA lines on/off to keep your chart clean.
## Pro Tips for Best Results
1. **Visual Backtesting:** Zoom out on your chart. Look at the Win Rate on the dashboard. If it is low, the market might be ranging, or your Stop Loss settings are too tight for the current volatility.
2. **The "Pinch" Background:** If you don't see the yellow background, the trend is likely already extended. Waiting for a Tango (Pinch) ensures you are entering at the start of a move, not the end.
3. **Data Window:** Hover your mouse over any candle to see exact values for RVOL, Z-Score, and Signal status in the TradingView Data Window (right-side panel).
## Disclaimer
This tool is for educational and analytical purposes only. Past performance (as shown in the visual backtester) does not guarantee future results. Always manage your risk.

Swing Master by Pooja📘 Swing Master by Pooja
Invite-Only | Rule-Based Swing & Trend Structure Indicator
🔍 What this indicator is
Swing Master by Pooja is a rule-based technical analysis indicator designed to help traders identify high-quality swing opportunities within an established trend structure.
This script is not a trading strategy.
It does not execute trades and does not provide fixed targets or stop-loss levels.
Instead, it functions as a decision-support tool.
Visual signals appear only on confirmed candles, and only when trend structure, momentum, and market participation align together.
The core objective of this indicator is filtering low-quality market conditions and avoiding random entries, not generating frequent signals.
🎯 Intended Trading Use
This indicator is intended for traders who:
Trade trend-based swings and pullbacks
Prefer structure-aligned entries instead of chasing price
Want multi-factor confirmation before acting
Apply their own execution and risk-management rules
Applicable on:
Indices
Stocks
Futures
Intraday & higher-timeframe swing charts
🧠 Why this is NOT a simple indicator mashup
Although Swing Master uses EMA, RSI, Volume, and multi-timeframe context, each component serves a distinct and non-overlapping role.
No indicator is used to confirm itself, and no single condition can trigger a signal independently.
Signals are generated only when all required structural and momentum conditions align together on a confirmed bar, reducing noise and hindsight bias.
🔹 EMA Structure (50 / 100 / 200)
Defines trend hierarchy and market structure
Strictly filters trades in the dominant trend direction
Identifies pullback zones, not breakout points
EMA stacking is used to determine structural bias, not direct entries.
🔹 Pullback-Tolerance Logic (Key Original Component)
Instead of requiring exact EMA touches, the script applies a tolerance-based pullback zone around EMAs.
This allows:
More realistic swing entries
Fewer missed opportunities
Reduced noise compared to rigid EMA rules
This pullback-zone evaluation is custom-designed and central to the indicator’s behavior.
🔹 RSI Momentum Filter
Ensures pullbacks occur with momentum acceptance
Filters entries during weak or exhausted moves
Helps avoid counter-trend traps
RSI is used strictly as a momentum-quality filter, not as a standalone signal.
🔹 Volume Participation Filter
Confirms that price movement has market participation
Filters signals during low-interest or weak-volume phases
Helps avoid false continuation attempts
🚦 Signal Types Explained (Rule-Specific & Non-Repeating)
Each visual signal represents a distinct market condition, not repeated logic.
▸ sb — Swing Buy
Trend-aligned pullback near EMA structure
RSI confirms momentum
Volume confirms participation
▸ FS — Future Sell
Mirror logic of Swing Buy
Appears only in established downtrends
▸ SB / SS — Strong Buy / Strong Sell Zones
Price acceptance above or below all EMAs
Indicates strong directional control
Plotted only on the first bar of zone entry (no repetition)
▸ GB / GS — Golden Buy / Golden Sell
EMA 100 / EMA 200 crossover
Represents a structural trend transition
Appears only on confirmed crossovers
Each signal type follows its own independent rule-set.
📊 Multi-Timeframe Dashboard (Context Only)
The optional dashboard provides:
Trend state across higher timeframes
Top-down market context for directional bias
The dashboard is informational only and does not generate signals.
🔔 Alerts
Alert conditions are available for all signal types.
Alerts trigger only on confirmed candles and are intended to support manual analysis, not automated trading.
🔐 Why Invite-Only & Closed-Source
Swing Master incorporates:
Stateful signal control
Multi-condition validation
Non-repeating signal logic
Custom pullback-zone evaluation
The source code is protected to preserve the internal interaction, sequencing, and state management logic, not to conceal commonly known indicators.
⚠ Disclaimer
This indicator is provided for educational and analytical purposes only.
It does not constitute financial advice and does not guarantee results.
All trading decisions, execution, and risk management remain entirely the user’s responsibility.

Custom EMA/SMA Ribbon [TheScalpingAnt]Overview
Custom EMA/SMA Ribbon is a premium market trend framework designed to simplify trend recognition, improve timing, and provide clearer structure during both trending and corrective environments. Unlike traditional moving-average indicators, this ribbon focuses on visual clarity, hierarchy, and actionable interpretation — delivering institutional-style trend information directly on your chart.
It is engineered for traders who demand reliability, precision, disciplined decision support, and a clean visual experience without laggy oscillators or noisy signals.
Core Concepts
This indicator is built on three fundamental professional trading concepts:
Trend Structure
Multiple layered moving averages allow traders to instantly understand whether the market is aligned, compressing, transitioning, or breaking down.
Hierarchy & Visual Priority
Short-term MAs are always plotted in front of longer-term averages. This ensures decision-critical structures remain visible and readable, even during market volatility.
True Trend Validation (Not Slope Noise)
Color logic is based on structural dominance rather than temporary slope changes.
A line turns bullish only when it is above the next slower MA, and bearish when below it.
This prevents misleading color flips, maintains logical consistency, and improves confidence in interpretation.
Key Features
• Selectable EMA or SMA mode
• 6-layer ribbon trend architecture
• Correct priority stacking (MA1 always front → MA6 always back)
• Professional bullish / bearish dominance color logic
• Clean and readable premium visual design
• Works on crypto, forex, stocks, and indices, any market.
• Zero repainting
• Lightweight and highly efficient performance
This ensures instant clarity whether trading intraday or analyzing macro market structure.
Customization
Users retain full analytical power and flexibility without losing structure:
• Choose EMA or SMA
• Fully configurable MA lengths
• Individual line style (solid, dashed, dotted)
• Independent line thickness per MA
• Works seamlessly on any symbol and timeframe
This makes the ribbon suitable for swing traders, intraday traders, position traders, and strategy/system builders.
Usage Guidance
This ribbon functions as a market regime detector and structural trend guide, not a simple “buy/sell” tool.
Common professional use cases:
• Identify trend continuation vs structural breakdown
• Confirm market alignment before entering positions
• Validate pullbacks without losing macro perspective
• Avoid trading against dominant bias
• Detect accumulation, consolidation, and expansion phases
Interpretation logic
• Green alignment → structured bullish trend environment
• Red alignment → structural weakness / bearish regime
• Compression → potential volatility, transition, or trend shift area
Example Interpretation
Bearish → Bullish transition example:
• Shorter MAs recover first
• They cross back above slower averages
• Each line turns green only when structural control is truly regained
• A fully green staircase indicates confirmed bullish trend structure
During pullbacks:
Price may retrace, but if hierarchy remains intact, the ribbon stays green — preventing unnecessary panic exits.
Only when structural dominance truly breaks does the ribbon shift red, warning traders to reduce exposure, re-evaluate bias, or reposition.
Settings (Defaults & Logic)
Default optimized configuration:
• Lengths: 10 / 20 / 50 / 100 / 150 / 200
• Type: EMA
• Styles: Solid
• Thickness: 2
Users may customize thickness, style, and calculation type without losing conceptual integrity.
Conclusion
The Custom EMA/SMA Ribbon delivers:
• Higher clarity
• Reduced chart noise
• Stronger confidence in execution
• Superior trend comprehension
• A disciplined, structured trading perspective
Built for serious traders, this tool transforms raw market movement into clear structural intelligence.
Disclaimer
This indicator is a technical analysis tool for educational and analytical purposes only. It does not guarantee profits, does not constitute financial advice, and should not be used as the sole decision-making method. Trading involves risk; users remain responsible for their decisions.

ARDO (v2.4.7) Moving Averages v1.1ARDO Moving Averages v1.1 (Overlay)
Companion overlay that recreates ARDO driver states (Spreads A/B, LinReg state + slope/gradient, tiers/MK tiers, gate pass/block) and maps those states onto up to 5 moving average overlays + one optional MA-to-MA fill.
ARDO v2.4.6 (original indicator)
What this overlay does
Computes ARDO “driver states” internally (no external source required): Spread A, Spread B, LinReg (4-state), LinReg slope/accel → gradient opacity, quartile/tier regimes, MK tiers, and Gate pass/block.
Paints MA overlays using selectable “Color Modes” (Spread A, Spread B, ARDO LinReg, MK Tier, Quartile Background, Gate Pass, Bull/Bear A vs B, or Fixed).
Optional Fill between two overlay MAs using a selected color mode (intended for regime/bull-bear shading between MA lines).
Core concepts (quick read)
Baseline / MA A / MA B define Spread A and Spread B (% distance vs baseline).
LinReg is a regression of a selected source (Spread A, Spread B, or Spread(A+B)).
LinReg State (4 colors) is derived from slope sign and acceleration (trend speeding up vs slowing down): Green / Orange / Red / Gray.
Gradient Opacity scales line opacity based on slope magnitude (strong vs weak).
Tier / Quartile maps current regime into bins (Q0–H4) using rolling percentiles (or manual thresholds).
MK Tier is an alternate tier engine (Standard / Asymmetric / Mirror BG).
Gate is a boolean pass/block that can combine spread and trend requirements (optional).
How to set it up (recommended workflow)
Pick ARDO Core MAs (Baseline, MA A, MA B) and your main LinReg Source.
Tune LinReg Length + Gradient Scale to match your timeframe (shorter = faster flips, longer = smoother).
Decide Tier mode (Standard vs Asymmetric) and whether tiers use All Bars or Pivots Only .
Set up Gate (or leave off): use it as a “permission layer” for entries.
Configure your overlay MAs (1–5) and assign each a Color Mode aligned to its job:
MA1 = fast impulse (often Spread A)
MA2 = trend state (often ARDO LinReg)
MA3 = slower confirmation (often Spread B)
MA4 = gate/permission readout (Gate Pass)
MA5 = regime (MK Tier)
Enable Fill only if you want regime shading between two MAs (keep it simple: one fill only).
Inputs explained (by group)
1) Sources & Moving Averages (ARDO Core)
Price Source : price used for MA calculations (default close).
Baseline MA Type/Length : reference MA for spreads.
MA A Type/Length : “A” spread driver (usually faster).
MA B Type/Length : “B” spread driver (often slower fast MA).
EMA Fast / EMA Slow : used only if the EMA gate toggle is enabled.
2) Linear Regression & Gradient
LinReg Length : lookback used by regression.
LinReg Source : Spread A, Spread B, or Spread(A+B).
Slope Lookback : bars used to compute slope as (linreg - linreg ) / n.
Adaptive Opacity Scale : derives slope “cap” from a rolling percentile (reduces volatility-regime distortion).
Fixed Scale Cap : used if adaptive scaling is off.
Min/Max Opacity : clamps gradient range.
3) Tiers & Population
Tier Mode : Standard vs Asymmetric (changes percentile boundary logic).
Tier Population : All Bars vs Pivots Only.
Manual Thresholds : if enabled, uses user cutoffs instead of computed percentiles.
Auto-Percentile Window : rolling window size for percentiles.
4) Region Rendering (BG / regime palette)
BG colors for Q0/Q1/Q2/Q3/Q4/H4 : the palette used for “Quartile Background” color mode and MK “Mirror BG”.
Pivot Sensitivity : relevant only for Pivots Only population.
5) Gate (Pass/Block)
Gate: SpreadA > LinReg (toggle)
Gate: EMA Fast > EMA Slow (toggle)
Min Spread A (%)
Min |LinReg Slope|
Gate PASS/BLOCK colors : also used by Gate Pass color mode.
6) Overlay Moving Averages (MA1–MA5)
MA Len / Type : SMA, EMA, WMA, Wilder, Triangular, HMA, Adaptive.
Color Mode :
Fixed
ARDO Spread A
ARDO Spread B
ARDO LinReg (4-state + gradient opacity)
MK Tier
Quartile Background (Q0–H4 palette)
Gate Pass
Bull/Bear (A vs B)
Base Color : used for Fixed (and as fallback).
Line Width
Style (if present): line / stepline / markers depending on the MA slot.
Bull/Bear (A vs B) definition
Bull when MA A > MA B
Bear when MA A < MA B
Alerts (built-in alertconditions in v1.1)
Spread A State
State changed (any change)
Turned Green / Orange / Red / Gray
LinReg State
State changed (any change)
Turned Green / Orange / Red / Gray
LinReg Gradient
Gradient High (slope strength high)
Gradient Low (slope strength low)
Gate
Gate Pass ON
Gate Pass OFF
Bull/Bear Flip
Bullish flip (A crosses above B)
Bearish flip (A crosses below B)
Tier / Quartile
Entered Q0
Entered Q1
Entered H3
Entered H4
Simple Alignment
LinReg Green AND SpreadA Green (basic “momentum aligned” condition)
How to use Gate (and how to loosen/tighten it)
Use Gate as a filter , not as the entire strategy: it’s best as “permission to trade” plus your own trigger.
If Gate is too strict :
Disable EMA Fast > EMA Slow gate (trend filter) OR disable SpreadA > LinReg gate (structure filter).
Lower Min Spread A threshold.
Lower Min |LinReg Slope| threshold.
Increase LinReg Length slightly to reduce noisy flips (sometimes helps pass stability).
If Gate is too loose :
Enable both gate components (SpreadA>LinReg AND EMA Fast>Slow).
Raise Min Spread A and/or Min |LinReg Slope|.
Shorten LinReg Length to react faster (but can increase chop).
Practical “read” using the default overlay roles
MA1 (fast, Spread A mode) : impulse / early acceleration cues.
MA2 (trend, LinReg mode) : regime + momentum state; opacity tells you strength.
MA3 (confirmation, Spread B) : slower confirmation; helps avoid “one-candle impulse traps”.
MA4 (Gate Pass) : permission layer; reduces counter-trend entries.
MA5 (MK Tier) : regime band; helps distinguish “deep OS/OB context” vs mid-zone noise.
Notes
This is an overlay; it’s designed to complement the original ARDO oscillator pane.

Programmers Toolbox of ta LibraryA programmer's "Swiss army knife" for selecting functions from the " ta Library by Trading View " during coding. Illustrates the results of the individual library functions. Adds a few extra features. Extensively and uniquely documented.

3 EMA with Alerts 2025This indicator plots three key EMAs (20, 50, and 200) directly on the chart, making it easy to track short-, medium-, and long-term trends. A color-coded table is displayed in the top-right corner for quick reference.
The script also includes smart alerts that trigger only when the state changes:
• 🔵 EMA 20 crossing above EMA 50 & EMA 200 → Bullish signal
• 🔴 EMA 20 crossing below EMA 50 & EMA 200 → Bearish signal
This tool is designed for traders who want clean visuals, reliable alerts, and simplified trend recognition in 2025 markets.

Institutional Trend & Liquidity Nexus [Pro]Concept & Methodology
The core philosophy of this script is "Confluence Filtering." It does not simply overlay indicators; it forces them to work together. A signal is only valid if it aligns with the macro trend and liquidity structure.
Key Components:
Trend Engine: Uses a combination of EMA (7/21) for fast entries and SMA (200) for macro trend direction. The script includes a logical filter that invalidates Buy signals below the SMA 200 to prevent counter-trend trading.
Liquidity Imbalance (FVG): Automatically detects Fair Value Gaps to identify areas where price is likely to react. Unlike standalone FVG scripts, this module is visually optimized to show support/resistance zones without obscuring price action.
Smart Confluence Zones (Originality):
The script calculates a background "State" based on multiple factors.
Bullish Zone (Green Background): Triggers ONLY when Price > SMA 200 AND RSI > 50 AND Price > Baseline EMA.
Bearish Zone (Red Background): Triggers ONLY when Price < SMA 200 AND RSI < 50 AND Price < Baseline EMA.
This visual aid helps traders stay out of choppy markets and only focus when momentum and trend are aligned.
█ How to Use
Entry: Wait for a "Triangle" signal (Buy/Sell).
Validation: Check the Background Color. Is it highlighting a Confluence Zone?
Example: A Buy Signal inside a Green Confluence Zone is a high-probability setup.
Example: A Buy Signal with no background color suggests weak momentum and should be taken with caution.
Targets: Use the plotted FVG boxes as potential take-profit targets or re-entry zones.

BT LigmaThe BT Ligma indicator combines momentum-based signals with volatility filters to identify potential trend reversals and high-probability entry points.
It uses a set of Exponential Moving Averages (EMAs) – typically a fast EMA (e.g., 9-period) crossing over a slower one (e.g., 21-period) – to generate baseline buy/sell signals. These are enhanced by a proprietary "Ligma Spread" filter, which measures the dynamic spread between short-term price action and a volatility envelope (similar to Bollinger Bands but customized with ATR multipliers). This filter helps weed out false signals in choppy markets by requiring a minimum spread threshold before confirming a trade alert.
BT Ligma allows a user to select up to 3 EMAs, the MA calculation method, and signal individual candles that cross EMA 1 & 2, or all 3 bands in the same bar.
Version 1.4, includes refined alert logic, including audio/visual notifications and optional trailing stops based on EMA alignments.
To use it effectively for trade entries:
Long (Buy) Entries: Look for a bullish EMA crossover (fast EMA above slow) combined with a positive Ligma Spread expansion (indicating increasing momentum). Enter when the signal fires on a close above the recent swing high, ideally on a timeframe like 15m or 1h for scalping/day trading. Pair this with volume confirmation or RSI above 50 to avoid overbought traps.
Short (Sell) Entries: Wait for a bearish EMA crossover (fast below slow) with a contracting or negative Ligma Spread (signaling potential downside volatility). Enter on a close below the recent swing low, using higher timeframes (e.g., 4h) for swing trades to capture larger moves.
General Tips: Always apply risk management – set stops below/above the slow EMA, target 2-3x risk-reward ratios, and avoid trading during low-liquidity periods. Backtest on historical data to tweak parameters, and combine with fundamentals like news events for better context.
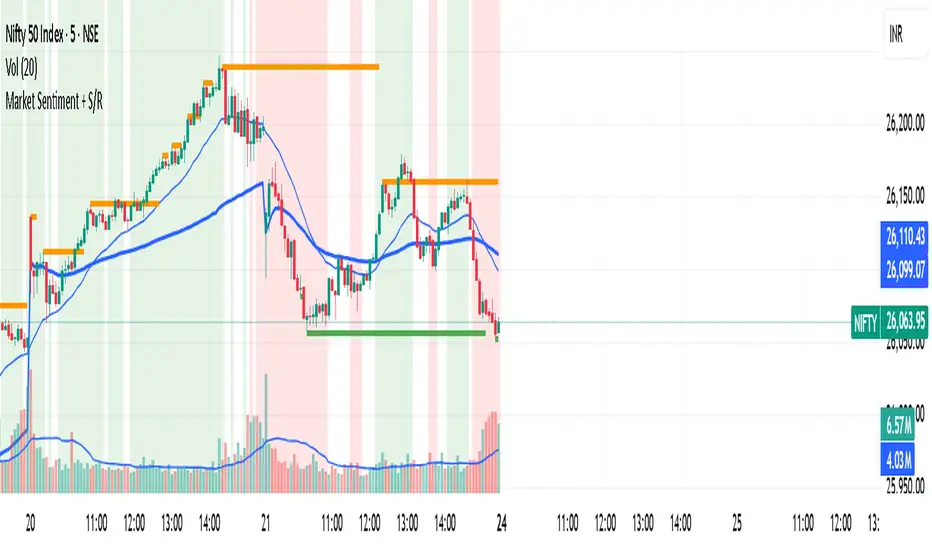
Market Sentiment + S/R KPRThis script is having VWAP and moving average cross overs. and also support and resistence.
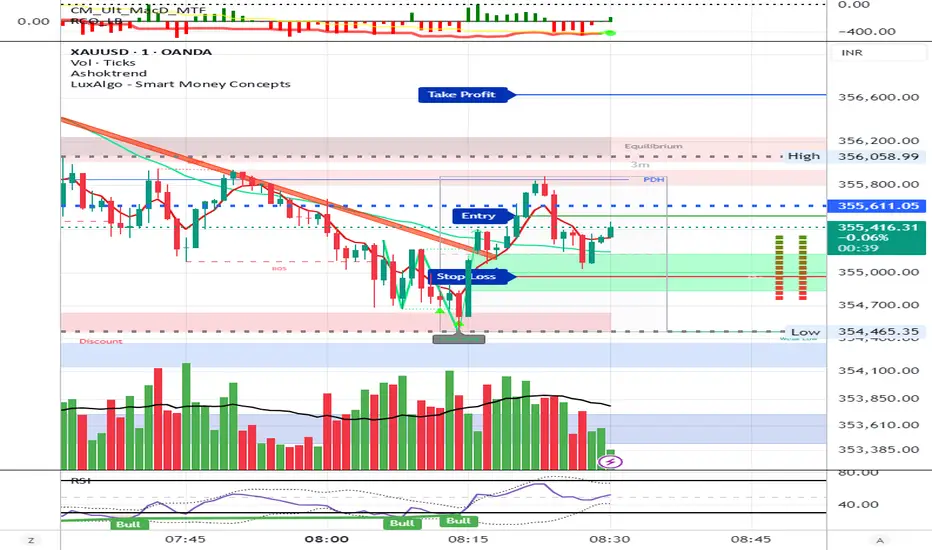
AshokTrendThe AshokTrend indicator uses a combination of trendline logic and pivot high/low detection to signal possible BUY and SELL trades based on price action and structural breakouts.
### Buy/Sell Signal Logic
- **Buy Trade Signal**: It identifies local pivot lows using a lookback period, then checks multiple conditions comparing current and previous pivot values to validate a breakout. If conditions are met, triangle-up shapes are plotted below bars to indicate a possible long trade, and trendlines are drawn connecting pivots for visual confirmation.
- **Sell Trade Signal**: It locates pivot highs, applies similar multi-point checks, and confirms breakdowns in structure. Upon a valid signal, triangle-down shapes are plotted above bars to indicate a possible short trade, with corresponding trendlines marking pivot connections.
### Structural Confirmation
- Both buy and sell signals require the breakout/breakdown to be visually confirmed via the movement and steepness (slope) of custom lines that represent price momentum between pivots. Lines are updated or deleted if price fails the required strength, ensuring signals are filtered for validity.
### Alert and Analysis Details
- **Alerts**: Plotted shapes (triangle up for buy, triangle down for sell) can be used for automated alerts, integrating with platform alert conditions for strategy automation.
- **Analysis**: The indicator incorporates logic for cleaning up invalid signals and pruning trendlines when a reversal is detected, increasing reliability of entries and exits for both buy and sell trades.
### Key Settings for Customization
- Lookback period, padding, and color settings allow the user to tune signal frequency and visual appearance according to specific trading needs.
### Summary Table
| Signal Type | Visual Mark | Pivot Reference | Trendline Confirmation | Filtering Logic |
|----------------------|--------------|-----------------|-----------------------|-------------------------------|
| BUY | Triangle Up | Pivot Low | Slope & multi-point | Valid breakout only |
| SELL | Triangle Down| Pivot High | Slope & multi-point | Valid breakdown only |
This approach ensures that only structurally strong breakout-based trades are considered, pruning false signals in real-time for improved consistency in automated or manual trade analysis
Follow me for more updates...
Disclaimer - This post is created for only Learning Purpose. Every Charts, Trade Ideas, Buy & Sell Levels and Updates are Provided For Learning Purpose Only . We Do Not Provide Any Buy And Sell Signals Tips. We are Not SEBI Registered .Do Always Calculate Your risk Before Taking the Trade And consult your Financial Advisor Before taking any Trade. Thank You
Adaptive Trend SelectorThe Adaptive Trend Selector is a comprehensive trend-following tool designed to automatically identify the optimal moving average crossover strategy. It features adjustable parameters and an integrated backtester that delivers institutional-grade insights into the recommended strategy. The model continuously adapts to new data in real time by evaluating multiple moving average combinations, determining the best performing lengths, and presenting the backtest results in a clear, color-coded table that benchmarks performance against the buy-and-hold strategy.
At its core, the model systematically backtests a wide range of moving average combinations to identify the configuration that maximizes the selected optimization metric. Users can choose to optimize for absolute returns or risk-adjusted returns using the Sharpe, Sortino, or Calmar ratios. Alternatively, users can enable manual optimization to test custom fast and slow moving average lengths and view the corresponding backtest results. The label displays the Compounded Annual Growth Rate (CAGR) of the strategy, with the buy-and-hold CAGR in parentheses for comparison. The table presents the backtest results based on the fast and slow lengths displayed at the top:
Sharpe = CAGR per unit of standard deviation.
Sortino = CAGR per unit of downside deviation.
Calmar = CAGR relative to maximum drawdown.
Max DD = Largest peak-to-trough decline in value.
Beta (β) = Return sensitivity relative to buy-and-hold.
Alpha (α) = Excess annualized risk-adjusted returns.
Win Rate = Ratio of profitable trades to total trades.
Profit Factor = Total gross profit per unit of losses.
Expectancy = Average expected return per trade.
Trades/Year = Average number of trades per year.
This indicator is designed with flexibility in mind, enabling users to specify the start date of the backtesting period and the preferred moving average strategy. Supported strategies include the Exponential Moving Average (EMA), Simple Moving Average (SMA), Wilder’s Moving Average (RMA), Weighted Moving Average (WMA), and Volume-Weighted Moving Average (VWMA). To minimize overfitting, users can define constraints such as a minimum and maximum number of trades per year, as well as an optional optimization margin that prioritizes longer, more robust combinations by requiring shorter-length strategies to exceed this threshold. The table follows an intuitive color logic that enables quick performance comparison against buy-and-hold (B&H):
Sharpe = Green indicates better than B&H, while red indicates worse.
Sortino = Green indicates better than B&H, while red indicates worse.
Calmar = Green indicates better than B&H, while red indicates worse.
Max DD = Green indicates better than B&H, while red indicates worse.
Beta (β) = Green indicates better than B&H, while red indicates worse.
Alpha (α) = Green indicates above 0%, while red indicates below 0%.
Win Rate = Green indicates above 50%, while red indicates below 50%.
Profit Factor = Green indicates above 2, while red indicates below 1.
Expectancy = Green indicates above 0%, while red indicates below 0%.
In summary, the Adaptive Trend Selector is a powerful tool designed to help investors make data-driven decisions when selecting moving average crossover strategies. By optimizing for risk-adjusted returns, investors can confidently identify the best lengths using institutional-grade metrics. While results are based on the selected historical period, users should be mindful of potential overfitting, as past results may not persist under future market conditions. Since the model recalibrates to incorporate new data, the recommended lengths may evolve over time.

CloudfareCloudfare - Advanced Market Sentiment Visualization System
What It Does:
Cloudfare is a proprietary market sentiment analysis tool that visualizes real-time money flow and order flow through a dynamic cloud system. Unlike traditional indicators that lag price action, Cloudfare provides forward-looking market sentiment analysis by combining multiple proprietary algorithms.
Core Innovation - Dynamic Cloud Technology:
The cloud system is the primary innovation, not a simple mashup of existing indicators. It uses a proprietary algorithm that:
Analyzes money flow velocity through volume-weighted price action
Calculates institutional order flow patterns using proprietary OBV modifications
Implements a unique "breathing" algorithm that expands/contracts based on market volatility
Uses color-coded transparency to indicate sentiment strength (0-100 scale)
Proprietary Signal Generation:
Higher High/Lower Low Pattern Recognition: Custom algorithm that identifies price breakouts with 3-bar confirmation and volume divergence analysis
Signal Strength Scoring: Proprietary 0-100 scoring system that combines price action, volume surge detection, RSI momentum shifts, and money flow velocity
Dynamic Glow System: Signal brightness adapts to market conditions - brighter signals indicate higher probability setups
Technical Methodology:
Money Flow Analysis: Custom MFI implementation with volume weighting and momentum calculations
Order Flow Tracking: Proprietary OBV modifications that detect institutional accumulation/distribution
Volume Divergence Detection: Unique algorithm that identifies volume patterns not visible in standard indicators
Multi-Factor Confirmation: Combines 5 different confirmation methods to filter false signals
Why This Justifies Closed-Source Protection:
The core algorithms for cloud generation, signal strength calculation, and dynamic glow adaptation are proprietary mathematical models developed over 3 months of testing. These are not simple combinations of existing indicators but original mathematical approaches to market sentiment visualization.
Unique Value Proposition:
Real-time sentiment visualization through the breathing cloud system
Forward-looking signals that anticipate trend changes before price confirmation
Adaptive transparency that changes based on market conditions
Multi-timeframe VWAP integration with proprietary anchoring methodology
How to Use:
Cloud Analysis: Green cloud indicates bullish money flow, red indicates bearish pressure
Diamond Signals: Green diamonds below price for bullish reversals, red diamonds above for bearish
Signal Strength: Brighter diamonds represent higher probability setups
Trend Confirmation: 5-day confirmation system filters noise and false signals
Best Practices:
Works optimally on daily and 4-hour timeframes
Combine with price action analysis for maximum effectiveness
Monitor cloud color changes for early trend shift warnings
Use diamond signals for entry/exit timing
Author's Instructions:
To request access to this invite-only script, please contact me directly through TradingView messaging with your trading experience and intended use case. Access is granted on a case-by-case basis to ensure proper usage and support.

TGFA Flexible Alerts Multi-MA CrossoversTGFA Flexible Alerts, Multi-MA Crossovers
Description
Flexible MA crossovers with BUY/SELL alerts, customizable candle colors, and an info box for ATR/volatility insights. Supports EMA/SMA/HMA/VWAP on any chart.
Overview
TGFA Flexible Alerts is a versatile Pine Script indicator for traders seeking customizable moving average (MA) crossovers, visual signals, and quick-reference metrics. It overlays crossover lines (e.g., fast EMA over slow SMA), generates BUY/SELL labels and alerts, colors candles based on themes, and includes an optional info box with ATR bands, support/resistance, and trend projections. Built for any symbol and timeframe (optimized for 1H intraday), it auto-detects Heikin Ashi charts and handles mixed MA types like responsive HMA with lagging EMAs. All logic uses built-in TA functions for reliability—no repainting on confirmed bars.
Key Features
MA Crossover Engine: Configurable lines (EMA, SMA, HMA, VWAP) with dynamic colors (HMA tints green/red based on slope). Enable/disable via inputs.
Invert Signals Toggle: Flips BUY/SELL logic for mixed MA setups (e.g., HMA as fast line over EMA).
Reasoning: Traditional crossovers assume a fast line (low lag) crossing above a slow line (high lag) for buys. HMA's hull design makes it ultra-responsive, so it may "lead" too aggressively—causing premature signals. Inverting aligns it with user intuition (e.g., HMA dipping below then recovering signals strength), reducing false positives in trending markets. Test on your pairs!
Visual Alerts: BUY/SELL labels at crossover price (with optional price display and offset adjustment).
Single MA Overlays: Independent plots for EMA/SMA/HMA/VWAP (length 0 to hide).
Info Box: Real-time table with current price, ±1/2 ATR bands, median price (over lookback), trend (SMA50 slope), volatility % (ATR normalized), support/resistance (recent highs/lows), and reversal projections (tied to SMA50 pivot for up/down bias).
Candle Coloring: 20+ themes (dark/light canvases) for bull/bear/reversal/low-volume bars—e.g., Emerald Blaze greens uptrends, dims on low vol. Toggle off for no changes.
Chart Source Flexibility: Auto-switches to Heikin Ashi if detected; manual override for Regular/HA.
Alerts fire on crossovers/crossunders (custom messages with ticker/interval). Open-source for forking.
How to Use
Add to Chart: Search in TradingView's public library, apply to any symbol (e.g., stocks, forex). Best on 1H for intraday, but works on daily/weekly too.
Setup Crossovers: Choose Line 1/2 types/lengths (e.g., HMA 9 over SMA 20). Enable "Invert Signals" if using HMA—prevents lag mismatches in volatile assets.
Alerts & Labels: Toggle labels for visuals; set TradingView alerts on "Buy"/"Sell" conditions. Use offset for crowded charts.
Info Box Insights: Enable for quick scans—e.g., enter long near support if trend is bullish and price > median. Adjust ATR length (default 14) for sensitivity.
Candle Themes: Pick a scheme (e.g., Neon Pulse for dark mode); it overrides bar colors without altering data.
Customization Tip: For HMA-heavy setups, invert + short lengths (5-9) catch turns early; pair with volume filter in alerts.
Limitations & Disclaimers - Designed for overlay on price charts; may overlap in tight ranges—adjust transparency via styles.
HMA can repaint intra-bar; signals confirm on close. Not back tested for all assets—validate with strategy tester.
Info box projections use SMA(50) as a trend pivot (same for up/down as reference); customize via code for advanced calcs. Candle colors are cosmetic only.
This is an analysis tool, not advice. Trading involves risk; combine with fundamentals/news. Past performance isn't indicative of future results. No liability for losses.
I'm still a newbie, so feedback encouraged!
Thank you!!
ThisGirl

Multi-Timeframe mybullandbearThis Multi-Timeframe RSI + Ultimate MA System combines RSI and customizable moving averages (SMA, EMA, WMA, HullMA, VWMA, RMA, TEMA) to generate powerful buy/sell signals across 5m, 15m, 1h, and 4h timeframes. Visualize signals with clear chart labels (BUY/SELL) and a multi-timeframe table showing RSI status, MA trends, and signal strength. Ideal for traders seeking trend confirmation and reversal signals.
Enable/disable RSI, MA cross, or combined signals, and adjust MA types/lengths. Use aligned signals across timeframes for stronger entries. Best with backtesting for your asset.
3X Sniper BotThe 3X Sniper Bot is built for traders who demand clarity, precision, and confidence in their decision-making. This tool isn’t just another crossover script—it’s a full multi-confirmation system that helps you spot momentum shifts, identify high-probability entries, and filter out the noise.
🔥 Why traders love it:
Triple confirmation engine: Only fires when multiple conditions align, reducing false signals.
Strong vs. Regular vs. Possible setups: Get nuanced alerts that distinguish between high-conviction moves and early opportunities.
Both Buy & Sell coverage: Stay prepared in any market environment.
Smart flexibility: Works across strict or sequenced signal modes, giving you control over how conservative or aggressive you want to trade.
Visual clarity: Clean chart markers and optional regime shading keep your screen easy to read at a glance.
Alert-ready: Set and forget—never miss a move with real-time TradingView alerts.
This indicator was designed to make complex multi-factor analysis simple, giving traders a clear visual edge without clutter or guesswork. Whether you scalp intraday or swing multi-day, the 3X Sniper Bot adapts to your style.

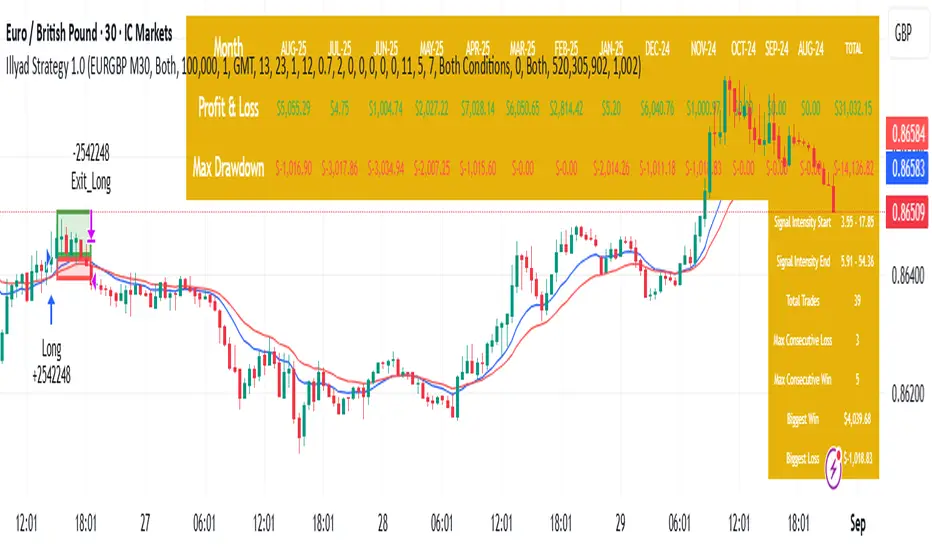
Optimised EURGBP (IC Markets, 30m)Illyad Strategy 1.0 – Optimised EURGBP (IC Markets, 30m)
Description:
This is the Illyad Strategy 1.0 optimised for EURGBP on the 30-minute timeframe (IC Markets feed).
📊 Results (Jan 2024 – Aug 2025):
✅ Total P&L: +£31,032.15 (+31.03%)
📉 Max Drawdown: 2.86% (£3,576.85)
🔁 Total Trades: 39
📈 Win Rate: 58.97%
⚖️ Profit Factor: 2.92
This strategy focuses on controlled drawdown + consistent growth, making it ideal for prop trading challenges and long-term account compounding.
🔧 Optimisation:
Works best on the 30m timeframe.
Each symbol behaves differently — for maximum performance, you should optimise the parameters (MAs, SL/TP, intensity) to the instrument you want to trade.
Example: The EURGBP setup shown here differs from what you’d use on NASDAQ, XAUUSD, or stocks like Tesla.
💡 Best Use Cases:
Passing and scaling prop firm accounts (FTMO, AquaFunded, etc.).
Automated alerts → MT5 integration (hands-free trading).
Consistent, rule-based trading without emotion.
⚠️ Disclaimer:
This script is for educational purposes only. Past results don’t guarantee future performance. Always backtest and forward-test on demo before live trading.
📲 Next Steps:
This version shows the EURGBP optimisation. If you want to run it on other pairs, indices, or stocks → simply optimise parameters for that symbol.
👉 For full automation (TradingView → MT5 execution), check my profile for details.
ADVANCED EMA RIBBON SUITE PRO [Multi-Timeframe + Alerts + Dash]🎯 ADVANCED EMA RIBBON SUITE PRO
📊 DESCRIPTION:
The most comprehensive EMA Ribbon indicator on TradingView, featuring 14 customizable
EMAs (5-200), multi-timeframe analysis, gradient ribbon visualization, smart alerts,
and a real-time dashboard. Perfect for trend following, scalping, and swing trading.
🔥 KEY FEATURES:
• 14 EMAs with Fibonacci sequence option (5, 8, 13, 21, 34, 55, 89, 144, 200)
• Multi-Timeframe (MTF) analysis - see higher timeframe trends
• Dynamic gradient ribbon with trend-based coloring
• Golden Cross & Death Cross detection with alerts
• Professional themes (Dark/Light) with 6 visual styles
• Real-time information dashboard
• Customizable transparency and colors
• Trend strength visualization
• Price position analysis
• Smart alert system for all major crossovers
📈 USE CASES:
• Trend Identification: Ribbon expansion/contraction shows trend strength
• Entry/Exit Signals: EMA crossovers provide clear trade signals
• Support/Resistance: EMAs act as dynamic S/R levels
• Multi-Timeframe Confluence: Combine timeframes for higher probability trades
• Scalping: Use faster EMAs (5-20) for quick trades
• Swing Trading: Focus on 50/200 EMAs for position trades
🎯 TRADING STRATEGIES:
1. Ribbon Squeeze: Trade breakouts when ribbon contracts
2. Golden/Death Cross: Major trend reversals at 50/200 crosses
3. Price Above/Below: Long when price above most EMAs, short when below
4. MTF Confluence: Trade when multiple timeframes align
5. Dynamic S/R: Use EMAs as trailing stop levels
⚡ OPTIMAL SETTINGS:
• Scalping: 5, 8, 13, 21 EMAs on 1-5 min charts
• Day Trading: Full ribbon on 15-60 min charts
• Swing Trading: Focus on 50, 100, 200 EMAs on daily charts
• Position Trading: Use weekly timeframe with monthly MTF
📌 KEYWORDS:
EMA, Exponential Moving Average, Ribbon, Multi-Timeframe, MTF, Golden Cross,
Death Cross, Trend Following, Scalping, Swing Trading, Dashboard, Alerts,
Support Resistance, Fibonacci, Professional, Advanced, Suite, Indicator
*Created using PineCraft AI (Link in Bio)

Multi SMA + Golden/Death + Heatmap + BB**Multi SMA (50/100/200) + Golden/Death + Candle Heatmap + BB**
A practical trend toolkit that blends classic 50/100/200 SMAs with clear crossover labels, special 🚀 Golden / 💀 Death Cross markers, and a readable candle heatmap based on a dynamic regression midline and volatility bands. Optional Bollinger Bands are included for context.
* See trend direction at a glance with SMAs.
* Get minimal, de-cluttered labels on important crosses (50↔100, 50↔200, 100↔200).
* Highlight big regime shifts with special Golden/Death tags.
* Read momentum and volatility with the candle heatmap.
* Add Bollinger Bands if you want classic mean-reversion context.
Designed to be lightweight, non-repainting on confirmed bars, and flexible across timeframes.
# What This Indicator Does (plain English)
* **Tracks trend** using **SMA 50/100/200** and lets you optionally compute each SMA on a higher or different timeframe (HTF-safe, no lookahead).
* **Prints labels** when SMAs cross each other (up or down). You can force signals only after bar close to avoid repaint.
* **Marks Golden/Death Crosses** (50 over/under 200) with special labels so major regime changes stand out.
* **Colors candles** with a **heatmap** built from a regression midline and volatility bands—greenish above, reddish below, with a smooth gradient.
* **Optionally shows Bollinger Bands** (basis SMA + stdev bands) and fills the area between them.
* **Includes alert conditions** for Golden and Death Cross so you can automate notifications.
---
# Settings — Simple Explanations
## Source
* **Source**: Price source used to calculate SMAs and Bollinger basis. Default: `close`.
## SMA 50
* **Show 50**: Turn the SMA(50) line on/off.
* **Length 50**: How many bars to average. Lower = faster but noisier.
* **Color 50** / **Width 50**: Visual style.
* **Timeframe 50**: Optional alternate timeframe for SMA(50). Leave empty to use the chart timeframe.
## SMA 100
* **Show 100**: Turn the SMA(100) line on/off.
* **Length 100**: Bars used for the mid-term trend.
* **Color 100** / **Width 100**: Visual style.
* **Timeframe 100**: Optional alternate timeframe for SMA(100).
## SMA 200
* **Show 200**: Turn the SMA(200) line on/off.
* **Length 200**: Bars used for the long-term trend.
* **Color 200** / **Width 200**: Visual style.
* **Timeframe 200**: Optional alternate timeframe for SMA(200).
## Signals (crossover labels)
* **Show crossover signals**: Prints triangle labels on SMA crosses (50↔100, 50↔200, 100↔200).
* **Wait for bar close (confirmed)**: If ON, signals only appear after the candle closes (reduces repaint).
* **Min bars between same-pair signals**: Minimum spacing to avoid duplicate labels from the same SMA pair too often.
* **Trend filter (buy: 50>100>200, sell: 50<100<200)**: Only show bullish labels when SMAs are stacked bullish (50 above 100 above 200), and only show bearish labels when stacked bearish.
### Label Offset
* **Offset mode**: Choose how to push labels away from price:
* **Percent**: Offset is a % of price.
* **ATR x**: Offset is ATR(14) × multiplier.
* **Percent of price (%)**: Used when mode = Percent.
* **ATR multiplier (for ‘ATR x’)**: Used when mode = ATR x.
### Label Colors
* **Bull color** / **Bear color**: Background of triangle labels.
* **Bull label text color** / **Bear label text color**: Text color inside the triangles.
## Golden / Death Cross
* **Show 🚀 Golden Cross (50↑200)**: Show a special “Golden” label when SMA50 crosses above SMA200.
* **Golden label color** / **Golden text color**: Styling for Golden label.
* **Show 💀 Death Cross (50↓200)**: Show a special “Death” label when SMA50 crosses below SMA200.
* **Death label color** / **Death text color**: Styling for Death label.
## Candle Heatmap
* **Enable heatmap candle colors**: Turns the heatmap on/off.
* **Length**: Lookback for the regression midline and volatility measure.
* **Deviation Multiplier**: Band width around the midline (bigger = wider).
* **Volatility basis**:
* **RMA Range** (smoothed high-low range)
* **Stdev** (standard deviation of close)
* **Upper/Middle/Lower color**: Gradient colors for the heatmap.
* **Heatmap transparency (0..100)**: 0 = solid, 100 = invisible.
* **Force override base candles**: Repaint base candles so heatmap stays visible even if your chart has custom coloring.
## Bollinger Bands (optional)
* **Show Bollinger Bands**: Toggle the overlay on/off.
* **Length**: Basis SMA length.
* **StdDev Multiplier**: Distance of bands from the basis in standard deviations.
* **Basis color** / **Band color**: Line colors for basis and bands.
* **Bands fill transparency**: Opacity of the fill between upper/lower bands.
---
# Features & How It Works
## 1) HTF-Safe SMAs
Each SMA can be calculated on the chart timeframe or a higher/different timeframe you choose. The script pulls HTF values **without lookahead** (non-repainting on confirmed bars).
## 2) Crossover Labels (Three Pairs)
* **50↔100**, **50↔200**, **100↔200**:
* **Triangle Up** label when the first SMA crosses **above** the second.
* **Triangle Down** label when it crosses **below**.
* Optional **Trend Filter** ensures only signals aligned with the overall stack (50>100>200 for bullish, 50<100<200 for bearish).
* **Debounce** spacing avoids repeated labels for the same pair too close together.
## 3) Golden / Death Cross Highlights
* **🚀 Golden Cross**: SMA50 crosses **above** SMA200 (often a longer-term bullish regime shift).
* **💀 Death Cross**: SMA50 crosses **below** SMA200 (often a longer-term bearish regime shift).
* Separate styling so they stand out from regular cross labels.
## 4) Candle Heatmap
* Builds a **regression midline** with **volatility bands**; colors candles by their position inside that channel.
* Smooth gradient: lower side → reddish, mid → yellowish, upper side → greenish.
* Helps you see momentum and “where price sits” relative to a dynamic channel.
## 5) Bollinger Bands (Optional)
* Classic **basis SMA** ± **StdDev** bands.
* Light visual context for mean-reversion and volatility expansion.
## 6) Alerts
* **Golden Cross**: `🚀 GOLDEN CROSS: SMA 50 crossed ABOVE SMA 200`
* **Death Cross**: `💀 DEATH CROSS: SMA 50 crossed BELOW SMA 200`
Add these to your alerts to get notified automatically.
---
# Tips & Notes
* For fewer false positives, keep **“Wait for bar close”** ON, especially on lower timeframes.
* Use the **Trend Filter** to align signals with the broader stack and cut noise.
* For HTF context, set **Timeframe 50/100/200** to higher frames (e.g., H1/H4/D) while you trade on a lower frame.
* Heatmap “Length” and “Deviation Multiplier” control smoothness and channel width—tune for your asset’s volatility.
