Mtf
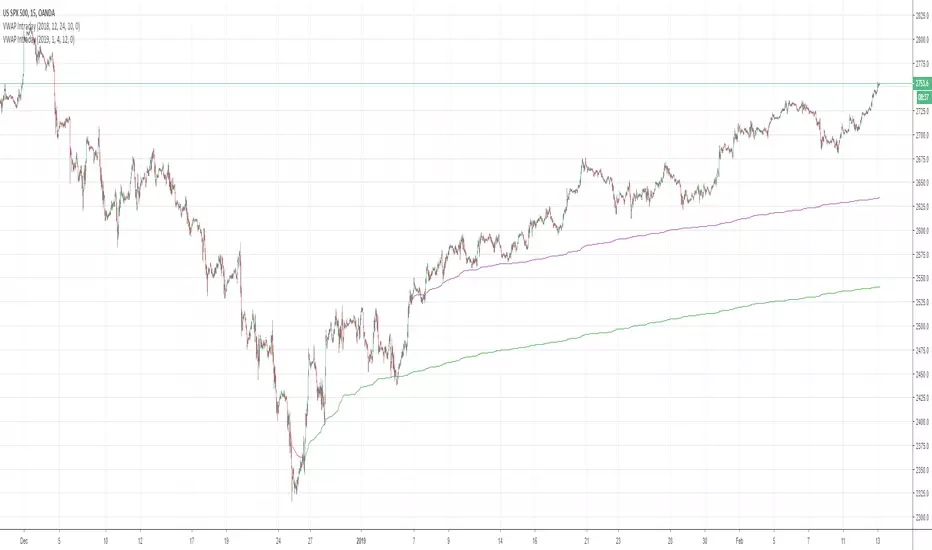
MTF BB Meow Mix [acatwithcharts]This script adds multi-timeframe support to full BB Meow Mix, with the full set of various moving average and stdev calculation types.
There is a tradeoff in that there is, to the best of my knowledge, no way to support both MTF and the default band settings menu in the same script, because the security() function in Pinescipt doesn't support variable lookback lengths and trying to plot everything independently instead maxes out the number of plots allowed per script. So, this version of the script doesn't include a menu of defaults.
My volatility indicators are available by subscription in several packages through SharkCharts.live.
Current pricing and subscription details will be kept up-to-date on SharkCharts.live

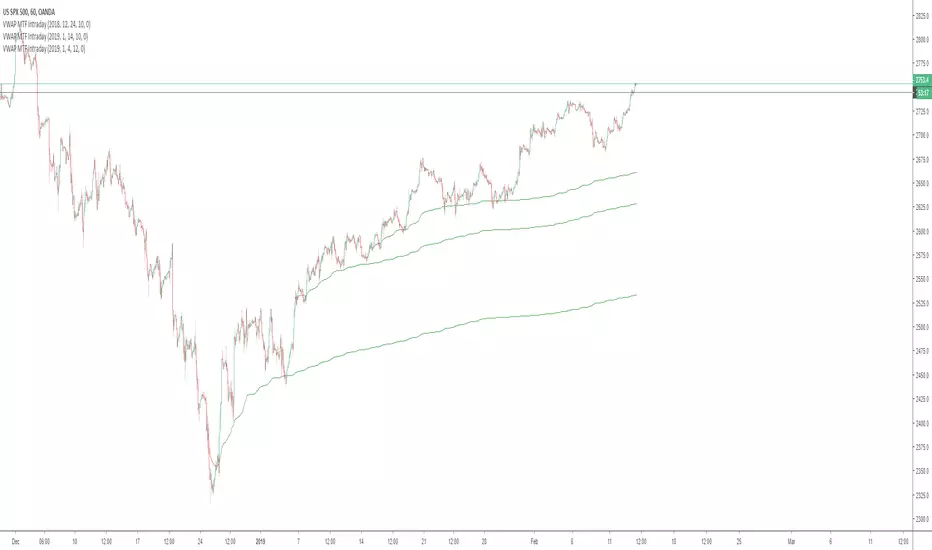
MTF BB Meow Mix (Lite) [acatwithcharts]This script adds multi-timeframe support to BB Meow Mix (Lite).
There is a tradeoff in that there is, to the best of my knowledge, no way to support both MTF and the default band settings menu in the same script, because the security() function in Pinescipt doesn't support variable lookback lengths and trying to plot everything independently instead maxes out the number of plots allowed per script. So, this version of the script doesn't include a menu of defaults.
My volatility indicators are available by subscription in several packages through SharkCharts.live.
Current pricing and subscription details will be kept up-to-date on SharkCharts.live
Alberto - Strategy 1A multi-timeframe strategy developed as a custom service.
Note
This strategy has been published only for customer verification and acceptance. Sorry, I cannot grant access to anyone else.

Bollinger Bands MTF [LonesomeTheBlue]With this script you can follow Bollinger Bands for current and higher time frame together. Higher time frame is calculated by script.
if current period
1m => higher period=5m
3m => higher period=5m
5m => higher period=15m
15m => higher period=1h
30m => higher period=1h
45m => higher period=1h
1h => higher period=4h
2h => higher period=4h
3h => higher period=4h
4h => higher period=1day
1day => higher period=1week

SuperRadu's 3EMA MTF It's EMAx3 using 52,104 and 208 values using 4H lookback candle data to make them more smoothed,clean and easy to understand the trend.

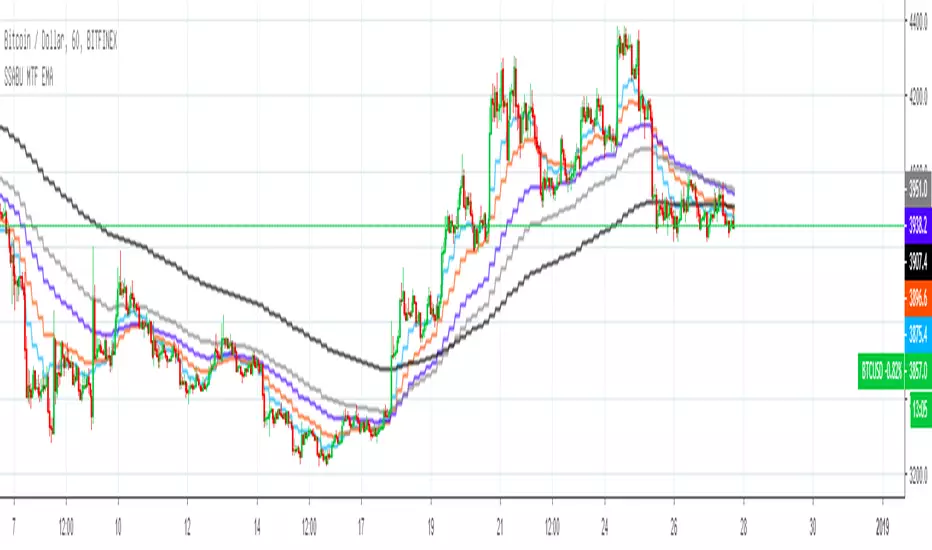
SSABU MTF EMA
✅ MTF EMA (Multi-Time Frame Exponential of Moving Average Line) Indicator.
This indicator is an auxiliary indicator for viewing the exponential moving average of the high frame's span in the low frame's span.
If you set the indicator instead of entering the time directly, you can set 1/3/5/13/30/45 minutes 1/2/3 / hour per day from EMA1 MTF Set (Minute).
The default setting is 4H and the number of horizontal lines is 5.
The screenshot above shows a 4 hour horizon on a 1 hour bar chart.
✅ MTF EMA (멀티 타임 프레임 지수 이동 평균선) 지표입니다.
본 지표는 낮은 프레임의 분봉에서 높은 프레임의 분봉의 지수 이동 평균선을 볼 수 있는 보조지표 입니다.
직접 시간을 입력 하는 건 아니고 지표를 설치하시면 EMA1 MTF Set(Minute)에서 1/3/5/13/30/45분 1/2/3/시간 1일 1주로 설정이 가능합니다.
기본설정은 4H으로 되어있고 이평선갯수는 5개로 구성되어 있습니다.
위의 스크린샷은 1시간봉의 차트에서 4시간의 이평선을 적용한 모습입니다.
✅ 매매에 도움되는 다른 보조지표
Basel ver 2.21
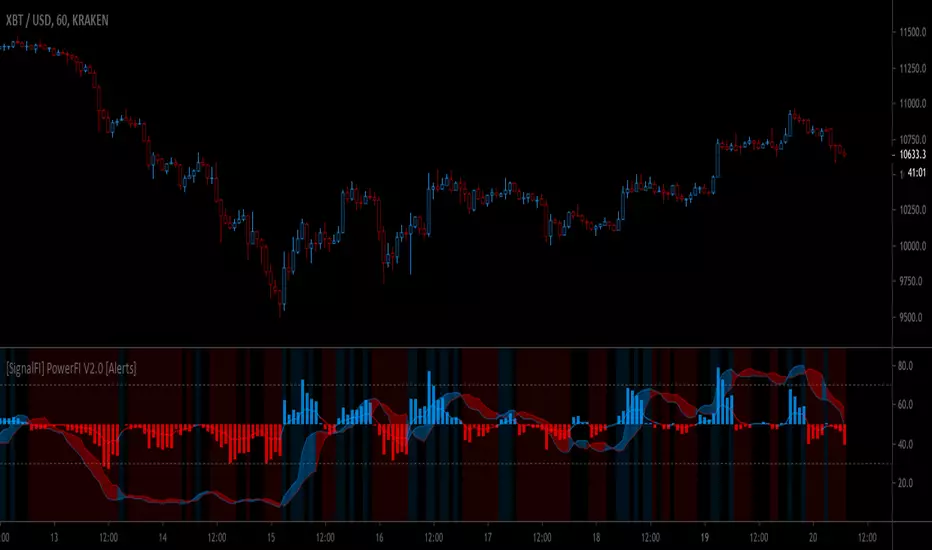
[SignalFI] PowerFI V1.0 [Alerts]PowerFI is a multidimensional RSI that gives you insight into price momentum and trend crossovers via price statistics and rates of change.
MUTLTIPLE-TIMEFRAME RSI
DIFFERENCE STATISTICS COMBINED WITH RSI MOMENTUM
RSI IMPULSE STRENGTH HISTOGRAM
ALERTS VERSION Only for Jedi and Master Subscribers
SignalFI was created to help traders and investors to effectively analyze the market based on the Golden Mean Ratio (Fibonacci numbers), plan a trade and ultimately execute it. To help inform and educate market decisions we developed a set of Trading Indicators which are available on TradingView , the most advanced and yet easy to use charting platform available on the web.
SignalFI indicators are just that, indicators. Our indicators are generally configured to use completely historical data (negating repaint), and we advise all alerts created with SignalFI indicators to be fired upon "close" of the current candle. Our indicators can provide valuable context and visualization support when performing market analysis and executing buy and sell decisions. However. we are not financial experts, and all information presented on this site or our other media outlets are for educational purposes only.
For subscription information, visit www.signalfi.net and follow us on twitter.
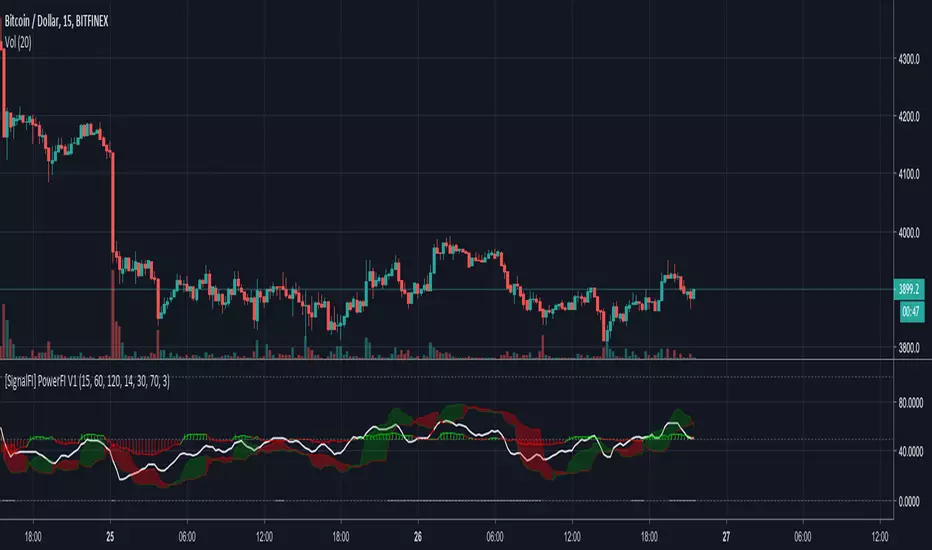
[SignalFI] PowerFI V1PowerFI is a multidimensional RSI that gives you insight into price momentum and trend crossovers via price statistics and rates of change.
MUTLTIPLE-TIMEFRAME RSI
DIFFERENCE STATISTICS COMBINED WITH RSI MOMENTUM
RSI IMPULSE STRENGTH HISTOGRAM
SignalFI was created to help traders and investors to effectively analyze the market based on the Golden Mean Ratio (Fibonacci numbers), plan a trade and ultimately execute it. To help inform and educate market decisions we developed a set of Trading Indicators which are available on TradingView , the most advanced and yet easy to use charting platform available on the web.
SignalFI indicators are just that, indicators. Our indicators are generally configured to use completely historical data (negating repaint), and we advise all alerts created with SignalFI indicators to be fired upon "close" of the current candle. Our indicators can provide valuable context and visualization support when performing market analysis and executing buy and sell decisions. However. we are not financial experts, and all information presented on this site or our other media outlets are for educational purposes only.
For subscription information, visit www.signalfi.net and follow us on twitter.
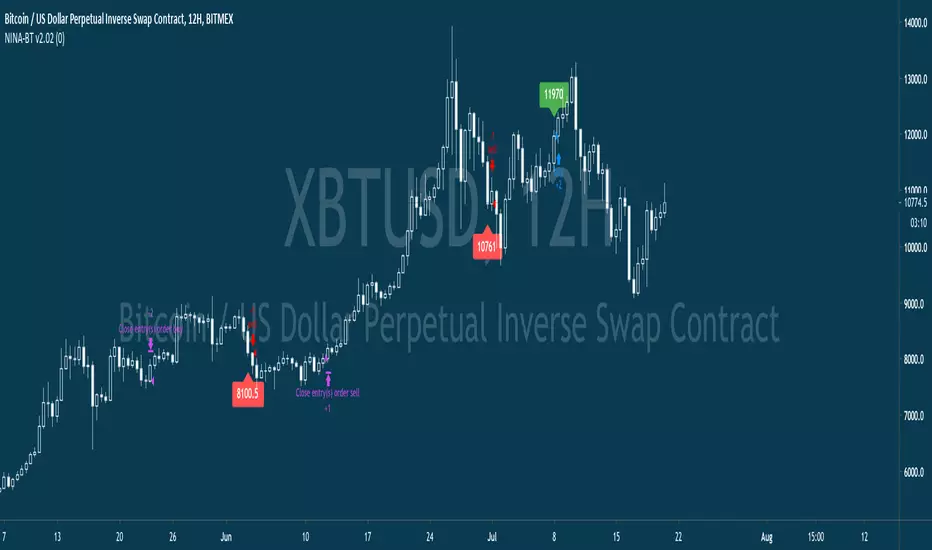
NINA-BTHello Fellow Traders !
KikingAlgo has produced another amazing tool which is now fully operational and ready.
This Algo is called NINA-BT ( Backtesting + Multi Time Frame ) and is based on mathematical formula over 11 timeframes to create trend signals based on the current market conditions.
The Algo can operate on any market, any pair in any timeframe and shows a clear trend direction and strength.
This is a PRO BT version of NINA - drop private message for details.
Regards
KikingAlgo
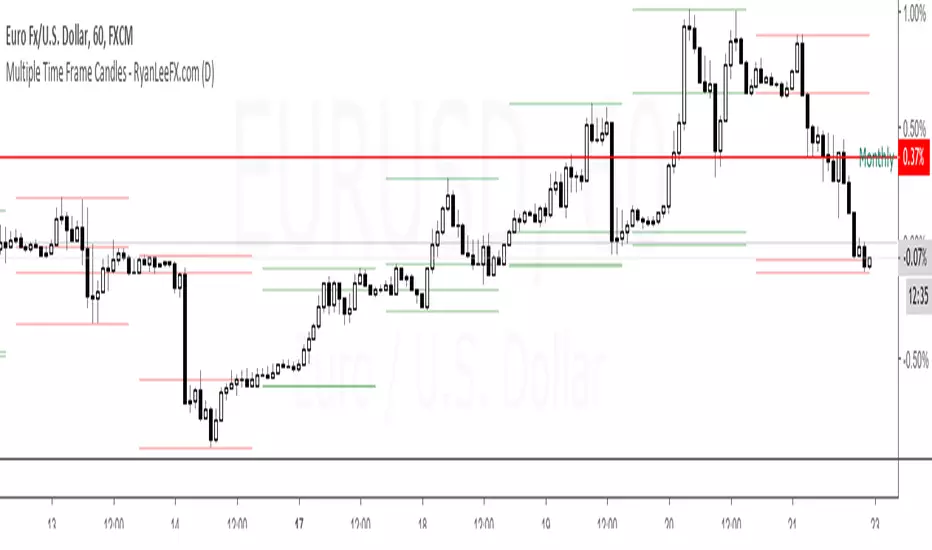
Multiple Time Frame Candles - RyanLeeFX.comMultiple Time Frame Candles is a unique script that allows traders to quickly and easily analyze price action candles across multiple time frames all from one chart. Multiple Time Frame Candles eliminates the need for price action traders to change chart time frames when trying to analyze multiple time frames. With this script, traders can easily see the candles from a lower time frame inside candles from a higher time frame.
For example, traders can see 1 Hour candles inside Daily candles. Or 5 Min candles inside Hourly candles. Or Daily candles inside Weekly candles. Or Hourly candles inside Daily candles inside Weekly candles. The options for comparing multiple time frame candles on one screen are almost limitless.
This script differs from other Multiple Time Frame Candle scripts by displaying the open, high, low and close of the larger time frame candle as well as highlighting the close price due to its proven importance.
The ability to quickly analyze multiple time frames from a single chart will make you more confident in your trades as well as save you valuable time during your analysis.
Multiple Time Frame Candles is also an amazing script to help beginning to experienced traders better visualize price movement across multiple time frames all from a single chart. Happy Trading!!
Trader Set - MTF Reversal Bar SignalsThis is Multi Tile Frame signalling of reversal bar strategy. Using this, you can easily Identify if you had a reversal bar signal in 1,2,3,4,5,10,15, and 30 minute based renko charts.
The more time frames get in sync with each other, the higher possibility for a more powerful signal.
The least you would need is for 1,2 and 3 minutes to have 2 out of 3 of them showing same signal.
Please don't ask for getting access, the licensing will be available for purchase soon in the website and I will announce it in the comment section.

SadLittleThings Price Compare With Offset MTF by RRBSadLittleThings Price Compare With Offset MTF by RagingRocketBull 2018
Version 1.0
This indicator lets you compare multiple assets across different timeframes, supports offsets and alpha multipliers.
Standard TradingView Compare doesn't have Offset/Timeframe/Multiplier options, hence this indicator.
Features:
- compare current asset's price with 2 custom ext OHLC sources
- plot sources as lines/bars/candles
- use offset:
- for lines - both positive/negative offsets, unlimited
- for bars/candles - only positive offsets <= 5000
- specify timeframe for each source
- uses timeframe textbox instead of input resolution dropdown to allow for 240 120 and other custom TFs
- support for timeframes in H: H, 2H, 4H etc
- show/hide sources
- colorize sources
- convert source price to 1000s, mlns, or blns using alpha multiplier
- total bars counter
Notes on using offsets:
- Max offset is defined by study max_bars_back which is limited to 5000 for free accounts. This variable specifies the number of history bars an indicator can access.
- if you see the 'internal server study error' => one of the indexes of ohlc series is out of bounds (i.e. close ) => decrease the offset <= 5000 or switch to line type
- you will be limited only by the total number of bars in history (n) +/- 1 full screen of empty bars
- you can't scroll past the beginning of history - 1 empty screen and past the end of history + 1 empty screen to be able to still see the line with applied offset
- before applying a large offset, scroll back long enough to make sure you have enough history loaded
- if you have a long history the indicator will get slower, its UI less responsive. Reloading the page may fix that.
- you will not see source's history past the beginning of the current asset - open the chart with the longest history first (i.e. BLX, not COINBASE)
- Make sure that the Left Price Scale shows up with Auto Fit Data enabled. You can reattach the indicator to a different scale in Style.
- you may not be able to plot intraday TFs < current TF, because free accounts are limited to TFs >= D1 (i.e. D, 2D, 3D, W), but you can still plot, say, H4+ on a lower TF H1 chart
1. uses plot*, security, change


Trader Set - Modified RSI MTFThis is a modified version of RSI MTF, a similar indicator can be found in public library if anyone is interested, mine, is fabricated to work with my methology with all the addition i will add to this (just like others when i added the ability to change the moving types in critical places of formula) so that students can experiment with them (it will come in next version). also, I normalize both sections for better visualization.
Please don't ask me for getting access. "CM Modified RSI MFI" search it for the base and almost similar indicator without my additions. This script will be available only for my students at the time being. like other scripts, if the learning material will be ready i will be announce in comment section, and like others, again, if i decide to sell this separated from courses i will announce in the comment section too.
yutas_RSI_3-Multi-Time-FrameVer.1.0
The current number of RSI is displayed in 7 stages.
It displays in three types of time frames side by side.
It is a chance of reverse tension when each stage is complete with high numbers.
We will let you know the hot points in the background color.
RSIの現在の数値を7つのステージで表示。
3種類のタイムフレームで並べて表示します。
それぞれのステージが高い数字で揃ったときが逆張りのチャンスです。
熱いポイントには背景色でお知らせします。

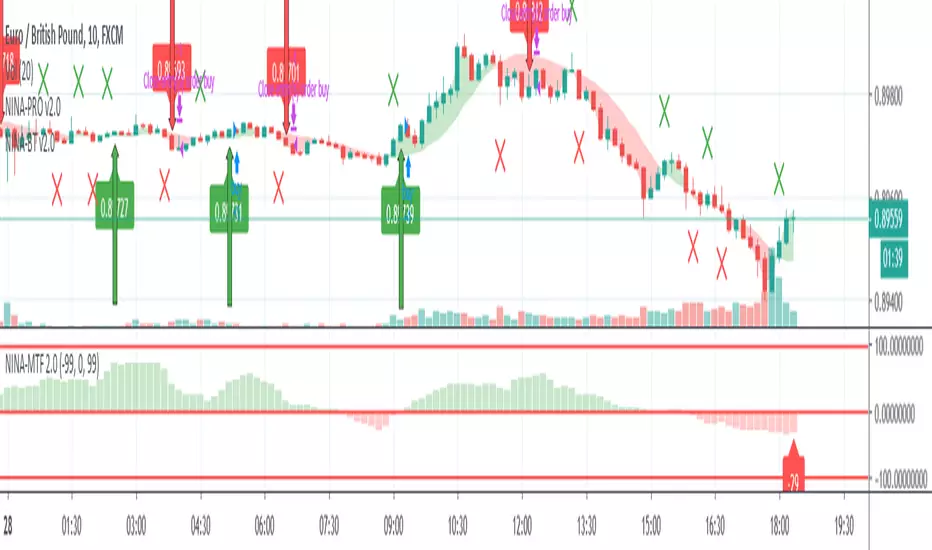
NINA-MTFHello Fellow Traders !
KikingAlgo has produced another amazing tool which is now fully operational and ready.
This Algo is called NINA-MTF (Multi Time Frame) and is based on mathematical formula over 11 timeframes to create trend signals based on the current market conditions.
The Algo can operate on any market, any pair in any timeframe and shows a clear trend direction and strength.
This is a PRO MFT version of NINA - drop private message for details.
Regards
KikingAlgo
Zcash/USD Total VolumesHello traders!
This tool shows you Zcash/USD total trade volumes from the all (well, almost) cryptocurrency exchanges on different timeframes.
Supported timeframes
"1"
"3"
"5"
"10"
"15"
"30"
"45"
"60" - 1 hour
"120" - 2 hours
"180" - 3 hours
"240" - 4 hours
"300" - 5 hours
"360" - 6 hours
"420" - 7 hours
"480" - 8 hours
"540" - 9 hours
"600" - 10 hours
"660" - 11 hours
"720" - 12 hours
"780" - 13 hours
"840" - 14 hours
"900" - 15 hours
"960" - 16 hours
"1020" - 17 hours
"1080" - 18 hours
"1140" - 19 hours
"1200" - 20 hours
"1260" - 21 hours
"1320" - 22 hours
"1380" - 23 hours
"D"
"2D"
"3D"
"W"
"M"
How to get access
Buy for only 20$ to get lifetime access to this indicator
Like and follow for more cool indicators!
Happy Trading!

Monero/USD Total VolumesHello traders!
This tool shows you Monero/USD total trade volumes from the all (well, almost) cryptocurrency exchanges on different timeframes.
Supported timeframes
"1"
"3"
"5"
"10"
"15"
"30"
"45"
"60" - 1 hour
"120" - 2 hours
"180" - 3 hours
"240" - 4 hours
"300" - 5 hours
"360" - 6 hours
"420" - 7 hours
"480" - 8 hours
"540" - 9 hours
"600" - 10 hours
"660" - 11 hours
"720" - 12 hours
"780" - 13 hours
"840" - 14 hours
"900" - 15 hours
"960" - 16 hours
"1020" - 17 hours
"1080" - 18 hours
"1140" - 19 hours
"1200" - 20 hours
"1260" - 21 hours
"1320" - 22 hours
"1380" - 23 hours
"D"
"2D"
"3D"
"W"
"M"
How to get access
Buy for only 20$ to get lifetime access to this indicator
Like and follow for more cool indicators!
Happy Trading!

Litecoin/USD Total VolumesHello traders!
This tool shows you Litecoin/USD total trade volumes from the all (well, almost) cryptocurrency exchanges on different timeframes.
Alerts included.
Supported timeframes
"1"
"3"
"5"
"10"
"15"
"30"
"45"
"60" - 1 hour
"120" - 2 hours
"180" - 3 hours
"240" - 4 hours
"300" - 5 hours
"360" - 6 hours
"420" - 7 hours
"480" - 8 hours
"540" - 9 hours
"600" - 10 hours
"660" - 11 hours
"720" - 12 hours
"780" - 13 hours
"840" - 14 hours
"900" - 15 hours
"960" - 16 hours
"1020" - 17 hours
"1080" - 18 hours
"1140" - 19 hours
"1200" - 20 hours
"1260" - 21 hours
"1320" - 22 hours
"1380" - 23 hours
"D"
"2D"
"3D"
"W"
"M"
How to get access
Buy for only 25$ to get lifetime access to this indicator
Like and follow for more cool indicators!
Happy Trading!

Stellar/USD Total VolumesHello traders!
This tool shows you Stellar/USD total trade volumes from the all (well, almost) cryptocurrency exchanges on different timeframes.
Alerts included.
Supported timeframes
"1"
"3"
"5"
"10"
"15"
"30"
"45"
"60" - 1 hour
"120" - 2 hours
"180" - 3 hours
"240" - 4 hours
"300" - 5 hours
"360" - 6 hours
"420" - 7 hours
"480" - 8 hours
"540" - 9 hours
"600" - 10 hours
"660" - 11 hours
"720" - 12 hours
"780" - 13 hours
"840" - 14 hours
"900" - 15 hours
"960" - 16 hours
"1020" - 17 hours
"1080" - 18 hours
"1140" - 19 hours
"1200" - 20 hours
"1260" - 21 hours
"1320" - 22 hours
"1380" - 23 hours
"D"
"2D"
"3D"
"W"
"M"
How to get access
Buy for only 20$ to get lifetime access to this indicator
Like and follow for more cool indicators!
Happy Trading!
