TMO ScalperTMO - (T)rue (M)omentum (O)scillator) MTF Scalper Version
TMO Scalper is a special custom version of the popular TMO Oscillator. Scalper version was designed specifically for the lower time frames (1-5min intraday scalps). This version prints in the signals directly on top of the oscillator only when the higher aggregations are aligned with the current aggregation (the big wheels must be spinning in order for a small wheel to spin). The scalper consist of three MTF TMO oscillators. First one is the one that plot signals (should be the fastest aggregation), second serves as a short term trend gauge (good rule of thumb is to us 2-5x of the chart time frame or the first aggregation). The third one (optional) is shaded in the background & should only serve as a trend gauge for the day (usually higher time frames 30min+).
Time Frames Preffered by Traders:
1. 1m / 5m / 30m - This one is perfect for catching the fastest moves. However, during choppy days the 1min can produce more false signals..
2. 2m / 10m / 30m - Healthy middle, the 2min aggregation nicely smooths out the 1min mess. Short term gauge is turning slowly (10min for a signal to confirm).
3. 3m / 30m / 60m - This TF is awesome for day traders that prefer to take it slow. Obviously, this combination will produce far less signals during the day.
Hope it helps.
Mtfanalysis

MTF TMOTMO - (T)rue (M)omentum (O)scillator) MTF (Higher Aggregation) Version
TMO calculates momentum using the DELTA of price. Giving a much better picture of the trend, reversals & divergences than most momentum oscillators using price. Aside from the regular TMO, this study combines four different TMO aggregations into one indicator for an even better picture of the trend. Once you look deeper into this study you will realize how complex this tool is. This version also produce much more information like crosses, divergences, overbought / oversold signals, higher aggregation fades etc. It is probably not even possible to explain them all, there could easily be an entire e-book about this study.
I have been using this tool for a couple of years now, and this is what i have learned so far:
Favorite Time Frame Variations:
1. 1m / 5m / 30m - Great for intraday futures or options scalps. 30m TMO serves as the overall trend gauge for the day. 5min dictates the longer term intraday moves as well as direction of the 1min. 1min is for the scalps. When the 5min TMO is sloping higher focus should be on 1min buy signals (red to green cross) and vice versa for the 5min agg. sloping down.
2. 5m / 30m / 60m - Also an interesting variation for day trading the 3-5 min charts. Producing more cleaner & beginner-friendly signals that lasts couple of minutes instead of seconds.
3. 120m / Day / 2 Day - For the 30m to 1H or 2H timeframes. Daily & 2 Day dictates the overall trend. 120 min for the signals. Great for a multi-day swings.
4. Day / 2 Day / Week - Good for the daily charts, swing trading analysis as the weekly dictates the overall trend, daily dictates the signals and the 2 day cleans out the daily signals. If the daily & 2 day are not aligned togather, daily signal means nothing. Weekly dictates 2 day - 2 day dictates daily.
5. Week / Month / 3 Month - Same thing as the previous variation but for the weekly charts.
TMO Length:
The default vanilla settings are 14,5,3. Some traders prefer 21,5,3 as the TMO length is litle higher = TMO will potenially last little longer which could teoretically produce less false signals but slower crosses which means signals will lag more behind price. The lower the length, the faster the oscillator oscillates. It is the noice vs. the lag debate. The Length can be changed, but i would not personally touch the other two. Few points up or down on length will not drastically change much. But changes on Calc Length and Smooth Length can produce totally different signals from the original.
Tips & Tricks:
1. Observe
- This is the best tip & trick I can give you. The #1 best way to learn how any study operates is to just observe how it works in certain situations from the past. MTF TMO is not
an exception.
2. The Power of the Higher Aggregation
- The higher aggregation ALWAYS dictates the lower one. Best way to see this? Just 2x the current timeframe aggregation = so on daily chart, plot the daily & two day TMOs and you will notice how the higher agg. smooths out the current agg. The higher the aggregation is, the smoother (but slower) will the TMO turn. The real power kicks in when the 3 or 4 aggregations are aligned togather in one direction.
3. Position of the Higher Aggregation in Relation to the Extremes
- Overbought / oversold signals might not really work on the current aggregation. But pay attention to the higher aggregations in relation to the extremes. Ex: on the daily chart - daily TMO inside the OB / OS extremes might not mean much. But once the higher aggregations such as 3 day or Weekly TMO enters OB/OS zone togather with the daily, this can be a very powerful signal for a TMO reversion to the zeroline.
4. Crosses
- Yes, crosses do work. Personally, I never really focused on them. The thing about the crosses is that it is crucial to pick the right higher aggregation to the combination of the current one that would be reliable but also print enough signals. The closer the cross is to the OB / OS extremes, the more bigger move can occur. Crosses around the zero line can be considered as less quality crosses.
5. Divergences
- TMO can print awesome divergences. The best divergences are on the current aggregation (TMO agg. same as the chart) since the current agg. oscillates fast, it can usually produce lower lows & higher highs faster then any higher aggregations. Easy setup: wait for the higher aggregation to reach the OB / OS extremes and watch the current (chart) aggregation to print a divergence.
6. Three is Enough
- I personally find more than three aggregations messy and hard to read. But there is always the option to turn on the 4th one. Just switch the TMO 4 Main, TMO 4 Signal and TMO 4 Fill in the style settings.
Hope it helps.

MTFA - Multi Time Frame Analysis - Moving AveragesThis indicator will help you make better informed trading decisions by showing higher time frame moving averages overlaid on a single chart. You can customise 4 moving averages.
MFTA - Multi Timeframe AnalysisThis indicator plots moving averages from higher timeframes for increasing the probability of a successful trade without using multiple charts for the same ticker.
You can configure the desired higher timeframe (i.e. if you are using a 1 min chart you can plot the 5 Min time frame moving averages).
HTF Candles: 3x Multi-Timeframe Candle Boxes #Pip-Whisperer
- Modify 3 Timeframes to display Candle Boxes over your Chart
- Thats it.
- Enjoy!
- If anyone implements candlestick pattern detection to this before me, please send me link, that would be sick!

Multiple Moving Avg MTF TableThis script replaces the other script that was just the SMAs that where in a Multi Time Frame Table as this was a redo of that one and this one is SO MUCH MORE!!!!
Not only does this one do the Simple Moving Avg 5, 10, 20, 50, 120, 200 into a table that shows Current/Hourly/Daily/Weekly/Monthly/Quarterly ( 3M )/ Yearly. It now does Exponential Moving Avg , Weighted Moving Avg , and Volume Weight Moving Avg along with Simple Moving Avg.
I still use this script so that you can quickly capture the values so that short-term, and long-term resistance and support can be determined during market hours. Even better now you can select between SMA / EMA / WMA /or VWMA .
imgur.com
The table will change to the values based on the Choice of the type of Moving Avg and if you change the default values.
Now it will take a little bit for the table to show up, so please be patient. I have tested it with stocks, forex, and crypto.

+ Multi-timeframe Multiple Moving Average LinesThis is a pretty simple script that plots lines for various moving averages (what I think are the most commonly used across all markets) of varying lengths of timeframes of the user's choosing. Timeframes range from 5 minutes up to one month, so regardless if you're a scalper or a swing trader there should be something here for you.
There are 8 lines (that can be turned on/off individually), which may seem like a lot, but if you use two averages and want to display four different timeframes for each, you can do that. The nice thing is that because the lines start plotting from the current bar they won't clutter up the screen. And obviously having moving averages from different timeframes on your chart makes price action more difficult to read (I mean sure, you can make them invisible, but who wants to do that all the time).
For each line there are two labels. One with the moving average type, and the other with its specific timeframe. I can't include the moving average length because it's not a string input. If anyone has a workaround for this, let me know, otherwise I would simply recommend setting different colors depending on the length, or if you only use one or two lengths and one or two moving averages this shouldn't be an issue. I had to use two labels because for the label text I couldn't include more than one string input, this is why there is an input for the 'moving average type label distance.'' You will want to adjust this depending on if you are trading crypto, futures, or forex because in some cases there may still be label overlap.
Pretty much everything else is self-explanatory.
I've added alerts. I might need to modify them if I can, because it would be nice for them to state the name and timeframe of the moving average. But I think this will do for now.
Enjoy!

[BM] HTF Candle Evolution█ OVERVIEW
This script shows how a higher timeframe candle evolves over time.
It was created as a visual aid to #TheStrat and provides a new way of looking at Timeframe Continuity.
█ FEATURES
General
HTF: Higher Timeframe selection with dropdown and ability to manually input a timeframe that is not present in the dropdown.
Label: Show a label with the selected higher timeframe.
Marker: Shows a marker symbol at the start of each new higher timeframe.
Align: Aligns the candles around a selected center line.
The Strat
Multi-timeframe analysis is used extensively in #TheStrat (created by Rob Smith), so the ability to add #TheStrat coloring has been made available.
Scenario: Define the colors for the strat scenario's.
Coloring of: Choose which part of the candles you want the selected strat scenario colors to be applied to.
Band: Display a band that shows the active strat scenario color of the selected higher timeframe.
All features are completely customizable.

Liquidity Heatmap LTF [LuxAlgo]This indicator displays column heatmaps highlighting candle bodies with the highest associated volume from a lower user selected timeframe.
Settings
LTF Timeframe: Lower timeframe used to retrieve the closing/opening price and volume data. Must be lower than the current chart timeframe.
Other settings control the style of the displayed graphical elements.
Usage
It can be of interest to show which candles from a lower timeframe had the highest associated volume, this allows for the highlighting of areas where a candle body was the most traded by market participants.
The area with the highest activity is highlighted in the script with a yellow color (or another user selected color) and additionally by two lines forming an interval.
When the candle body with the highest volume is overlapped by a candle body with lower volume this one will be highlighted instead, hence why certain areas of high activity might not be highlighted by the heatmap.
It is recommended to hide regular candles or use a more discrete graphical presentation of prices when using this tool. Lines are also displayed to highlight the full candle range as well as if a candle was bullish (in green) or bearish (in red). These lines can be hidden if the user is only interested in the heatmap.

RSI5+RSI9+RSI14 EMA [MTF - Multi Time Frame] Zero54This indicator has a fast RSI (RSI 5). Slower RSI (RSI 9) and a smoothened RSI14 EMA. When both RSI5 and RSI9 are above the RSI14 EMA, then the trend is bullish. When both RSI5 and RSI9 are below the RSI14 EMA, then the trend is bearish. This indicator also shows you the trend in upto 6 time frames! This MTF analysis gives you the conviction to take or skip the trade. Inspired by the concept taught by @AsitPati
The numbers you see in the MTF grid is the RS14 EMA for the respective time frame.
Hope you find this useful. Comments and feedback welcome. Like this if you find this useful.
NSE:HINDUNILVR

MME MTF CCIHi All,
This is a Dual/Multi TF CCI script to be used for Intraday as well as positional system.
Intraday:
Chart TF : 5 mins
Underlying Trend CCI : CCI 34 of 30 mins TF
Immediate Trend CCI : CCI 34 of 5 mins TF
Execution CCI : CCI 8 of 5 mins TF
The CCIs are used for entry, exit during momentum breakouts or pullbacks.
General Long Setup:
Buy at CCI-8 5m below -135, when CCI-34 30 mins is > +100. Long exit when CCI 34 5 min < -60
General Short Setup:
Sell at CCI-8 5m above -135, when CCI-34 30 mins is < -100. Short exit when CCI 34 5 min > +60
The same CCI settings can be used for positional or investment per appropriate timeframes one is interested to trade, along with HTF above in ratio 1:5.
Hope its helpful!

[blackcat] L2 FArden Thomas Voting With Multiple TimeframesLevel 2
Background
For Traders’ Tips of November 2020, the focus is F. Arden Thomas’ article in the August 2020 issue, “Voting With Multiple Timeframes”.
Function
F. Arden Thomas sums up the returns by a stochastic indicator in a voting process over seven different timeframes, and uses the resulting votes for trade signals. He shows us a new way of using the classic stochastic oscillator by combining many timeframes into a single value by voting. By using this voting process, buy and sell signals derived from many intervals become clearly visible on the chart. This is an interesting concept that can be applied to many common indicators such as the RSI or ADX, not just the stochastic.
Although the author creates a voting system by counting the number of times the indicator is in overbought/oversold range, I thought it would be interesting to create a composite indicator by averaging the stochastic value over multiple timeframes into a single indicator that moves along the standard scale.
Remarks
Maroon~ Red color bars for bullish market.
Teal~ Green color bars for bearish market.
This is a Level 2 free and open source indicator.
Feedbacks are appreciated.

RSI MTF Ob+OsHello Traders,
This indicator use the same concept as my previous indicator "CCI MTF Ob+Os".
It is a simple "Relative Strength Index" ( RSI ) indicator with multi-timeframe (MTF) overbought and oversold level.
It can detect overbought and oversold level up to 5 timeframes, which help traders spot potential reversal point more easily.
There are options to select 1-5 timeframes to detect overbought and oversold.
Aqua Background is "Oversold" , looking for "Long".
Orange Background is "Overbought" , looking for "Short".
Have fun :)

CCI MTF Ob+OsHello Traders,
This is a simple Commodity Channel Index (CCI) indicator with multi-timeframe (MTF) overbought and oversold level.
It can detect overbought and oversold level up to 5 timeframes, which help traders spot potential reversal point more easily.
There are options to select 1-5 timeframes to detect overbought and oversold.
Green Background is "Oversold" , looking for "Long".
Red Background is "Overbought" , looking for "Short".
Have fun :)

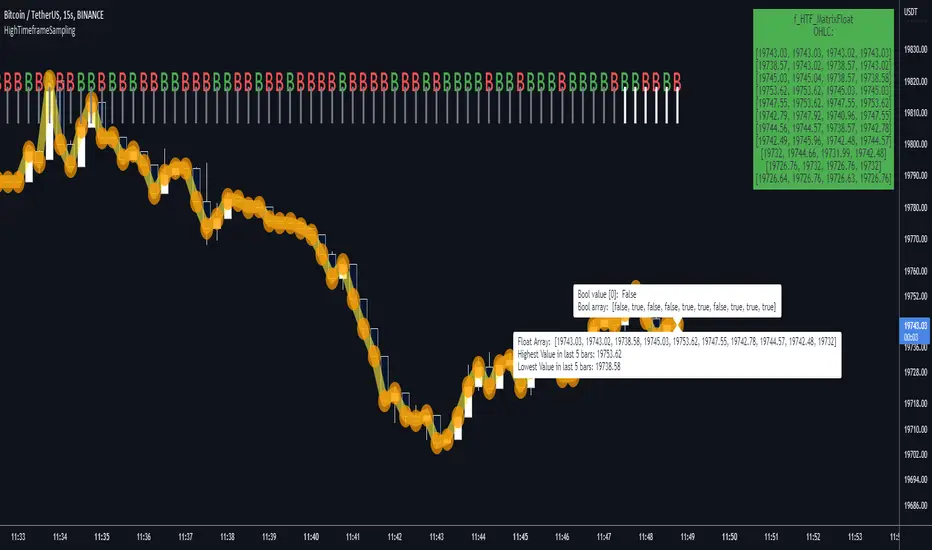
HighTimeframeSamplingLibrary "HighTimeframeSampling"
Library for sampling high timeframe (HTF) data. Returns an array of historical values, an arbitrary historical value, or the highest/lowest value in a range, spending a single security() call.
An optional pass-through for the chart timeframe is included. Other than that case, the data is fixed and does not alter over the course of the HTF bar. It behaves consistently on historical and elapsed realtime bars.
The first version returns floating-point numbers only. I might extend it if there's interest.
🙏 Credits: This library is (yet another) attempt at a solution of the problems in using HTF data that were laid out by Pinecoders - to whom, especially to Luc F, many thanks are due - in "security() revisited" - which I recommend you consult first. Go ahead, I'll wait.
All code is my own.
~~~~~~~~~~~~~~~~~~~~~~~~~~~~~~~~~~~~~~~~~~~~~~~~~~~~~~~~~~~~~~~~~~~~
WHAT'S THE PROBLEM? OR, WHY NOT JUST USE SECURITY()
~~~~~~~~~~~~~~~~~~~~~~~~~~~~~~~~~~~~~~~~~~~~~~~~~~~~~~~~~~~~~~~~~~~~
There are many difficulties with using HTF data, and many potential solutions. It's not really possible to convey it only in words: you need to see it on a chart.
Before using this library, please refer to my other HTF library, HighTimeframeTiming: which explains it extensively, compares many different solutions, and demonstrates (what I think are) the advantages of using this very library, namely, that it's stable, accurate, versatile and inexpensive. Then if you agree, come back here and choose your function.
~~~~~~~~~~~~~~~~~~~~~~~~~~~~~~~~~~~~~~~~~~~~~~~~~~~~~~~~~~~~~~~~~~~~
MOAR EXPLANATION
~~~~~~~~~~~~~~~~~~~~~~~~~~~~~~~~~~~~~~~~~~~~~~~~~~~~~~~~~~~~~~~~~~~~
🧹 Housekeeping: To see which plot is which, turn line labels on: Settings > Scales > Indicator Name Label. Vertical lines at the top of the chart show the open of a HTF bar: grey for historical and white for real-time bars.
‼ LIMITATIONS: To avoid strange behaviour, use this library on liquid assets and at chart timeframes high enough to reliably produce updates at least once per bar period.
A more conventional and universal limitation is that the library does not offer an unlimited view of historical bars. You need to define upfront how many HTF bars you want to store. Very large numbers might conceivably run into data or performance issues.
~~~~~~~~~~~~~~~~~~~~~~~~~~~~~~~~~~~~~~~~~~~~~~~~~~~~~~~~~~~~~~~~~~~~
BRING ON THE FUNCTIONS
~~~~~~~~~~~~~~~~~~~~~~~~~~~~~~~~~~~~~~~~~~~~~~~~~~~~~~~~~~~~~~~~~~~~
@function f_HTF_Value(string _HTF, float _source, int _arrayLength, int _HTF_Offset, bool _useLiveDataOnChartTF=false)
Returns a floating-point number from a higher timeframe, with a historical operator within an abitrary (but limited) number of bars.
@param string _HTF is the string that represents the higher timeframe. It must be in a format that the request.security() function recognises. The input timeframe cannot be lower than the chart timeframe or an error is thrown.
@param float _source is the source value that you want to sample, e.g. close, open, etc., or you can use any floating-point number.
@param int _arrayLength is the number of HTF bars you want to store and must be greater than zero. You can't go back further in history than this number of bars (minus one, because the current/most recent available bar is also stored).
@param int _HTF_Offset is the historical operator for the value you want to return. E.g., if you want the most recent fixed close, _source=close and _HTF_Offset = 0. If you want the one before that, _HTF_Offset=1, etc.
The number of HTF bars to look back must be zero or more, and must be one less than the number of bars stored.
@param bool _useLiveDataOnChartTF uses live data on the chart timeframe.
If the higher timeframe is the same as the chart timeframe, store the live value (i.e., from this very bar). For all truly higher timeframes, store the fixed value (i.e., from the previous bar).
The default is to use live data for the chart timeframe, so that this function works intuitively, that is, it does not fix data unless it has to (i.e., because the data is from a higher timeframe).
This means that on default settings, on the chart timeframe, it matches the raw source values from security(){0}.
You can override this behaviour by passing _useLiveDataOnChartTF as false. Then it will fix all data for all timeframes.
@returns a floating-point value that you requested from the higher timeframe.
@function f_HTF_Array(string _HTF, float _source, int _arrayLength, bool _useLiveDataOnChartTF=false, int _startIn, int _endIn)
Returns an array of historical values from a higher timeframe, starting with the current bar. Optionally, returns a slice of the array. The array is in reverse chronological order, i.e., index 0 contains the most recent value.
@param string _HTF is the string that represents the higher timeframe. It must be in a format that the request.security() function recognises. The input timeframe cannot be lower than the chart timeframe or an error is thrown.
@param float _source is the source value that you want to sample, e.g. close, open, etc., or you can use any floating-point number.
@param int _arrayLength is the number of HTF bars you want to keep in the array.
@param bool _useLiveDataOnChartTF uses live data on the chart timeframe.
If the higher timeframe is the same as the chart timeframe, store the live value (i.e., from this very bar). For all truly higher timeframes, store the fixed value (i.e., from the previous bar).
The default is to use live data for the chart timeframe, so that this function works intuitively, that is, it does not fix data unless it has to (i.e., because the data is from a higher timeframe).
This means that on default settings, on the chart timeframe, it matches raw source values from security().
You can override this behaviour by passing _useLiveDataOnChartTF as false. Then it will fix all data for all timeframes.
@param int _startIn is the array index to begin taking a slice. Must be at least one less than the length of the array; if out of bounds it is corrected to 0.
@param int _endIn is the array index BEFORE WHICH to end the slice. If the ending index of the array slice would take the slice past the end of the array, it is corrected to the end of the array. The ending index of the array slice must be greater than or equal to the starting index. If the end is less than the start, the whole array is returned. If the starting index is the same as the ending index, an empty array is returned. If either the starting or ending index is negative, the entire array is returned (which is the default behaviour; this is effectively a switch to bypass the slicing without taking up an extra parameter).
@returns an array of HTF values.
@function f_HTF_Highest(string _HTF="", float _source, int _arrayLength, bool _useLiveDataOnChartTF=true, int _rangeIn)
Returns the highest value within a range consisting of a given number of bars back from the most recent bar.
@param string _HTF is the string that represents the higher timeframe. It must be in a format that the request.security() function recognises. The input timeframe cannot be lower than the chart timeframe or an error is thrown.
@param float _source is the source value that you want to sample, e.g. close, open, etc., or you can use any floating-point number.
@param int _arrayLength is the number of HTF bars you want to store and must be greater than zero. You can't have a range greater than this number.
@param bool _useLiveDataOnChartTF uses live data on the chart timeframe.
If the higher timeframe is the same as the chart timeframe, store the live value (i.e., from this very bar). For all truly higher timeframes, store the fixed value (i.e., from the previous bar).
The default is to use live data for the chart timeframe, so that this function works intuitively, that is, it does not fix data unless it has to (i.e., because the data is from a higher timeframe).
This means that on default settings, on the chart timeframe, it matches raw source values from security().
You can override this behaviour by passing _useLiveDataOnChartTF as false. Then it will fix all data for all timeframes.
@param _rangeIn is the number of bars to include in the range of bars from which we want to find the highest value. It is NOT the historical operator of the last bar in the range. The range always starts at the current bar. A value of 1 doesn't make much sense but the function will generously return the only value it can anyway. A value less than 1 doesn't make sense and will return an error. A value that is higher than the number of stored values will be corrected to equal the number of stored values.
@returns a floating-point number representing the highest value in the range.
@function f_HTF_Lowest(string _HTF="", float _source, int _arrayLength, bool _useLiveDataOnChartTF=true, int _rangeIn)
Returns the lowest value within a range consisting of a given number of bars back from the most recent bar.
@param string _HTF is the string that represents the higher timeframe. It must be in a format that the request.security() function recognises. The input timeframe cannot be lower than the chart timeframe or an error is thrown.
@param float _source is the source value that you want to sample, e.g. close, open, etc., or you can use any floating-point number.
@param int _arrayLength is the number of HTF bars you want to store and must be greater than zero. You can't go back further in history than this number of bars (minus one, because the current/most recent available bar is also stored).
@param bool _useLiveDataOnChartTF uses live data on the chart timeframe.
If the higher timeframe is the same as the chart timeframe, store the live value (i.e., from this very bar). For all truly higher timeframes, store the fixed value (i.e., from the previous bar).
The default is to use live data for the chart timeframe, so that this function works intuitively, that is, it does not fix data unless it has to (i.e., because the data is from a higher timeframe).
This means that on default settings, on the chart timeframe, it matches raw source values from security().
You can override this behaviour by passing _useLiveDataOnChartTF as false. Then it will fix all data for all timeframes.
@param _rangeIn is the number of bars to include in the range of bars from which we want to find the highest value. It is NOT the historical operator of the last bar in the range. The range always starts at the current bar. A value of 1 doesn't make much sense but the function will generously return the only value it can anyway. A value less than 1 doesn't make sense and will return an error. A value that is higher than the number of stored values will be corrected to equal the number of stored values.
@returns a floating-point number representing the lowest value in the range.
Smarter SNR (Support and Ressistance, Trendline, MTF OSC)Built with love "Smarter SNR (Support and Ressistance, Trendline, MTF OSC) "
This indiator will show you Support & Ressistance, Good Trendline, and Multi-timeframe analyzing of Oscillator (Stochastic and RSI)
You can combine with your own strategy, or use this purely
DISCLAIMER :
Measure the risk first before use it in real market
Backtest The Strategy was very important, so you know the probability
Fundamentally Logical :
SNR -> Last 3 Zigzag Pivot
Trendline -> Using two last pivot for calculating the slope
Features :
1. SNR
2. Trendline
3. MTF Oscillator Analyzing
How to use it :
1. All Label, Table & Line can be turned on/off in settings
2. Pivot Period can be Adjusted in settings
3. All Label, Table & Line style can be adjusted in settings
Regards,
Hanabil

+ %UMAIf you are familiar with the %B for use with Bollinger Bands, then you will understand this indicator immediately.
Designed for use with my +UMA moving average, this works in exactly the same way, with a few differences.
First off, as you can choose on which type of moving average the calculations are made, so too you will want to match this up with the one you are using. That of course goes for the standard deviation as well (just like you would with Bollinger Bands and %B). Here, because the +UMA uses highs and lows to create a sort of moving average channel, and then also to create the bands, I've opted to set the inner part of the bands as the extreme edge that the %UMA equates with the upper and lower lines.
I've added a moving average, donchian channels, and auto-plotted divergences as well, if you like. Typical color related stuff that I do. Alerts for everything.
Hope you like it!
The above image is comparing two of the same indicator, but based on different moving averages, and how it might plot divergences differently between the two.

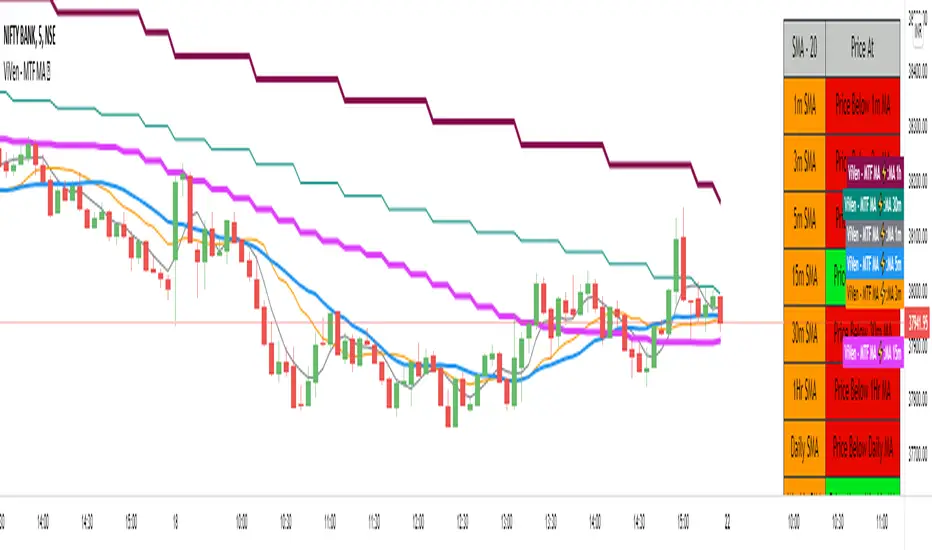
ViVen - Multi Time Frame - Moving Average StrategyHi Traders,
Indicator Description : Multiple Time Frame Moving Average lines in One Chart.
Moving Average Types : SMA, WMA, EMA
Moving Average Period : 20 Default (Variable up to 200)
MA Time Frame : 1m, 3m, 5m, 15m, 30m, 1Hr, Daily, Weekly, Monthly (All lines in one chart)
You can turn ON/OFF the moving average lines based on your requirement.
Moving Average Table : The table will give you an idea where the price is currently trading (LTP), if the price is above any of the moving average then it will show you the Price is above MA and wise versa.
Trading Method:
Monthly, Weekly, Daily and 1Hr Moving averages will tell you whether the script is in Bullish Trend or Bearish Trend.
Basically the moving averages will act as Support and Resistance Levels. With candle confirmation you can take trade.
Ready to Take Position - When 1m MA Crosses 3m MA (Upside / Downside)
BUY Strategy:
"Buy" - when 3m MA breaks 5m moving average on the upside. (Intraday/Scalp)
"Hold" - when 5m MA breaks 15m MA on the upside.
"Strong Hold" - when 15m MA breaks 1Hr MA on the upside for Long term.
"Exit" - when 3m MA breaks 5m MA on the Downside.
SELL Strategy:
"Sell" - when 3m MA breaks 5m moving average on the Downside. (Intraday/Scalp)
"Hold" - when 5m MA breaks 15m MA on the Downside. (Intraday)
"Strong Hold" - when 15m MA breaks 1Hr MA on the Downside. (Positional).
"Exit" - when 3m MA breaks 5m MA on the Downside.
If you agree with this strategy and works well please like this script, share it with your friends and Follow me for more Indicators.
In the next Version, I will come up with Strategy table that I have explained here.
Thanks for your support.
No Duplicates Interval Range & EQGenerates Range & EQ levels and removes duplicates. Prioritizes by higher timeframe for duplicates. For example, on Monday's open, weekly open is displayed while daily open is hidden automatically.

Indicators OverlayHello All,
This script shows the indicators in separate windows on the main chart. Included indicators are RSI, CCI, OBV, Stochastic, Money Flow Index, Average True Range and Chande Momentum Oscillator. indicator windows are located at the top or bottom of the chart according to last moves of the Closing price. Different colors are used for each indicator. Horizontal levels are shown as dashed line and label as well.
Using the options;
You can enable/disable the indicators you want to see or not
You can change source and length for each indicator
You can set window length. using this length indicator windows are located on the chart
After you added this indicator to your chart I recommend: right click on any of the indicator windows => "Visual Order" => "Bring to front" as seen screenshot below:
in this example only 3 indicators enabled and period is set as 80:
indicator windows moves to the top or bottom of the chart according to the close price:
P.S. if you want to see any other indicator in the options then leave a comment under the indicator ;)
Enjoy!
