Dskyz (DAFE) Aurora Divergence – Quant Master Dskyz (DAFE) Aurora Divergence – Quant Master
Introducing the Dskyz (DAFE) Aurora Divergence – Quant Master , a strategy that’s your secret weapon for mastering futures markets like MNQ, NQ, MES, and ES. Born from the legendary Aurora Divergence indicator, this fully automated system transforms raw divergence signals into a quant-grade trading machine, blending precision, risk management, and cyberpunk DAFE visuals that make your charts glow like a neon skyline. Crafted with care and driven by community passion, this strategy stands out in a sea of generic scripts, offering traders a unique edge to outsmart institutional traps and navigate volatile markets.
The Aurora Divergence indicator was a cult favorite for spotting price-OBV divergences with its aqua and fuchsia orbs, but traders craved a system to act on those signals with discipline and automation. This strategy delivers, layering advanced filters (z-score, ATR, multi-timeframe, session), dynamic risk controls (kill switches, adaptive stops/TPs), and a real-time dashboard to turn insights into profits. Whether you’re a newbie dipping into futures or a pro hunting reversals, this strat’s got your back with a beginner guide, alerts, and visuals that make trading feel like a sci-fi mission. Let’s dive into every detail and see why this original DAFE creation is a must-have.
Why Traders Need This Strategy
Futures markets are a battlefield—fast-paced, volatile, and riddled with institutional games that can wipe out undisciplined traders. From the April 28, 2025 NQ 1k-point drop to sneaky ES slippage, the stakes are high. Meanwhile, platforms are flooded with unoriginal, low-effort scripts that promise the moon but deliver noise. The Aurora Divergence – Quant Master rises above, offering:
Unmatched Originality: A bespoke system built from the ground up, with custom divergence logic, DAFE visuals, and quant filters that set it apart from copycat clutter.
Automation with Precision: Executes trades on divergence signals, eliminating emotional slip-ups and ensuring consistency, even in chaotic sessions.
Quant-Grade Filters: Z-score, ATR, multi-timeframe, and session checks filter out noise, targeting high-probability reversals.
Robust Risk Management: Daily loss and rolling drawdown kill switches, plus ATR-based stops/TPs, protect your capital like a fortress.
Stunning DAFE Visuals: Aqua/fuchsia orbs, aurora bands, and a glowing dashboard make signals intuitive and charts a work of art.
Community-Driven: Evolved from trader feedback, this strat’s a labor of love, not a recycled knockoff.
Traders need this because it’s a complete, original system that blends accessibility, sophistication, and style. It’s your edge to trade smarter, not harder, in a market full of traps and imitators.
1. Divergence Detection (Core Signal Logic)
The strategy’s core is its ability to detect bullish and bearish divergences between price and On-Balance Volume (OBV), pinpointing reversals with surgical accuracy.
How It Works:
Price Slope: Uses linear regression over a lookback (default: 9 bars) to measure price momentum (priceSlope).
OBV Slope: OBV tracks volume flow (+volume if price rises, -volume if falls), with its slope calculated similarly (obvSlope).
Bullish Divergence: Price slope negative (falling), OBV slope positive (rising), and price above 50-bar SMA (trend_ma).
Bearish Divergence: Price slope positive (rising), OBV slope negative (falling), and price below 50-bar SMA.
Smoothing: Requires two consecutive divergence bars (bullDiv2, bearDiv2) to confirm signals, reducing false positives.
Strength: Divergence intensity (divStrength = |priceSlope * obvSlope| * sensitivity) is normalized (0–1, divStrengthNorm) for visuals.
Why It’s Brilliant:
- Divergences catch hidden momentum shifts, often exploited by institutions, giving you an edge on reversals.
- The 50-bar SMA filter aligns signals with the broader trend, avoiding choppy markets.
- Adjustable lookback (min: 3) and sensitivity (default: 1.0) let you tune for different instruments or timeframes.
2. Filters for Precision
Four advanced filters ensure signals are high-probability and market-aligned, cutting through the noise of volatile futures.
Z-Score Filter:
Logic: Calculates z-score ((close - SMA) / stdev) over a lookback (default: 50 bars). Blocks entries if |z-score| > threshold (default: 1.5) unless disabled (useZFilter = false).
Impact: Avoids trades during extreme price moves (e.g., blow-off tops), keeping you in statistically safe zones.
ATR Percentile Volatility Filter:
Logic: Tracks 14-bar ATR in a 100-bar window (default). Requires current ATR > 80th percentile (percATR) to trade (tradeOk).
Impact: Ensures sufficient volatility for meaningful moves, filtering out low-volume chop.
Multi-Timeframe (HTF) Trend Filter:
Logic: Uses a 50-bar SMA on a higher timeframe (default: 60min). Longs require price > HTF MA (bullTrendOK), shorts < HTF MA (bearTrendOK).
Impact: Aligns trades with the bigger trend, reducing counter-trend losses.
US Session Filter:
Logic: Restricts trading to 9:30am–4:00pm ET (default: enabled, useSession = true) using America/New_York timezone.
Impact: Focuses on high-liquidity hours, avoiding overnight spreads and erratic moves.
Evolution:
- These filters create a robust signal pipeline, ensuring trades are timed for optimal conditions.
- Customizable inputs (e.g., zThreshold, atrPercentile) let traders adapt to their style without compromising quality.
3. Risk Management
The strategy’s risk controls are a masterclass in balancing aggression and safety, protecting capital in volatile markets.
Daily Loss Kill Switch:
Logic: Tracks daily loss (dayStartEquity - strategy.equity). Halts trading if loss ≥ $300 (default) and enabled (killSwitch = true, killSwitchActive).
Impact: Caps daily downside, crucial during events like April 27, 2025 ES slippage.
Rolling Drawdown Kill Switch:
Logic: Monitors drawdown (rollingPeak - strategy.equity) over 100 bars (default). Stops trading if > $1000 (rollingKill).
Impact: Prevents prolonged losing streaks, preserving capital for better setups.
Dynamic Stop-Loss and Take-Profit:
Logic: Stops = entry ± ATR * multiplier (default: 1.0x, stopDist). TPs = entry ± ATR * 1.5x (profitDist). Longs: stop below, TP above; shorts: vice versa.
Impact: Adapts to volatility, keeping stops tight but realistic, with TPs targeting 1.5:1 reward/risk.
Max Bars in Trade:
Logic: Closes trades after 8 bars (default) if not already exited.
Impact: Frees capital from stagnant trades, maintaining efficiency.
Kill Switch Buffer Dashboard:
Logic: Shows smallest buffer ($300 - daily loss or $1000 - rolling DD). Displays 0 (red) if kill switch active, else buffer (green).
Impact: Real-time risk visibility, letting traders adjust dynamically.
Why It’s Brilliant:
- Kill switches and ATR-based exits create a safety net, rare in generic scripts.
- Customizable risk inputs (maxDailyLoss, dynamicStopMult) suit different account sizes.
- Buffer metric empowers disciplined trading, a DAFE signature.
4. Trade Entry and Exit Logic
The entry/exit rules are precise, filtered, and adaptive, ensuring trades are deliberate and profitable.
Entry Conditions:
Long Entry: bullDiv2, cooldown passed (canSignal), ATR filter passed (tradeOk), in US session (inSession), no kill switches (not killSwitchActive, not rollingKill), z-score OK (zOk), HTF trend bullish (bullTrendOK), no existing long (lastDirection != 1, position_size <= 0). Closes shorts first.
Short Entry: Same, but for bearDiv2, bearTrendOK, no long (lastDirection != -1, position_size >= 0). Closes longs first.
Adaptive Cooldown: Default 2 bars (cooldownBars). Doubles (up to 10) after a losing trade, resets after wins (dynamicCooldown).
Exit Conditions:
Stop-Loss/Take-Profit: Set per trade (ATR-based). Exits on stop/TP hits.
Other Exits: Closes if maxBarsInTrade reached, ATR filter fails, or kill switch activates.
Position Management: Ensures no conflicting positions, closing opposites before new entries.
Built To Be Reliable and Consistent:
- Multi-filtered entries minimize false signals, a stark contrast to basic scripts.
- Adaptive cooldown prevents overtrading, especially after losses.
- Clean position handling ensures smooth execution, even in fast markets.
5. DAFE Visuals
The visuals are a DAFE hallmark, blending function with clean flair to make signals intuitive and charts stunning.
Aurora Bands:
Display: Bands around price during divergences (bullish: below low, bearish: above high), sized by ATR * bandwidth (default: 0.5).
Colors: Aqua (bullish), fuchsia (bearish), with transparency tied to divStrengthNorm.
Purpose: Highlights divergence zones with a glowing, futuristic vibe.
Divergence Orbs:
Display: Large/small circles (aqua below for bullish, fuchsia above for bearish) when bullDiv2/bearDiv2 and canSignal. Labels show strength (0–1).
Purpose: Pinpoints entries with eye-catching clarity.
Gradient Background:
Display: Green (bullish), red (bearish), or gray (neutral), 90–95% transparent.
Purpose: Sets the market mood without clutter.
Strategy Plots:
- Stop/TP Lines: Red (stops), green (TPs) for active trades.
- HTF MA: Yellow line for trend context.
- Z-Score: Blue step-line (if enabled).
- Kill Switch Warning: Red background flash when active.
What Makes This Next-Level?:
- Visuals make complex signals (divergences, filters) instantly clear, even for beginners.
- DAFE’s unique aesthetic (orbs, bands) sets it apart from generic scripts, reinforcing originality.
- Functional plots (stops, TPs) enhance trade management.
6. Metrics Dashboard
The top-right dashboard (2x8 table) is your command center, delivering real-time insights.
Metrics:
Daily Loss ($): Current loss vs. day’s start, red if > $300.
Rolling DD ($): Drawdown vs. 100-bar peak, red if > $1000.
ATR Threshold: Current percATR, green if ATR exceeds, red if not.
Z-Score: Current value, green if within threshold, red if not.
Signal: “Bullish Div” (aqua), “Bearish Div” (fuchsia), or “None” (gray).
Action: “Consider Buying”/“Consider Selling” (signal color) or “Wait” (gray).
Kill Switch Buffer ($): Smallest buffer to kill switch, green if > 0, red if 0.
Why This Is Important?:
- Consolidates critical data, making decisions effortless.
- Color-coded metrics guide beginners (e.g., green action = go).
- Buffer metric adds transparency, rare in off-the-shelf scripts.
7. Beginner Guide
Beginner Guide: Middle-right table (shown once on chart load), explains aqua orbs (bullish, buy) and fuchsia orbs (bearish, sell).
Key Features:
Futures-Optimized: Tailored for MNQ, NQ, MES, ES with point-value adjustments.
Highly Customizable: Inputs for lookback, sensitivity, filters, and risk settings.
Real-Time Insights: Dashboard and visuals update every bar.
Backtest-Ready: Fixed qty and tick calc for accurate historical testing.
User-Friendly: Guide, visuals, and dashboard make it accessible yet powerful.
Original Design: DAFE’s unique logic and visuals stand out from generic scripts.
How to Use
Add to Chart: Load on a 5min MNQ/ES chart in TradingView.
Configure Inputs: Adjust instrument, filters, or risk (defaults optimized for MNQ).
Monitor Dashboard: Watch signals, actions, and risk metrics (top-right).
Backtest: Run in strategy tester to evaluate performance.
Live Trade: Connect to a broker (e.g., Tradovate) for automation. Watch for slippage (e.g., April 27, 2025 ES issues).
Replay Test: Use bar replay (e.g., April 28, 2025 NQ drop) to test volatility handling.
Disclaimer
Trading futures involves significant risk of loss and is not suitable for all investors. Past performance is not indicative of future results. Backtest results may not reflect live trading due to slippage, fees, or market conditions. Use this strategy at your own risk, and consult a financial advisor before trading. Dskyz (DAFE) Trading Systems is not responsible for any losses incurred.
Backtesting:
Frame: 2023-09-20 - 2025-04-29
Fee Typical Range (per side, per contract)
CME Exchange $1.14 – $1.20
Clearing $0.10 – $0.30
NFA Regulatory $0.02
Firm/Broker Commis. $0.25 – $0.80 (retail prop)
TOTAL $1.60 – $2.30 per side
Round Turn: (enter+exit) = $3.20 – $4.60 per contract
Final Notes
The Dskyz (DAFE) Aurora Divergence – Quant Master isn’t just a strategy—it’s a movement. Crafted with originality and driven by community passion, it rises above the flood of generic scripts to deliver a system that’s as powerful as it is beautiful. With its quant-grade logic, DAFE visuals, and robust risk controls, it empowers traders to tackle futures with confidence and style. Join the DAFE crew, light up your charts, and let’s outsmart the markets together!
(This publishing will most likely be taken down do to some miscellaneous rule about properly displaying charting symbols, or whatever. Once I've identified what part of the publishing they want to pick on, I'll adjust and repost.)
Use it with discipline. Use it with clarity. Trade smarter.
**I will continue to release incredible strategies and indicators until I turn this into a brand or until someone offers me a contract.
Created by Dskyz, powered by DAFE Trading Systems. Trade fast, trade bold.
Multitimeframe

Dskyz (DAFE) AI Adaptive Regime - Beginners VersionDskyz (DAFE) AI Adaptive Regime - Pro: Revolutionizing Trading for All
Introduction
In the fast-paced world of financial markets, traders need tools that can keep up with ever-changing conditions while remaining accessible. The Dskyz (DAFE) AI Adaptive Regime - Pro is a groundbreaking TradingView strategy that delivers advanced, AI-driven trading capabilities to everyday traders. Available on TradingView (TradingView Scripts), this Pine Script strategy combines sophisticated market analysis with user-friendly features, making it a standout choice for both novice and experienced traders.
Core Functionality
The strategy is built to adapt to different market regimes—trending, ranging, volatile, or quiet—using a robust set of technical indicators, including:
Moving Averages (MA): Fast and slow EMAs to detect trend direction.
Average True Range (ATR): For dynamic stop-loss and volatility assessment.
Relative Strength Index (RSI) and MACD: Multi-timeframe confirmation of momentum and trend.
Average Directional Index (ADX): To identify trending markets.
Bollinger Bands: For assessing volatility and range conditions.
Candlestick Patterns: Recognizes patterns like bullish engulfing, hammer, and double bottoms, confirmed by volume spikes.
It generates buy and sell signals based on a scoring system that weighs these indicators, ensuring trades align with the current market environment. The strategy also includes dynamic risk management with ATR-based stops and trailing stops, as well as performance tracking to optimize future trades.
What Sets It Apart
The Dskyz (DAFE) AI Adaptive Regime - Pro distinguishes itself from other TradingView strategies through several unique features, which we compare to common alternatives below:
| Feature | Dskyz (DAFE) | Typical TradingView Strategies|
|---------|-------------|------------------------------------------------------------|
| Regime Detection | Automatically identifies and adapts to **four** market regimes | Often static or limited to trend/range detection |
| Multi‑Timeframe Analysis | Uses higher‑timeframe RSI/MACD for confirmation | Rarely incorporates multi‑timeframe data |
| Pattern Recognition | Detects candlestick patterns **with volume confirmation** | Limited or no pattern recognition |
| Dynamic Risk Management | ATR‑based stops and trailing stops | Often uses fixed stops or basic risk rules |
| Performance Tracking | Adjusts thresholds based on past performance | Typically static parameters |
| Beginner‑Friendly Presets | Aggressive, Conservative, Optimized profiles | Requires manual parameter tuning |
| Visual Cues | Color‑coded backgrounds for regimes | Basic or no visual aids |
The Dskyz strategy’s ability to integrate regime detection, multi-timeframe analysis, and user-friendly presets makes it uniquely versatile and accessible, addressing the needs of everyday traders who want professional-grade tools without the complexity.
-Key Features and Benefits
[Why It’s Ideal for Everyday Traders
⚡The Dskyz (DAFE) AI Adaptive Regime - Pro democratizes advanced trading by offering professional-grade tools in an accessible package. Unlike many TradingView strategies that require deep technical knowledge or fail in changing market conditions, this strategy simplifies complex analysis while maintaining robustness. Its presets and visual aids make it easy for beginners to start, while its adaptive features and performance tracking appeal to advanced traders seeking an edge.
🔄Limitations and Considerations
Market Dependency: Performance varies by market and timeframe. Backtesting is essential to ensure compatibility with your trading style.
Learning Curve: While presets simplify use, understanding regimes and indicators enhances effectiveness.
No Guaranteed Profits: Like all strategies, success depends on market conditions and proper execution. The Reddit discussion highlights skepticism about TradingView strategies’ universal success (Reddit Discussion).
Instrument Specificity: Optimized for futures (e.g., ES, NQ) due to fixed tick values. Test on other instruments like stocks or forex to verify compatibility.
📌Conclusion
The Dskyz (DAFE) AI Adaptive Regime - Pro is a revolutionary TradingView strategy that empowers everyday traders with advanced, AI-driven tools. Its ability to adapt to market regimes, confirm signals across timeframes, and manage risk dynamically. sets it apart from typical strategies. By offering beginner-friendly presets and visual cues, it makes sophisticated trading accessible without sacrificing power. Whether you’re a novice looking to trade smarter or a pro seeking a competitive edge, this strategy is your ticket to mastering the markets. Add it to your chart, backtest it, and join the elite traders leveraging AI to dominate. Trade like a boss today! 🚀
Use it with discipline. Use it with clarity. Trade smarter.
**I will continue to release incredible strategies and indicators until I turn this into a brand or until someone offers me a contract.
-Dskyz

Dskyz (DAFE) MAtrix with ATR-Powered Precision Dskyz (DAFE) MAtrix with ATR-Powered Precision
This cutting‐edge futures trading strategy built to thrive in rapidly changing market conditions. Developed for high-frequency futures trading on instruments such as the CME Mini MNQ, this strategy leverages a matrix of sophisticated moving averages combined with ATR-based filters to pinpoint high-probability entries and exits. Its unique combination of adaptable technical indicators and multi-timeframe trend filtering sets it apart from standard strategies, providing enhanced precision and dynamic responsiveness.
imgur.com
Core Functional Components
1. Advanced Moving Averages
A distinguishing feature of the DAFE strategy is its robust, multi-choice moving averages (MAs). Clients can choose from a wide array of MAs—each with specific strengths—in order to fine-tune their trading signals. The code includes user-defined functions for the following MAs:
imgur.com
Hull Moving Average (HMA):
The hma(src, len) function calculates the HMA by using weighted moving averages (WMAs) to reduce lag considerably while smoothing price data. This function computes an intermediate WMA of half the specified length, then a full-length WMA, and finally applies a further WMA over the square root of the length. This design allows for rapid adaptation to price changes without the typical delays of traditional moving averages.
Triple Exponential Moving Average (TEMA):
Implemented via tema(src, len), TEMA uses three consecutive exponential moving averages (EMAs) to effectively cancel out lag and capture price momentum. The final formula—3 * (ema1 - ema2) + ema3—produces a highly responsive indicator that filters out short-term noise.
Double Exponential Moving Average (DEMA):
Through the dema(src, len) function, DEMA calculates an EMA and then a second EMA on top of it. Its simplified formula of 2 * ema1 - ema2 provides a smoother curve than a single EMA while maintaining enhanced responsiveness.
Volume Weighted Moving Average (VWMA):
With vwma(src, len), this MA accounts for trading volume by weighting the price, thereby offering a more contextual picture of market activity. This is crucial when volume spikes indicate significant moves.
Zero Lag EMA (ZLEMA):
The zlema(src, len) function applies a correction to reduce the inherent lag found in EMAs. By subtracting a calculated lag (based on half the moving average window), ZLEMA is exceptionally attuned to recent price movements.
Arnaud Legoux Moving Average (ALMA):
The alma(src, len, offset, sigma) function introduces ALMA—a type of moving average designed to be less affected by outliers. With parameters for offset and sigma, it allows customization of the degree to which the MA reacts to market noise.
Kaufman Adaptive Moving Average (KAMA):
The custom kama(src, len) function is noteworthy for its adaptive nature. It computes an efficiency ratio by comparing price change against volatility, then dynamically adjusts its smoothing constant. This results in an MA that quickly responds during trending periods while remaining smoothed during consolidation.
Each of these functions—integrated into the strategy—is selectable by the trader (via the fastMAType and slowMAType inputs). This flexibility permits the tailored application of the MA most suited to current market dynamics and individual risk management preferences.
2. ATR-Based Filters and Risk Controls
ATR Calculation and Volatility Filter:
The strategy computes the Average True Range (ATR) over a user-defined period (atrPeriod). ATR is then used to derive both:
Volatility Assessment: Expressed as a ratio of ATR to closing price, ensuring that trades are taken only when volatility remains within a safe, predefined threshold (volatilityThreshold).
ATR-Based Entry Filters: Implemented as atrFilterLong and atrFilterShort, these conditions ensure that for long entries the price is sufficiently above the slow MA and vice versa for shorts. This acts as an additional confirmation filter.
Dynamic Exit Management:
The exit logic employs a dual approach:
Fixed Stop and Profit Target: Stops and targets are set at multiples of ATR (fixedStopMultiplier and profitTargetATRMult), helping manage risk in volatile markets.
Trailing Stop Adjustments: A trailing stop is calculated using the ATR multiplied by a user-defined offset (trailOffset), which captures additional profits as the trade moves favorably while protecting against reversals.
3. Multi-Timeframe Trend Filtering
The strategy enhances its signal reliability by leveraging a secondary, higher timeframe analysis:
15-Minute Trend Analysis:
By retrieving 15-minute moving averages (fastMA15m and slowMA15m) via request.security, the strategy determines the broader market trend. This secondary filter (enabled or disabled through useTrendFilter) ensures that entries are aligned with the prevailing market direction, thereby reducing the incidence of false signals.
4. Signal and Execution Logic
Combined MA Alignment:
The entry conditions are based primarily on the alignment of the fast and slow MAs. A long condition is triggered when the current price is above both MAs and the fast MA is above the slow MA—complemented by the ATR filter and volume conditions. The reverse applies for a short condition.
Volume and Time Window Validation:
Trades are permitted only if the current volume exceeds a minimum (minVolume) and the current hour falls within the predefined trading window (tradingStartHour to tradingEndHour). An additional volume spike check (comparing current volume to a moving average of past volumes) further filters for optimal market conditions.
Comprehensive Order Execution:
The strategy utilizes flexible order execution functions that allow pyramiding (up to 10 positions), ensuring that it can scale into positions as favorable conditions persist. The use of both market entries and automated exits (with profit targets, stop-losses, and trailing stops) ensures that risk is managed at every step.
5. Integrated Dashboard and Metrics
For transparency and real-time analysis, the strategy includes:
On-Chart Visualizations:
Both fast and slow MAs are plotted on the chart, making it easy to see the market’s technical foundation.
Dynamic Metrics Dashboard:
A built-in table displays crucial performance statistics—including current profit/loss, equity, ATR (both raw and as a percentage), and the percentage gap between the moving averages. These metrics offer immediate insight into the health and performance of the strategy.
Input Parameters: Detailed Breakdown
Every input is meticulously designed to offer granular control:
Fast & Slow Lengths:
Determine the window size for the fast and slow moving averages. Smaller values yield more sensitivity, while larger values provide a smoother, delayed response.
Fast/Slow MA Types:
Choose the type of moving average for fast and slow signals. The versatility—from basic SMA and EMA to more complex ones like HMA, TEMA, ZLEMA, ALMA, and KAMA—allows customization to fit different market scenarios.
ATR Parameters:
atrPeriod and atrMultiplier shape the volatility assessment, directly affecting entry filters and risk management through stop-loss and profit target levels.
Trend and Volume Filters:
Inputs such as useTrendFilter, minVolume, and the volume spike condition help confirm that a trade occurs in active, trending markets rather than during periods of low liquidity or market noise.
Trading Hours:
Restricting trade execution to specific hours (tradingStartHour and tradingEndHour) helps avoid illiquid or choppy markets outside of prime trading sessions.
Exit Strategies:
Parameters like trailOffset, profitTargetATRMult, and fixedStopMultiplier provide multiple layers of risk management and profit protection by tailoring how exits are generated relative to current market conditions.
Pyramiding and Fixed Trade Quantity:
The strategy supports multiple entries within a trend (up to 10 positions) and sets a predefined trade quantity (fixedQuantity) to maintain consistent exposure and risk per trade.
Dashboard Controls:
The resetDashboard input allows for on-the-fly resetting of performance metrics, keeping the strategy’s performance dashboard accurate and up-to-date.
Why This Strategy is Truly Exceptional
Multi-Faceted Adaptability:
The ability to switch seamlessly between various moving average types—each suited to particular market conditions—enables the strategy to adapt dynamically. This is a testament to the high level of coding sophistication and market insight infused within the system.
Robust Risk Management:
The integration of ATR-based stops, profit targets, and trailing stops ensures that every trade is executed with well-defined risk parameters. The system is designed to mitigate unexpected market swings while optimizing profit capture.
Comprehensive Market Filtering:
By combining moving average crossovers with volume analysis, volatility thresholds, and multi-timeframe trend filters, the strategy only enters trades under the most favorable conditions. This multi-layered filtering reduces noise and enhances signal quality.
-Final Thoughts-
The Dskyz Adaptive Futures Elite (DAFE) MAtrix with ATR-Powered Precision strategy is not just another trading algorithm—it is a multi-dimensional, fully customizable system built on advanced technical principles and sophisticated risk management techniques. Every function and input parameter has been carefully engineered to provide traders with a system that is both powerful and transparent.
For clients seeking a state-of-the-art trading solution that adapts dynamically to market conditions while maintaining strict discipline in risk management, this strategy truly stands in a class of its own.
****Please show support if you enjoyed this strategy. I'll have more coming out in the near future!!
-Dskyz
Caution
DAFE is experimental, not a profit guarantee. Futures trading risks significant losses due to leverage. Backtest, simulate, and monitor actively before live use. All trading decisions are your responsibility.

Heiken Ashi Supertrend ADX - StrategyHeiken Ashi Supertrend ADX Strategy
Overview
This strategy combines the power of Heiken Ashi candles, Supertrend indicator, and ADX filter to identify strong trend movements across multiple timeframes. Designed primarily for the cryptocurrency market but adaptable to any tradable asset, this system focuses on capturing momentum in established trends while employing a sophisticated triple-layer stop loss mechanism to protect capital and secure profits.
Strategy Mechanics
Entry Signals
The strategy uses a unique blend of technical signals to identify high-probability trade entries:
Heiken Ashi Candles: Looks specifically for Heiken Ashi candles with minimal or no wicks, which signal strong momentum and trend continuation. These "full-bodied" candles represent periods where price moved decisively in one direction with minimal retracement.
Supertrend Filter : Confirms the underlying trend direction using the Supertrend indicator (default factor: 3.0, ATR period: 10). Entries are aligned with the prevailing Supertrend direction.
ADX Filter (Optional) : Can be enabled to focus only on stronger trending conditions, filtering out choppy or ranging markets. When enabled, trades only trigger when ADX is above the specified threshold (default: 25).
Exit Signals
Positions are closed when either:
An opposing signal appears (Heiken Ashi candle with no wick in the opposite direction)
Any of the three stop loss mechanisms are triggered
Triple-Layer Stop Loss System
The strategy employs a sophisticated three-tier stop loss approach:
ATR Trailing Stop: Adapts to market volatility and locks in profits as the trend extends. This stop moves in the direction of the trade, capturing profit without exiting too early during normal price fluctuations.
Swing Point Stop : Uses natural market structure (recent highs/lows over a lookback period) to place stops at logical support/resistance levels, honoring the market's own rhythm.
Insurance Stop: A percentage-based safety net that protects against sudden adverse moves immediately after entry. This is particularly valuable when the swing point stop might be positioned too far from entry, providing immediate capital protection.
Optimization Features
Customizable Filters: All components (Supertrend, ADX) can be enabled/disabled to adapt to different market conditions
Adjustable Parameters: Fine-tune ATR periods, Supertrend factors, and ADX thresholds
Flexible Stop Loss Settings: Each of the three stop loss mechanisms can be individually enabled/disabled with customizable parameters
Best Practices for Implementation
Recommended Timeframes: Works best on 4-hour charts and above, where trends develop more reliably
Market Conditions: Performs well across various market conditions due to the ADX filter's ability to identify meaningful trends
Position Sizing: The strategy uses a percentage of equity approach (default: 3%) for position sizing
Performance Characteristics
When properly optimized, this strategy has demonstrated profit factors exceeding 3 in backtesting. The approach typically produces generous winners while limiting losses through its multi-layered stop loss system. The ATR trailing stop is particularly effective at capturing extended trends, while the insurance stop provides immediate protection against adverse moves.
The visual components on the chart make it easy to follow the strategy's logic, with position status, entry prices, and current stop levels clearly displayed.
This strategy represents a complete trading system with clearly defined entry and exit rules, adaptive stop loss mechanisms, and built-in risk management through position sizing.

Follow Line Strategy Version 2.5 (React HTF)Follow Line Strategy v2.5 (React HTF) - TradingView Script Usage
This strategy utilizes a "Follow Line" concept based on Bollinger Bands and ATR to identify potential trading opportunities. It includes advanced features like optional working hours filtering, higher timeframe (HTF) trend confirmation, and improved trend-following entry/exit logic. Version 2.5 introduces reactivity to HTF trend changes for more adaptive trading.
Key Features:
Follow Line: The core of the strategy. It dynamically adjusts based on price breakouts beyond Bollinger Bands, using either the low/high or ATR-adjusted levels.
Bollinger Bands: Uses a standard Bollinger Bands setup to identify overbought/oversold conditions.
ATR Filter: Optionally uses the Average True Range (ATR) to adjust the Follow Line offset, providing a more dynamic and volatility-adjusted entry point.
Optional Trading Session Filter: Allows you to restrict trading to specific hours of the day.
Higher Timeframe (HTF) Confirmation: A significant feature that allows you to confirm trade signals with the trend on a higher timeframe. This can help to filter out false signals and improve the overall win rate.
HTF Selection Method: Choose between Auto and Manual HTF selection:
Auto: The script automatically determines the appropriate HTF based on the current chart timeframe (e.g., 1min -> 15min, 5min -> 4h, 1h -> 1D, Daily -> Monthly).
Manual: Allows you to select a specific HTF using the Manual Higher Timeframe input.
Trend-Following Entries/Exits: The strategy aims to enter trades in the direction of the established trend, using the Follow Line to define the trend.
Reactive HTF Trend Changes: v2.5 exits positions not only based on the trade timeframe (TTF) trend changing, but also when the higher timeframe trend reverses against the position. This makes the strategy more responsive to larger market movements.
Alerts: Provides buy and sell alerts for convenient trading signal notifications.
Visualizations: Plots the Follow Line for both the trade timeframe and the higher timeframe (optional), making it easy to understand the strategy's logic.
How to Use:
Add to Chart: Add the "Follow Line Strategy Version 2.5 (React HTF)" script to your TradingView chart.
Configure Settings: Customize the strategy's settings to match your trading style and preferences. Here's a breakdown of the key settings:
Indicator Settings:
ATR Period: The period used to calculate the ATR. A smaller period is more sensitive to recent price changes.
Bollinger Bands Period: The period used for the Bollinger Bands calculation. A longer period results in smoother bands.
Bollinger Bands Deviation: The number of standard deviations from the moving average that the Bollinger Bands are plotted. Higher deviations create wider bands.
Use ATR for Follow Line Offset?: Enable to use ATR to calculate the Follow Line offset. Disable to use the simple high/low.
Show Trade Signals on Chart?: Enable to show BUY/SELL labels on the chart.
Time Filter:
Use Trading Session Filter?: Enable to restrict trading to specific hours of the day.
Trading Session: The trading session to use (e.g., 0930-1600 for regular US stock market hours). Use 0000-2400 for all hours.
Higher Timeframe Confirmation:
Enable HTF Confirmation?: Enable to use the HTF trend to filter trade signals. If enabled, only trades in the direction of the HTF trend will be taken.
HTF Selection Method: Choose between "Auto" and "Manual" HTF selection.
Manual Higher Timeframe: If "Manual" is selected, choose the specific HTF (e.g., 240 for 4 hours, D for daily).
Show HTF Follow Line?: Enable to plot the HTF Follow Line on the chart.
Understanding the Signals:
Buy Signal: The price breaks above the upper Bollinger Band, and the HTF (if enabled) confirms the uptrend.
Sell Signal: The price breaks below the lower Bollinger Band, and the HTF (if enabled) confirms the downtrend.
Exit Long: The trade timeframe trend changes to downtrend or the higher timeframe trend changes to downtrend.
Exit Short: The trade timeframe trend changes to uptrend or the higher timeframe trend changes to uptrend.
Alerts:
The script includes alert conditions for buy and sell signals. To set up alerts, click the "Alerts" button in TradingView and select the desired alert condition from the script. The alert message provides the ticker and interval.
Backtesting and Optimization:
Use TradingView's Strategy Tester to backtest the strategy on different assets and timeframes.
Experiment with different settings to optimize the strategy for your specific trading style and risk tolerance. Pay close attention to the ATR Period, Bollinger Bands settings, and the HTF confirmation options.
Tips and Considerations:
HTF Confirmation: The HTF confirmation can significantly improve the strategy's performance by filtering out false signals. However, it can also reduce the number of trades.
Risk Management: Always use proper risk management techniques, such as stop-loss orders and position sizing, when trading any strategy.
Market Conditions: The strategy may perform differently in different market conditions. It's important to backtest and optimize the strategy for the specific markets you are trading.
Customization: Feel free to modify the script to suit your specific needs. For example, you could add additional filters or entry/exit conditions.
Pyramiding: The pyramiding = 0 setting prevents multiple entries in the same direction, ensuring the strategy doesn't compound losses. You can adjust this value if you prefer to pyramid into winning positions, but be cautious.
Lookahead: The lookahead = barmerge.lookahead_off setting ensures that the HTF data is calculated based on the current bar's closed data, preventing potential future peeking bias.
Trend Determination: The logic for determining the HTF trend and reacting to changes is critical. Carefully review the f_calculateHTFData function and the conditions for exiting positions to ensure you understand how the strategy responds to different market scenarios.
Disclaimer:
This script is for informational and educational purposes only. It is not financial advice, and you should not trade based solely on the signals generated by this script. Always do your own research and consult with a qualified financial advisor before making any trading decisions. The author is not responsible for any losses incurred as a result of using this script.

Strategy Stats [presentTrading]Hello! it's another weekend. This tool is a strategy performance analysis tool. Looking at the TradingView community, it seems few creators focus on this aspect. I've intentionally created a shared version. Welcome to share your idea or question on this.
█ Introduction and How it is Different
Strategy Stats is a comprehensive performance analytics framework designed specifically for trading strategies. Unlike standard strategy backtesting tools that simply show cumulative profits, this analytics suite provides real-time, multi-timeframe statistical analysis of your trading performance.
Multi-timeframe analysis: Automatically tracks performance metrics across the most recent time periods (last 7 days, 30 days, 90 days, 1 year, and 4 years)
Advanced statistical measures: Goes beyond basic metrics to include Information Coefficient (IC) and Sortino Ratio
Real-time feedback: Updates performance statistics with each new trade
Visual analytics: Color-coded performance table provides instant visual feedback on strategy health
Integrated risk management: Implements sophisticated take profit mechanisms with 3-step ATR and percentage-based exits
BTCUSD Performance
The table in the upper right corner is a comprehensive performance dashboard showing trading strategy statistics.
Note: While this presentation uses Vegas SuperTrend as the underlying strategy, this is merely an example. The Stats framework can be applied to any trading strategy. The Vegas SuperTrend implementation is included solely to demonstrate how the analytics module integrates with a trading strategy.
⚠️ Timeframe Limitations
Important: TradingView's backtesting engine has a maximum storage limit of 10,000 bars. When using this strategy stats framework on smaller timeframes such as 1-hour or 2-hour charts, you may encounter errors if your backtesting period is too long.
Recommended Timeframe Usage:
Ideal for: 4H, 6H, 8H, Daily charts and above
May cause errors on: 1H, 2H charts spanning multiple years
Not recommended for: Timeframes below 1H with long history
█ Strategy, How it Works: Detailed Explanation
The Strategy Stats framework consists of three primary components: statistical data collection, performance analysis, and visualization.
🔶 Statistical Data Collection
The system maintains several critical data arrays:
equityHistory: Tracks equity curve over time
tradeHistory: Records profit/loss of each trade
predictionSignals: Stores trade direction signals (1 for long, -1 for short)
actualReturns: Records corresponding actual returns from each trade
For each closed trade, the system captures:
float tradePnL = strategy.closedtrades.profit(tradeIndex)
float tradeReturn = strategy.closedtrades.profit_percent(tradeIndex)
int tradeType = entryPrice < exitPrice ? 1 : -1 // Direction
🔶 Performance Metrics Calculation
The framework calculates several key performance metrics:
Information Coefficient (IC):
The correlation between prediction signals and actual returns, measuring forecast skill.
IC = Correlation(predictionSignals, actualReturns)
Where Correlation is the Pearson correlation coefficient:
Correlation(X,Y) = (nΣXY - ΣXY) / √
Sortino Ratio:
Measures risk-adjusted return focusing only on downside risk:
Sortino = (Avg_Return - Risk_Free_Rate) / Downside_Deviation
Where Downside Deviation is:
Downside_Deviation = √
R_i represents individual returns, T is the target return (typically the risk-free rate), and n is the number of observations.
Maximum Drawdown:
Tracks the largest percentage drop from peak to trough:
DD = (Peak_Equity - Trough_Equity) / Peak_Equity * 100
🔶 Time Period Calculation
The system automatically determines the appropriate number of bars to analyze for each timeframe based on the current chart timeframe:
bars_7d = math.max(1, math.round(7 * barsPerDay))
bars_30d = math.max(1, math.round(30 * barsPerDay))
bars_90d = math.max(1, math.round(90 * barsPerDay))
bars_365d = math.max(1, math.round(365 * barsPerDay))
bars_4y = math.max(1, math.round(365 * 4 * barsPerDay))
Where barsPerDay is calculated based on the chart timeframe:
barsPerDay = timeframe.isintraday ?
24 * 60 / math.max(1, (timeframe.in_seconds() / 60)) :
timeframe.isdaily ? 1 :
timeframe.isweekly ? 1/7 :
timeframe.ismonthly ? 1/30 : 0.01
🔶 Visual Representation
The system presents performance data in a color-coded table with intuitive visual indicators:
Green: Excellent performance
Lime: Good performance
Gray: Neutral performance
Orange: Mediocre performance
Red: Poor performance
█ Trade Direction
The Strategy Stats framework supports three trading directions:
Long Only: Only takes long positions when entry conditions are met
Short Only: Only takes short positions when entry conditions are met
Both: Takes both long and short positions depending on market conditions
█ Usage
To effectively use the Strategy Stats framework:
Apply to existing strategies: Add the performance tracking code to any strategy to gain advanced analytics
Monitor multiple timeframes: Use the multi-timeframe analysis to identify performance trends
Evaluate strategy health: Review IC and Sortino ratios to assess predictive power and risk-adjusted returns
Optimize parameters: Use performance data to refine strategy parameters
Compare strategies: Apply the framework to multiple strategies to identify the most effective approach
For best results, allow the strategy to generate sufficient trade history for meaningful statistical analysis (at least 20-30 trades).
█ Default Settings
The default settings have been carefully calibrated for cryptocurrency markets:
Performance Tracking:
Time periods: 7D, 30D, 90D, 1Y, 4Y
Statistical measures: Return, Win%, MaxDD, IC, Sortino Ratio
IC color thresholds: >0.3 (green), >0.1 (lime), <-0.1 (orange), <-0.3 (red)
Sortino color thresholds: >1.0 (green), >0.5 (lime), <0 (red)
Multi-Step Take Profit:
ATR multipliers: 2.618, 5.0, 10.0
Percentage levels: 3%, 8%, 17%
Short multiplier: 1.5x (makes short take profits more aggressive)
Stop loss: 20%

RSI Pro+ (Bear market, financial crisis and so on EditionIn markets defined by volatility, fear, and uncertainty – the battlegrounds of bear markets and financial crises – you need tools forged in resilience. Introducing RSI Pro+, a strategy built upon a legendary indicator born in 1978, yet engineered with modern visual clarity to remain devastatingly effective even in the chaotic financial landscapes of 3078.
This isn't about complex algorithms predicting the unpredictable. It's about harnessing the raw, time-tested power of the Relative Strength Index (RSI) to identify potential exhaustion points and capitalize on oversold conditions. RSI Pro+ cuts through the noise, providing clear, actionable signals when markets might be poised for a relief bounce or reversal.
Core Technology (The 1978 Engine):
RSI Crossover Entry: The strategy initiates a LONG position when the RSI (default period 11) crosses above a user-defined low threshold (default 30). This classic technique aims to enter when selling pressure may be waning, offering potential entry points during sharp downturns or periods of consolidation after a fall.
Modern Enhancements (The 3078 Cockpit):
RSI Pro+ isn't just about the signal; it's about providing a professional-grade visual experience directly on your chart:
Entry Bar Highlight: A subtle background flash on the chart signals the exact bar where the RSI crossover condition is met, alerting you to potential entry opportunities.
Trade Bar Coloring: Once a trade is active, the price bars are subtly colored, giving you immediate visual confirmation that the strategy is live in the market.
Entry Price Line: A clear, persistent line marks your exact average entry price for the duration of the trade, serving as a crucial visual anchor.
Take Profit Line: Your calculated Take Profit target is plotted as a distinct line, keeping your objective clearly in sight.
Custom Entry Marker: A precise shape (▲) appears below the bar where the trade entry was actually executed, pinpointing the start of the position.
On-Chart Info Table (HUD): A clean, customizable Heads-Up Display appears when a trade is active, showing vital information at a glance:
Entry Price: Your position's average cost basis.
TP Target: The calculated price level for your Take Profit exit.
Current PnL%: Real-time Profit/Loss percentage for the open trade.
Full Customization: Nearly every aspect is configurable via the settings menu:
RSI Period & Crossover Level
Take Profit Percentage
Toggle ALL visual enhancements on/off individually
Position the Info Table wherever you prefer on the chart.
How to Use RSI Pro+:
Add to Chart: Apply the "RSI Pro+ (Bear market...)" strategy to your TradingView chart. Ensure any previous versions are removed.
Access Settings: Click the cogwheel icon (⚙️) next to the strategy name on your chart.
Configure Inputs (Crucial Step):
RSI Crossover Level: This is key. The default (30) targets standard oversold conditions. In severe downturns, you might experiment with lower levels (e.g., 25, 20) or higher ones (e.g., 40) depending on the asset and timeframe. Observe where RSI(11) typically bottoms out on your chart.
Take Profit Percentage (%): Define your desired profit target per trade (e.g., enter 0.5 for 0.5%, 1.0 for 1%). The default is a very small 0.11%.
RSI Period: While default is 11, you can adjust this (e.g., the standard 14).
Visual Enhancements: Enable or disable the visual features (background highlights, bar coloring, lines, markers, table) according to your preference using the checkboxes. Adjust table position.
Observe & Backtest: Watch how the strategy behaves on your chosen asset and timeframe. Use TradingView's Strategy Tester to analyze historical performance based on your settings. No strategy works perfectly everywhere; testing is essential.
Important Considerations:
Risk Management: This specific script version focuses on a Take Profit exit. It does not include an explicit Stop Loss. You MUST manage risk through appropriate position sizing, potentially adding a Stop Loss manually, or by modifying the script.
Oversold ≠ Reversal: An RSI crossover is an indicator of potential exhaustion, not a guarantee of a price reversal.
Fixed TP: A fixed percentage TP ensures small wins but may exit before larger potential moves.
Backtesting Limitations: Past performance does not guarantee future results.
RSI Pro+ strips away complexity to focus on a robust, time-honored principle, enhanced with modern visuals for the discerning trader navigating today's (and tomorrow's) challenging markets

Adaptive KDJ (MTF)Hey guys,
this is an adaptive MTF KDJ oscillator.
Pick up to 3 different timeframes, choose a weighting if you want and enjoy the beautiful signals it will show you.
The length of every timeframe is adaptive and based of the timeframe's ATR.
The plot shows the smoothed average of the 3 KDJ values.
Large triangles show KDJ crossings.
Small triangles show anticipations of possible crossings.
I found out it works best with 1m, 5m, 15m and weighting=1 for forex scalping in 1m.
Use other indicators for confluence.

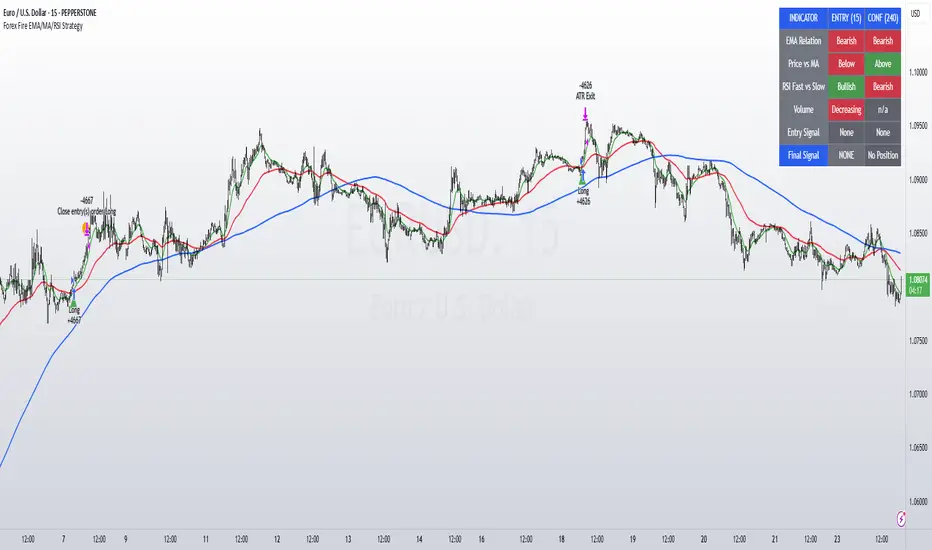
Forex Fire EMA/MA/RSI StrategyEURUSD
The entry method in the Forex Fire EMA/MA/RSI Strategy combines several conditions across two timeframes. Here's a breakdown of how entries are determined:
Long Entry Conditions:
15-Minute Timeframe Conditions:
EMA 13 > EMA 62 (short-term momentum is bullish)
Price > MA 200 (trading above the major trend indicator)
Fast RSI (7) > Slow RSI (28) (momentum is increasing)
Fast RSI > 50 (showing bullish momentum)
Volume is increasing compared to 20-period average
4-Hour Timeframe Confluence:
EMA 13 > EMA 62 (larger timeframe confirms bullish trend)
Price > MA 200 (confirming overall uptrend)
Slow RSI (28) > 40 (showing bullish bias)
Fast RSI > Slow RSI (momentum is supporting the move)
Additional Precision Requirement:
Either EMA 13 has just crossed above EMA 62 (crossover)
OR price has just crossed above MA 200
Short Entry Conditions:
15-Minute Timeframe Conditions:
EMA 13 < EMA 62 (short-term momentum is bearish)
Price < MA 200 (trading below the major trend indicator)
Fast RSI (7) < Slow RSI (28) (momentum is decreasing)
Fast RSI < 50 (showing bearish momentum)
Volume is increasing compared to 20-period average
4-Hour Timeframe Confluence:
EMA 13 < EMA 62 (larger timeframe confirms bearish trend)
Price < MA 200 (confirming overall downtrend)
Slow RSI (28) < 60 (showing bearish bias)
Fast RSI < Slow RSI (momentum is supporting the move)
Additional Precision Requirement:
Either EMA 13 has just crossed under EMA 62 (crossunder)
OR price has just crossed under MA 200
The key aspect of this strategy is that it requires alignment between the shorter timeframe (15m) and the larger timeframe (4h), which helps filter out false signals and focuses on trades that have strong multi-timeframe support. The crossover/crossunder requirement further refines entries by looking for actual changes in direction rather than just conditions that might have been in place for a long time.
Trendline Breaks with Multi Fibonacci Supertrend StrategyTMFS Strategy: Advanced Trendline Breakouts with Multi-Fibonacci Supertrend
Elevate your algorithmic trading with institutional-grade signal confluence
Strategy Genesis & Evolution
This advanced trading system represents the culmination of a personal research journey, evolving from my custom " Multi Fibonacci Supertrend with Signals " indicator into a comprehensive trading strategy. Built upon the exceptional trendline detection methodology pioneered by LuxAlgo in their " Trendlines with Breaks " indicator, I've engineered a systematic framework that integrates multiple technical factors into a cohesive trading system.
Core Fibonacci Principles
At the heart of this strategy lies the Fibonacci sequence application to volatility measurement:
// Fibonacci-based factors for multiple Supertrend calculations
factor1 = input.float(0.618, 'Factor 1 (Weak/Fibonacci)', minval = 0.01, step = 0.01)
factor2 = input.float(1.618, 'Factor 2 (Medium/Golden Ratio)', minval = 0.01, step = 0.01)
factor3 = input.float(2.618, 'Factor 3 (Strong/Extended Fib)', minval = 0.01, step = 0.01)
These precise Fibonacci ratios create a dynamic volatility envelope that adapts to changing market conditions while maintaining mathematical harmony with natural price movements.
Dynamic Trendline Detection
The strategy incorporates LuxAlgo's pioneering approach to trendline detection:
// Pivotal swing detection (inspired by LuxAlgo)
pivot_high = ta.pivothigh(swing_length, swing_length)
pivot_low = ta.pivotlow(swing_length, swing_length)
// Dynamic slope calculation using ATR
slope = atr_value / swing_length * atr_multiplier
// Update trendlines based on pivot detection
if bool(pivot_high)
upper_slope := slope
upper_trendline := pivot_high
else
upper_trendline := nz(upper_trendline) - nz(upper_slope)
This adaptive trendline approach automatically identifies key structural market boundaries, adjusting in real-time to evolving chart patterns.
Breakout State Management
The strategy implements sophisticated state tracking for breakout detection:
// Track breakouts with state variables
var int upper_breakout_state = 0
var int lower_breakout_state = 0
// Update breakout state when price crosses trendlines
upper_breakout_state := bool(pivot_high) ? 0 : close > upper_trendline ? 1 : upper_breakout_state
lower_breakout_state := bool(pivot_low) ? 0 : close < lower_trendline ? 1 : lower_breakout_state
// Detect new breakouts (state transitions)
bool new_upper_breakout = upper_breakout_state > upper_breakout_state
bool new_lower_breakout = lower_breakout_state > lower_breakout_state
This state-based approach enables precise identification of the exact moment when price breaks through a significant trendline.
Multi-Factor Signal Confluence
Entry signals require confirmation from multiple technical factors:
// Define entry conditions with multi-factor confluence
long_entry_condition = enable_long_positions and
upper_breakout_state > upper_breakout_state and // New trendline breakout
di_plus > di_minus and // Bullish DMI confirmation
close > smoothed_trend // Price above Supertrend envelope
// Execute trades only with full confirmation
if long_entry_condition
strategy.entry('L', strategy.long, comment = "LONG")
This strict requirement for confluence significantly reduces false signals and improves the quality of trade entries.
Advanced Risk Management
The strategy includes sophisticated risk controls with multiple methodologies:
// Calculate stop loss based on selected method
get_long_stop_loss_price(base_price) =>
switch stop_loss_method
'PERC' => base_price * (1 - long_stop_loss_percent)
'ATR' => base_price - long_stop_loss_atr_multiplier * entry_atr
'RR' => base_price - (get_long_take_profit_price() - base_price) / long_risk_reward_ratio
=> na
// Implement trailing functionality
strategy.exit(
id = 'Long Take Profit / Stop Loss',
from_entry = 'L',
qty_percent = take_profit_quantity_percent,
limit = trailing_take_profit_enabled ? na : long_take_profit_price,
stop = long_stop_loss_price,
trail_price = trailing_take_profit_enabled ? long_take_profit_price : na,
trail_offset = trailing_take_profit_enabled ? long_trailing_tp_step_ticks : na,
comment = "TP/SL Triggered"
)
This flexible approach adapts to varying market conditions while providing comprehensive downside protection.
Performance Characteristics
Rigorous backtesting demonstrates exceptional capital appreciation potential with impressive risk-adjusted metrics:
Remarkable total return profile (1,517%+)
Strong Sortino ratio (3.691) indicating superior downside risk control
Profit factor of 1.924 across all trades (2.153 for long positions)
Win rate exceeding 35% with balanced distribution across varied market conditions
Institutional Considerations
The strategy architecture addresses execution complexities faced by institutional participants with temporal filtering and date-range capabilities:
// Time Filter settings with flexible timezone support
import jason5480/time_filters/5 as time_filter
src_timezone = input.string(defval = 'Exchange', title = 'Source Timezone')
dst_timezone = input.string(defval = 'Exchange', title = 'Destination Timezone')
// Date range filtering for precise execution windows
use_from_date = input.bool(defval = true, title = 'Enable Start Date')
from_date = input.time(defval = timestamp('01 Jan 2022 00:00'), title = 'Start Date')
// Validate trading permission based on temporal constraints
date_filter_approved = time_filter.is_in_date_range(
use_from_date, from_date, use_to_date, to_date, src_timezone, dst_timezone
)
These capabilities enable precise execution timing and market session optimization critical for larger market participants.
Acknowledgments
Special thanks to LuxAlgo for the pioneering work on trendline detection and breakout identification that inspired elements of this strategy. Their innovative approach to technical analysis provided a valuable foundation upon which I could build my Fibonacci-based methodology.
This strategy is shared under the same Attribution-NonCommercial-ShareAlike 4.0 International (CC BY-NC-SA 4.0) license as LuxAlgo's original work.
Past performance is not indicative of future results. Conduct thorough analysis before implementing any algorithmic strategy.

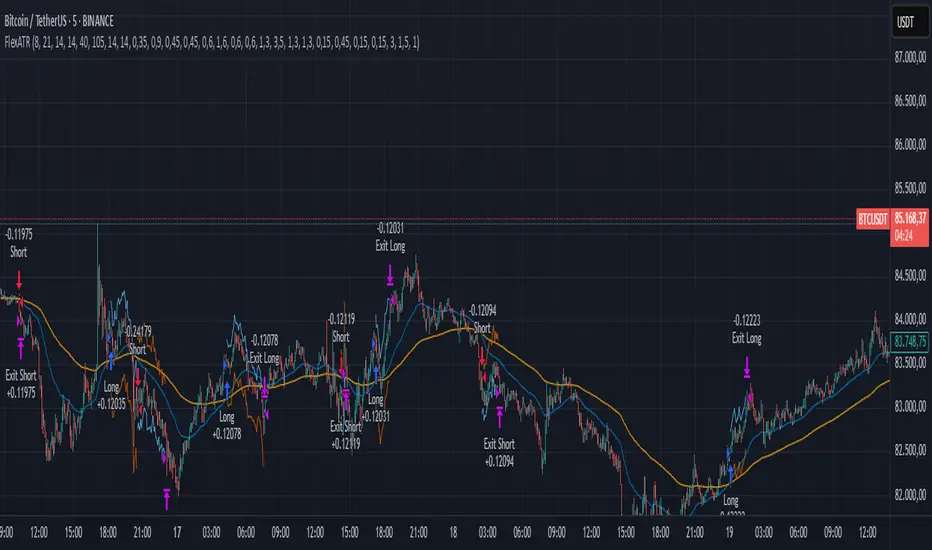
FlexATRFlexATR: A Dynamic Multi-Timeframe Trading Strategy
Overview: FlexATR is a versatile trading strategy that dynamically adapts its key parameters based on the timeframe being used. It combines technical signals from exponential moving averages (EMAs) and the Relative Strength Index (RSI) with volatility-based risk management via the Average True Range (ATR). This approach helps filter out false signals while adjusting to varying market conditions — whether you’re trading on a daily chart, intraday charts (30m, 60m, or 5m), or even on higher timeframes like the 4-hour or weekly charts.
How It Works:
Multi-Timeframe Parameter Adaptation: FlexATR is designed to automatically adjust its indicator settings depending on the timeframe:
Daily and Weekly: On higher timeframes, the strategy uses longer periods for the fast and slow EMAs and standard periods for RSI and ATR to capture more meaningful trend confirmations while minimizing noise.
Intraday (e.g., 30m, 60m, 5m, 4h): The parameters are converted from “days” into the corresponding number of bars. For instance, on a 30-minute chart, a “day” might equal 48 bars. The preset values for a 30-minute chart have been slightly reduced (e.g., a fast EMA is set at 0.35 days instead of 0.4) to improve reactivity while maintaining robust filtering.
Signal Generation:
Entry Signals: The strategy enters long positions when the fast EMA crosses above the slow EMA and the RSI is above 50, and it enters short positions when the fast EMA crosses below the slow EMA with the RSI below 50. This dual confirmation helps ensure that signals are reliable.
Risk Management: The ATR is used to compute dynamic levels for stop loss and profit target:
Stop Loss: For a long position, the stop loss is placed at Price - (ATR × Stop Loss Multiplier). For a short position, it is at Price + (ATR × Stop Loss Multiplier).
Profit Target: The profit target is similarly set using the ATR multiplied by a designated profit multiplier.
Dynamic Trailing Stop: FlexATR further incorporates a dynamic trailing stop (if enabled) that adjusts according to the ATR. This trailing stop follows favorable price movements at a distance defined by a multiplier, locking in gains as the trend develops. The use of a trailing stop helps protect profits without requiring a fixed exit point.
Capital Allocation: Each trade is sized at 10% of the total equity. This percentage-based position sizing allows the strategy to scale with your account size. While the current setup assumes no leverage (a 1:1 exposure), the inherent design of the strategy means you can adjust the leverage externally if desired, with risk metrics scaling accordingly.
Visual Representation: For clarity and accessibility (especially for those with color vision deficiencies), FlexATR employs a color-blind friendly palette (the Okabe-Ito palette):
EMA Fast: Displayed in blue.
EMA Slow: Displayed in orange.
Stop Loss Levels: Rendered in vermilion.
Profit Target Levels: Shown in a distinct azzurro (light blue).
Benefits and Considerations:
Reliability: By requiring both EMA crossovers and an RSI confirmation, FlexATR filters out a significant amount of market noise, which reduces false signals at the expense of some delayed entries.
Adaptability: The automatic conversion of “day-based” parameters into bar counts for intraday charts means the strategy remains consistent across different timeframes.
Risk Management: Using the ATR for both fixed and trailing stops allows the strategy to adapt to changing market volatility, helping to protect your capital.
Flexibility: The strategy’s inputs are customizable via the input panel, allowing traders to fine-tune the parameters for different assets or market conditions.
Conclusion: FlexATR is designed as a balanced, adaptive strategy that emphasizes reliability and robust risk management across a variety of timeframes. While it may sometimes enter trades slightly later due to its filtering mechanism, its focus on confirming trends helps reduce the likelihood of false signals. This makes it particularly attractive for traders who prioritize a disciplined, multi-timeframe approach to capturing market trends.
Multi-Timeframe MACD Strategy ver 1.0Multi-Timeframe MACD Strategy: Enhanced Trend Trading with Customizable Entry and Trailing Stop
This strategy utilizes the Moving Average Convergence Divergence (MACD) indicator across multiple timeframes to identify strong trends, generate precise entry and exit signals, and manage risk with an optional trailing stop loss. By combining the insights of both the current chart's timeframe and a user-defined higher timeframe, this strategy aims to improve trade accuracy, reduce exposure to false signals, and capture larger market moves.
Key Features:
Dual Timeframe Analysis: Calculates and analyzes the MACD on both the current chart's timeframe and a user-selected higher timeframe (e.g., Daily MACD on a 1-hour chart). This provides a broader market context, helping to confirm trends and filter out short-term noise.
Configurable MACD: Fine-tune the MACD calculation with adjustable Fast Length, Slow Length, and Signal Length parameters. Optimize the indicator's sensitivity to match your trading style and the volatility of the asset.
Flexible Entry Options: Choose between three distinct entry types:
Crossover: Enters trades when the MACD line crosses above (long) or below (short) the Signal line.
Zero Cross: Enters trades when the MACD line crosses above (long) or below (short) the zero line.
Both: Combines both Crossover and Zero Cross signals, providing more potential entry opportunities.
Independent Timeframe Control: Display and trade based on the current timeframe MACD, the higher timeframe MACD, or both. This allows you to focus on the information most relevant to your analysis.
Optional Trailing Stop Loss: Implements a configurable trailing stop loss to protect profits and limit potential losses. The trailing stop is adjusted dynamically as the price moves in your favor, based on a user-defined percentage.
No Repainting: Employs lookahead=barmerge.lookahead_off in the request.security() function to prevent data leakage and ensure accurate backtesting and real-time signals.
Clear Visual Signals (Optional): Includes optional plotting of the MACD and Signal lines for both timeframes, with distinct colors for easy visual identification. These plots are for visual confirmation and are not required for the strategy's logic.
Suitable for Various Trading Styles: Adaptable to swing trading, day trading, and trend-following strategies across diverse markets (stocks, forex, cryptocurrencies, etc.).
Fully Customizable: All parameters are adjustable, including timeframes, MACD Settings, Entry signal type and trailing stop settings.
How it Works:
MACD Calculation: The strategy calculates the MACD (using the standard formula) for both the current chart's timeframe and the specified higher timeframe.
Trend Identification: The relationship between the MACD line, Signal line, and zero line is used to determine the current trend for each timeframe.
Entry Signals: Buy/sell signals are generated based on the selected "Entry Type":
Crossover: A long signal is generated when the MACD line crosses above the Signal line, and both timeframes are in agreement (if both are enabled). A short signal is generated when the MACD line crosses below the Signal line, and both timeframes are in agreement.
Zero Cross: A long signal is generated when the MACD line crosses above the zero line, and both timeframes agree. A short signal is generated when the MACD line crosses below the zero line and both timeframes agree.
Both: Combines Crossover and Zero Cross signals.
Trailing Stop Loss (Optional): If enabled, a trailing stop loss is set at a specified percentage below (for long positions) or above (for short positions) the entry price. The stop-loss is automatically adjusted as the price moves favorably.
Exit Signals:
Without Trailing Stop: Positions are closed when the MACD signals reverse according to the selected "Entry Type" (e.g., a long position is closed when the MACD line crosses below the Signal line if using "Crossover" entries).
With Trailing Stop: Positions are closed if the price hits the trailing stop loss.
Backtesting and Optimization: The strategy automatically backtests on the chart's historical data, allowing you to assess its performance and optimize parameters for different assets and timeframes.
Example Use Cases:
Confirming Trend Strength: A trader on a 1-hour chart sees a bullish MACD crossover on the current timeframe. They check the MTF MACD strategy and see that the Daily MACD is also bullish, confirming the strength of the uptrend.
Filtering Noise: A trader using a 15-minute chart wants to avoid false signals from short-term volatility. They use the strategy with a 4-hour higher timeframe to filter out noise and only trade in the direction of the dominant trend.
Dynamic Risk Management: A trader enters a long position and enables the trailing stop loss. As the price rises, the trailing stop is automatically adjusted upwards, protecting profits. The trade is exited either when the MACD reverses or when the price hits the trailing stop.
Disclaimer:
The MACD is a lagging indicator and can produce false signals, especially in ranging markets. This strategy is for educational and informational purposes only and should not be considered financial advice. Backtest and optimize the strategy thoroughly, combine it with other technical analysis tools, and always implement sound risk management practices before using it with real capital. Past performance is not indicative of future results. Conduct your own due diligence and consider your risk tolerance before making any trading decisions.

Multi-Timeframe Parabolic SAR Strategy ver 1.0Multi-Timeframe Parabolic SAR Strategy (MTF PSAR) - Enhanced Trend Trading
This strategy leverages the power of the Parabolic SAR (Stop and Reverse) indicator across multiple timeframes to provide robust trend identification, precise entry/exit signals, and dynamic trailing stop management. By combining the insights of both the current chart's timeframe and a user-defined higher timeframe, this strategy aims to improve trading accuracy, reduce risk, and capture more significant market moves.
Key Features:
Dual Timeframe Analysis: Simultaneously analyzes the Parabolic SAR on the current chart and a higher timeframe (e.g., Daily PSAR on a 1-hour chart). This allows you to align your trades with the dominant trend and filter out noise from lower timeframes.
Configurable PSAR: Fine-tune the PSAR calculation with adjustable Start, Increment, and Maximum values to optimize sensitivity for your trading style and the asset's volatility.
Independent Timeframe Control: Choose to display and trade based on either or both the current timeframe PSAR and the higher timeframe PSAR. Focus on the most relevant information for your analysis.
Clear Visual Signals: Distinct colors for the current and higher timeframe PSAR dots provide a clear visual representation of potential entry and exit points.
Multiple Entry Strategies: The strategy offers flexible entry conditions, allowing you to trade based on:
Confirmation: Both current and higher timeframe PSAR signals agree and the current timeframe PSAR has just flipped direction. (Most conservative)
Current Timeframe Only: Trades based solely on the current timeframe PSAR, ideal for when the higher timeframe is less relevant or disabled.
Higher Timeframe Only: Trades based solely on the higher timeframe PSAR.
Dynamic Trailing Stop (PSAR-Based): Implements a trailing stop-loss based on the current timeframe's Parabolic SAR. This helps protect profits by automatically adjusting the stop-loss as the price moves in your favor. Exits are triggered when either the current or HTF PSAR flips.
No Repainting: Uses lookahead=barmerge.lookahead_off in the security() function to ensure that the higher timeframe data is accessed without any data leakage, preventing repainting issues.
Fully Configurable: All parameters (PSAR settings, higher timeframe, visibility, colors) are adjustable through the strategy's settings panel, allowing for extensive customization and optimization.
Suitable for Various Trading Styles: Applicable to swing trading, day trading, and trend-following strategies across various markets (stocks, forex, cryptocurrencies, etc.).
How it Works:
PSAR Calculation: The strategy calculates the standard Parabolic SAR for both the current chart's timeframe and the selected higher timeframe.
Trend Identification: The direction of the PSAR (dots below price = uptrend, dots above price = downtrend) determines the current trend for each timeframe.
Entry Signals: The strategy generates buy/sell signals based on the chosen entry strategy (Confirmation, Current Timeframe Only, or Higher Timeframe Only). The Confirmation strategy offers the highest probability signals by requiring agreement between both timeframes.
Trailing Stop Exit: Once a position is entered, the strategy uses the current timeframe PSAR as a dynamic trailing stop. The stop-loss is automatically adjusted as the PSAR dots move, helping to lock in profits and limit losses. The strategy exits when either the Current or HTF PSAR changes direction.
Backtesting and Optimization: The strategy automatically backtests on the chart's historical data, allowing you to evaluate its performance and optimize the settings for different assets and timeframes.
Example Use Cases:
Trend Confirmation: A trader on a 1-hour chart observes a bullish PSAR flip on the current timeframe. They check the MTF PSAR strategy and see that the Daily PSAR is also bullish, confirming the strength of the uptrend and providing a high-probability long entry signal.
Filtering Noise: A trader on a 5-minute chart wants to avoid whipsaws caused by short-term price fluctuations. They use the strategy with a 1-hour higher timeframe to filter out noise and only trade in the direction of the dominant trend.
Dynamic Risk Management: A trader enters a long position and uses the current timeframe PSAR as a trailing stop. As the price rises, the PSAR dots move upwards, automatically raising the stop-loss and protecting profits. The trade is exited when the current (or HTF) PSAR flips to bearish.
Disclaimer:
The Parabolic SAR is a lagging indicator and can produce false signals, particularly in ranging or choppy markets. This strategy is intended for educational and informational purposes only and should not be considered financial advice. It is essential to backtest and optimize the strategy thoroughly, use it in conjunction with other technical analysis tools, and implement sound risk management practices before using it with real capital. Past performance is not indicative of future results. Always conduct your own due diligence and consider your risk tolerance before making any trading decisions.

Fibonacci-Only Strategy V2Fibonacci-Only Strategy V2
This strategy combines Fibonacci retracement levels with pattern recognition and statistical confirmation to identify high-probability trading opportunities across multiple timeframes.
Core Strategy Components:
Fibonacci Levels: Uses key Fibonacci retracement levels (19% and 82.56%) to identify potential reversal zones
Pattern Recognition: Analyzes recent price patterns to find similar historical formations
Statistical Confirmation: Incorporates statistical analysis to validate entry signals
Risk Management: Includes customizable stop loss (fixed or ATR-based) and trailing stop features
Entry Signals:
Long entries occur when price touches or breaks the 19% Fibonacci level with bullish confirmation
Short entries require Fibonacci level interaction, bearish confirmation, and statistical validation
All signals are visually displayed with color-coded markers and dashboard
Trading Method:
When a triangle signal appears, open a position on the next candle
Alternatively, after seeing a signal on a higher timeframe, you can switch to a lower timeframe to find a more precise entry point
Entry signals are clearly marked with visual indicators for easy identification
Risk Management Features:
Adjustable stop loss (percentage-based or ATR-based)
Optional trailing stops for protecting profits
Multiple take-profit levels for strategic position exit
Customization Options:
Timeframe selection (1m to Daily)
Pattern length and similarity threshold adjustment
Statistical period and weight configuration
Risk parameters including stop loss and trailing stop settings
This strategy is particularly well-suited for cryptocurrency markets due to their tendency to respect Fibonacci levels and technical patterns. Crypto's volatility is effectively managed through the customizable stop-loss and trailing-stop mechanisms, making it an ideal tool for traders in digital asset markets.
For optimal performance, this strategy works best on higher timeframes (30m, 1h and above) and is not recommended for low timeframe scalping. The Fibonacci pattern recognition requires sufficient price movement to generate reliable signals, which is more consistently available in medium to higher timeframes.
Users should avoid trading during sideways market conditions, as the strategy performs best during trending markets with clear directional movement. The statistical confirmation component helps filter out some sideways market signals, but it's recommended to manually avoid ranging markets for best results.

Long-Only MTF EMA Cloud StrategyOverview:
The Long-Only EMA Cloud Strategy is a powerful trend-following strategy designed to help traders identify and capitalize on bullish market conditions. By utilizing an Exponential Moving Average (EMA) Cloud, this strategy provides clear and reliable signals for entering long positions when the market trend is favorable. The EMA cloud acts as a visual representation of the trend, making it easier for traders to make informed decisions. This strategy is ideal for traders who prefer to trade in the direction of the trend and focus exclusively on long positions.
Key Features:
EMA Cloud:
The strategy uses two EMAs (short and long) to create a dynamic cloud.
The cloud is bullish when the short EMA is above the long EMA, indicating a strong upward trend.
The cloud is bearish when the short EMA is below the long EMA, indicating a downward trend or consolidation.
Long Entry Signals:
A long position is opened when the EMA cloud turns bullish, which occurs when the short EMA crosses above the long EMA.
This crossover signals a potential shift in market sentiment from bearish to bullish, providing an opportunity to enter a long trade.
Adjustable Timeframe:
The EMA cloud can be calculated on the same timeframe as the chart or on a higher/lower timeframe for multi-timeframe analysis.
This flexibility allows traders to adapt the strategy to their preferred trading style and time horizon.
Risk Management:
The strategy includes adjustable stop loss and take profit levels to help traders manage risk and lock in profits.
Stop loss and take profit levels are calculated as a percentage of the entry price, ensuring consistency across different assets and market conditions.
Alerts:
Built-in alerts notify you when a long entry signal is generated, ensuring you never miss a trading opportunity.
Alerts can be customized to suit your preferences, providing real-time notifications for potential trades.
Visualization:
The EMA cloud is plotted on the chart, providing a clear visual representation of the trend.
Buy signals are marked with a green label below the price bar, making it easy to identify entry points.
How to Use:
Add the Script:
Add the script to your chart in TradingView.
Set EMA Lengths:
Adjust the Short EMA Length and Long EMA Length in the settings to suit your trading style.
For example, you might use a shorter EMA (e.g., 21) for more responsive signals or a longer EMA (e.g., 50) for smoother signals.
Choose EMA Cloud Resolution:
Select the EMA Cloud Resolution (timeframe) for the cloud calculation.
You can choose the same timeframe as the chart or a different timeframe (higher or lower) for multi-timeframe analysis.
Adjust Risk Management:
Set the Stop Loss (%) and Take Profit (%) levels according to your risk tolerance and trading goals.
For example, you might use a 1% stop loss and a 2% take profit for a 1:2 risk-reward ratio.
Enable Alerts:
Enable alerts to receive notifications for long entry signals.
Alerts can be configured to send notifications via email, SMS, or other preferred methods.
Monitor and Trade:
Monitor the chart for buy signals and execute trades accordingly.
Use the EMA cloud as a visual guide to confirm the trend direction before entering a trade.
Ideal For:
Trend-Following Traders: This strategy is perfect for traders who prefer to trade in the direction of the trend and capitalize on sustained price movements.
Long-Only Traders: If you prefer to focus exclusively on long positions, this strategy provides a clear and systematic approach to identifying bullish opportunities.
Multi-Timeframe Analysts: The adjustable EMA cloud resolution allows you to analyze trends across different timeframes, making it suitable for both short-term and long-term traders.
Risk-Averse Traders: The inclusion of stop loss and take profit levels helps manage risk and protect your capital.

is_strategyCorrection-Adaptive Trend Strategy (Open-Source)
Core Advantage: Designed specifically for the is_correction indicator, with full transparency and customization options.
Key Features:
Open-Source Code:
✅ Full access to the strategy logic – study how every trade signal is generated.
✅ Freedom to customize – modify entry/exit rules, risk parameters, or add new indicators.
✅ No black boxes – understand and trust every decision the strategy makes.
Built for is_correction:
Filters out false signals during market noise.
Works only in confirmed trends (is_correction = false).
Adaptable for Your Needs:
Change Take Profit/Stop Loss ratios directly in the code.
Add alerts, notifications, or integrate with other tools (e.g., Volume Profile).
For Developers/Traders:
Use the code as a template for your own strategies.
Test modifications risk-free on historical data.
How the Strategy Works:
Main Goal:
Automatically buys when the price starts rising and sells when it starts falling, but only during confirmed trends (ignoring temporary pullbacks).
What You See on the Chart:
📈 Up arrows ▼ (below the candle) = Buy signal.
📉 Down arrows ▲ (above the candle) = Sell signal.
Gray background = Market is in a correction (no trades).
Key Mechanics:
Buy Condition:
Price closes higher than the previous candle + is_correction confirms the main trend (not a pullback).
Example: Red candle → green candle → ▼ arrow → buy.
Sell Condition:
Price closes lower than the previous candle + is_correction confirms the trend (optional: turn off short-selling in settings).
Exit Rules:
Closes trades automatically at:
+0.5% profit (adjustable in settings).
-0.5% loss (adjustable).
Or if a reverse signal appears (e.g., sell signal after a buy).
User-Friendly Settings:
Sell – On (default: ON):
ON → Allows short-selling (selling when price falls).
OFF → Strategy only buys and closes positions.
Revers (default: OFF):
ON → Inverts signals (▼ = sell, ▲ = buy).
%Profit & %Loss:
Adjust these values (0-30%) to increase/decrease profit targets and risk.
Example Scenario:
Buy Signal:
Price rises for 3 days → green ▼ arrow → strategy buys.
Stop loss set 0.5% below entry price.
If price keeps rising → trade closes at +0.5% profit.
Correction Phase:
After a rally, price drops for 1 day → gray background → strategy ignores the drop (no action).
Stop Loss Trigger:
If price drops 0.5% from entry → trade closes automatically.
Key Features:
Correction Filter (is_correction):
Acts as a “noise filter” → avoids trades during temporary pullbacks.
Flexibility:
Disable short-selling, flip signals, or tweak profit/loss levels in seconds.
Transparency:
Open-source code → see exactly how every signal is generated (click “Source” in TradingView).
Tips for Beginners:
Test First:
Run the strategy on historical data (click the “Chart” icon in TradingView).
See how it performed in the past.
Customize It:
Increase %Profit to 2-3% for volatile assets like crypto.
Turn off Sell – On if short-selling confuses you.
Trust the Stop Loss:
Even if you think the price will rebound, the strategy will close at -0.5% to protect your capital.
Where to Find Settings:
Click the strategy name on the top-left of your chart → adjust sliders/toggles in the menu.
Русская Версия
Трендовая стратегия с открытым кодом
Главное преимущество: Полная прозрачность логики и адаптация под ваши нужды.
Особенности:
Открытый исходный код:
✅ Видите всю «кухню» стратегии – как формируются сигналы, когда открываются сделки.
✅ Меняйте правила – корректируйте тейк-профит, стоп-лосс или добавляйте новые условия.
✅ Никаких секретов – вы контролируете каждое правило.
Заточка под is_correction:
Игнорирует ложные сигналы в коррекциях.
Работает только в сильных трендах (is_correction = false).
Гибкая настройка:
Подстройте параметры под свой риск-менеджмент.
Добавьте свои индикаторы или условия для входа.
Для трейдеров и разработчиков:
Используйте код как основу для своих стратегий.
Тестируйте изменения на истории перед реальной торговлей.
Простыми словами:
Почему это удобно:
Открытый код = полный контроль. Вы можете:
Увидеть, как именно стратегия решает купить или продать.
Изменить правила закрытия сделок (например, поставить TP=2% вместо 1.5%).
Добавить новые условия (например, торговать только при высоком объёме).
Примеры кастомизации:
Новички: Меняйте только TP/SL в настройках (без кодинга).
Продвинутые: Добавьте RSI-фильтр, чтобы избегать перекупленности.
Разработчики: Встройте стратегию в свою торговую систему.
Как начать:
Скачайте код из TradingView.
Изучите логику в разделе strategy.entry/exit.
Меняйте параметры в блоке input.* (безопасно!).
Тестируйте изменения и оптимизируйте под свои цели.
Как работает стратегия:
Главная задача:
Автоматически покупает, когда цена начинает расти, и продаёт, когда падает. Но делает это «умно» — только когда рынок в основном тренде, а не во временном откате (коррекции).
Что видно на графике:
📈 Стрелки вверх ▼ (под свечой) — сигнал на покупку.
📉 Стрелки вниз ▲ (над свечой) — сигнал на продажу.
Серый фон — рынок в коррекции (не торгуем).
Как это работает:
Когда покупаем:
Если цена закрылась выше предыдущей и индикатор is_correction показывает «основной тренд» (не коррекция).
Пример: Была красная свеча → стала зелёная → появилась стрелка ▼ → покупаем.
Когда продаём:
Если цена закрылась ниже предыдущей и is_correction подтверждает тренд (опционально, можно отключить в настройках).
Когда закрываем сделку:
Автоматически при достижении:
+0.5% прибыли (можно изменить в настройках).
-0.5% убытка (можно изменить).
Или если появился противоположный сигнал (например, после покупки пришла стрелка продажи).
Настройки для чайников:
«Sell – On» (включено по умолчанию):
Если включено → стратегия будет продавать в шорт.
Если выключено → только покупки и закрытие позиций.
«Revers» (выключено по умолчанию):
Если включить → стратегия будет работать наоборот (стрелки ▼ = продажа, ▲ = покупка).
«%Profit» и «%Loss»:
Меняйте эти цифры (от 0 до 30), чтобы увеличить/уменьшить прибыль и риски.
Пример работы:
Сигнал на покупку:
Цена 3 дня растет → появляется зелёная стрелка ▼ → стратегия покупает.
Стоп-лосс ставится на 0.5% ниже цены входа.
Если цена продолжает расти → сделка закрывается при +0.5% прибыли.
Коррекция:
После роста цена падает на 1 день → фон становится серым → стратегия игнорирует это падение (не закрывает сделку).
Стоп-лосс:
Если цена упала на 0.5% от точки входа → сделка закрывается автоматически.
Важные особенности:
Фильтр коррекций (is_correction):
Это «защита от шума» — стратегия не реагирует на мелкие откаты, работая только в сильных трендах.
Гибкие настройки:
Можно запретить шорты, перевернуть сигналы или изменить уровни прибыли/убытка за 2 клика.
Прозрачность:
Весь код открыт → вы можете увидеть, как формируется каждый сигнал (меню «Исходник» в TradingView).
Советы для новичков:
Начните с теста:
Запустите стратегию на исторических данных (кнопка «Свеча» в окне TradingView).
Посмотрите, как она работала в прошлом.
Настройте под себя:
Увеличьте %Profit до 2-3%, если торгуете валюты.
Отключите «Sell – On», если не понимаете шорты.
Доверяйте стоп-лоссу:
Даже если кажется, что цена развернётся — стратегия закроет сделку при -0.5%, защитив ваш депозит.
Где найти настройки:
Кликните на название стратегии в верхнем левом углу графика → откроется меню с ползунками и переключателями.
Важно: Стратегия предоставляет «рыбу» – чтобы она стала «уловистой», адаптируйте её под свой стиль торговли!

Neon Momentum Waves StrategyIntroduction
The Neon Momentum Waves Strategy is a momentum-based indicator designed to help traders visualize potential shifts in market direction. It builds upon a MACD-style calculation while incorporating an enhanced visual representation of momentum waves. This approach may assist traders in identifying areas of increasing or decreasing momentum, potentially aligning with market trends or reversals.
How It Works
This strategy is based on a modified MACD (Moving Average Convergence Divergence) method, calculating the difference between two Exponential Moving Averages (EMAs). The momentum wave represents this difference, while an additional smoothing line (signal line) helps highlight potential momentum shifts.
Key Components:
Momentum Calculation:
Uses a fast EMA (12-period) and a slow EMA (26-period) to measure short-term and long-term momentum.
A signal line (20-period EMA of the MACD difference) smooths fluctuations.
The histogram (momentum wave) represents the divergence between the MACD value and the signal line.
Interpreting Momentum Changes:
Momentum Increasing: When the histogram rises above the zero line, it may indicate strengthening upward movement.
Momentum Decreasing: When the histogram moves below the zero line, it may signal a weakening trend or downward momentum.
Potential Exhaustion Points: Users can define custom threshold levels (default: ±10) to highlight when momentum is significantly strong or weak.
Visual Enhancements:
The neon glow effect is created by layering multiple plots with decreasing opacity, enhancing the clarity of momentum shifts.
Aqua-colored waves highlight upward momentum, while purple waves represent downward momentum.
Horizontal reference lines mark the zero line and user-defined thresholds to improve interpretability.
How It Differs from Traditional Indicators
Improved Visualization: Unlike standard MACD histograms, this approach provides clearer visual cues using a neon-style wave format.
Customizable Thresholds: Rather than relying solely on MACD crossovers, users can adjust sensitivity settings to better suit their trading style.
Momentum-Based Approach: The strategy is focused on visualizing shifts in momentum strength, rather than predicting price movements.
Potential Use Cases
Momentum Trend Awareness: Helps traders identify periods where momentum appears to be strengthening or fading.
Market Structure Analysis: May complement other indicators to assess whether price action aligns with momentum changes.
Flexible Timeframe Application: Can be used across different timeframes, depending on the trader’s strategy.
Important Considerations
This strategy is purely momentum-based and does not incorporate volume, fundamental factors, or price action confirmation.
Momentum shifts do not guarantee price direction changes—they should be considered alongside broader market context.
The strategy may perform differently in trending vs. ranging markets, so adjustments in sensitivity may be needed.
Risk management is essential—traders should apply proper stop-losses and position sizing techniques in line with their risk tolerance.
Conclusion
The Neon Momentum Waves Strategy provides a visually enhanced method of tracking momentum, allowing traders to observe potential changes in market strength. While not a predictive tool, it serves as a complementary indicator that may help traders in momentum-based decision-making. As with any technical tool, it should be used as part of a broader strategy that considers multiple factors in market analysis.

JMA Quantum Edge: Adaptive Precision Trading System JMA Quantum Edge: Adaptive Precision Trading System - Enhanced Visuals & Risk Management
Get ready to experience a groundbreaking trading strategy that adapts in real-time to market conditions! This powerful, open-source script combines advanced technical analysis with state-of-the-art risk management tools, designed to give you the edge you need in today's dynamic markets.
What It Does:
Adaptive JMA Indicator:
Utilizes a custom Jurik Moving Average (JMA) that adjusts its sensitivity based on market volatility, ensuring you get precise signals even in the most fluctuating environments.
Dynamic Risk Management:
Features built-in support for partial exits (scaling out) to secure profits, along with an optional Kelly Criterion-based position sizing that tailors your exposure based on historical performance metrics.
Robust Error Handling:
Incorporates market condition filters—like minimum volume and maximum allowed gap percentage—to ensure trades are only executed under favorable conditions.
Vivid Visual Enhancements:
Enjoy an animated background that reflects market momentum, dynamic pivot markers, and clearly drawn trend channels. Plus, interactive tables provide real-time performance analytics and detailed error metrics.
Fully Customizable:
With a comprehensive set of inputs, you can easily tailor the strategy to your personal trading style and market preferences. Adjust everything from JMA parameters to refresh intervals for tables and labels!
How to Use It:
Add the Script:
Copy and paste the script into the Pine Script Editor on TradingView and click “Add to Chart.”
Configure Your Settings:
Customize your risk management (capital, commission, position sizing, partial exits, etc.) and tweak the JMA settings to match your preferred trading style. Use the extensive input panel to adjust visuals, alerts, and more.
Backtest & Optimize:
Run the strategy in the Strategy Tester to analyze its historical performance. Monitor real-time analytics and error metrics via the interactive tables, and fine-tune your parameters for optimal performance.
Go Live with Confidence:
Once you're satisfied with the backtest results, use the generated signals for live trading, and let the system help you stay ahead in fast-paced markets!
How to use the imputs:
This cutting-edge strategy is designed to adapt to changing market conditions and offers you complete control over your trading parameters. Here’s a breakdown of what each group of inputs does and how you should use them:
Risk Management & Trade Settings
Recalculate on Every Tick:
What it does: When enabled, the strategy recalculates on every price update.
Recommendation: Leave it true for fast charts.
Initial Capital:
What it does: Sets your starting capital for backtesting, which influences position sizing and performance metrics.
Recommendation: Start with $10,000 (or adjust according to your trading capital).
Commission (%):
What it does: Simulates the cost per trade.
Recommendation: Use a realistic rate (e.g., 0.04%).
Position Size & Quantity Type:
What they do: Define how large each trade will be. Choose between a fixed unit amount or a percentage of equity.
Recommendation: For beginners, the default fixed value is a good start. Experiment later with percentage-based sizing if needed.
Order Comment:
What it does: Adds a label to your orders for easier tracking.
Allow Reverse Orders:
What it does: If disabled, the strategy will close opposing positions before entering a new trade, reducing conflicts.
Enable Dynamic Position Sizing:
What it does: Adjusts trade size based on current volatility.
Recommendation: Beginners may start with this disabled until they understand basic sizing.
Partial Exit Inputs:
What they do:
Enable Partial Exits: When turned on, you can scale out of your position to lock in profits.
Partial Exit Profit (%): The profit percentage that triggers a partial exit.
Partial Exit Percentage: The percentage of your current position to exit. Recommendation: Use defaults (e.g., 5% profit, 50% exit) to secure profits gradually.
Kelly Criterion Option:
What it does: When enabled, adjusts your position sizing using historical performance (win rate and profit factor).
Recommendation: Beginners might leave this disabled until comfortable with backtest performance metrics.
Market Condition Filters:
What they do:
Minimum Volume: Ensures trades occur only when there’s sufficient market activity.
Maximum Gap (%): Prevents trading if there’s an unusually large gap between the previous close and current open. Recommendation: Defaults work well for most markets. If trades seem erratic, consider tightening these limits.
JMA Settings
Price Source:
What it does: The input series for the JMA calculation, typically set to the closing price.
JMA Length:
What it does: Controls the smoothing period of the JMA. Lower values are more sensitive; higher values smooth out the noise. Recommendation: Start with 21.
JMA Phase & Power:
What they do: Adjust how responsive the JMA is. Phase controls timing; power adjusts the intensity. Recommendation: Default settings (63 phase and 3 power) are a balanced starting point.
Visual Settings & Style
Show JMA Line, Pivot Lines, and Pivot Labels:
What they do: Toggle visual elements on your chart for easier signal identification.
Pivot History Count:
What it does: Limits how many historical pivot markers are displayed.
Color Settings (Up/Down Neon Colors):
What they do: Set the visual cues for buy and sell signals.
Pivot Marker & Line Style:
What they do: Choose the style and thickness of your pivot markers and lines.
Show Stats Panel:
What it does: Displays real-time performance and error metrics.
Dynamic Background & Visual Enhancements
Animate Background:
What it does: Changes the background color based on market momentum.
Show Trend Channels & Volume Zones:
What they do: Draw trend channels and highlight areas of high volatility/volume.
Show Data-Rich Labels:
What it does: Displays key metrics like volume, error percentage, and momentum on the chart.
High Volatility Threshold:
What it does: Determines the multiplier for when the chart background should change due to high volatility.
Multi-Timeframe Settings
Higher Timeframe:
What it does: Uses a higher timeframe’s JMA for trend confirmation. Recommendation: Use Daily ('D') or Weekly ('W') for broader trend analysis.
Show HTF Trend Zone & Opacity:
What they do: Display a visual zone from the higher timeframe to help confirm trends.
6. Trailing Stop Settings
Trailing Stop ATR Factor & Offset Multiplier:
What they do: Calculate trailing stops based on the Average True Range (ATR), adjusting stop distances dynamically. Recommendation: Default settings are a good balance but can be fine-tuned based on asset volatility.
Alerts & Notifications
Alerts on Pivot Formation & JMA Crossover:
What they do: Notify you when key events occur.
Dynamic Power Threshold:
What it does: Sets the sensitivity for dynamic alerts.
8. Static Stop Loss / Take Profit
Static Stop Loss (%) & Take Profit (%):
What they do: Allow you to set fixed stop loss or take profit levels. Recommendation: Leave them at 0 to disable if you prefer dynamic risk management, or set them if you have strict risk/reward preferences.
Advanced Settings
ATR Length:
What it does: Determines the period for ATR calculation, impacting trailing stop sensitivity. Recommendation: Start with 14.
Optimization Feedback & Enhanced Error Analysis
Error Metric Length & Error Threshold (%):
What they do: Calculate error metrics (like average error, skewness, and kurtosis) to help you fine-tune the JMA. Recommendation: Use the defaults and adjust if the error metrics seem off during backtesting.
UI - User-Driven Tweaking & Table Customization
Parameter Tweaker Panel, Debug/Performance Table Settings:
What they do: Provide interactive tables that display real-time performance, error metrics, and allow you to monitor strategy parameters.
Refresh Frequency Options (Table & Label Refresh Intervals):
What they do: Set how often the tables and labels update.
Recommendation: Start with an interval of 1 bar; increase it if your chart is too busy.
Important for Beginners:
Default Settings:
All default values have been chosen for balanced performance across different markets. If you ever experience unexpected behavior, start by resetting the inputs to their defaults.
Step-by-Step Adjustments:
Experiment by changing one setting at a time while observing how the strategy’s signals and performance metrics change. This will help you understand the impact of each parameter.
Resetting to Defaults:
If things seem off or you’re not getting the expected results, you can always reset the indicator. Either reload the script or use the “Reset Inputs” option (if available) to revert to the default settings.
Jump in, experiment, and enjoy the power of adaptive precision trading. This strategy is built to grow with your skills—have fun exploring and refining your trading edge!
Happy trading!

Multi-Timeframe RSI Grid Strategy with ArrowsKey Features of the Strategy
Multi-Timeframe RSI Analysis:
The strategy calculates RSI values for three different timeframes:
The current chart's timeframe.
Two higher timeframes (configurable via higher_tf1 and higher_tf2 inputs).
It uses these RSI values to identify overbought (sell) and oversold (buy) conditions.
Grid Trading System:
The strategy uses a grid-based approach to scale into trades. It adds positions at predefined intervals (grid_space) based on the ATR (Average True Range) and a grid multiplication factor (grid_factor).
The grid system allows for pyramiding (adding to positions) up to a maximum number of grid levels (max_grid).
Daily Profit Target:
The strategy has a daily profit target (daily_target). Once the target is reached, it closes all open positions and stops trading for the day.
Drawdown Protection:
If the open drawdown exceeds 2% of the account equity, the strategy closes all positions to limit losses.
Reverse Signals:
If the RSI conditions reverse (e.g., from buy to sell or vice versa), the strategy closes all open positions and resets the grid.
Visualization:
The script plots buy and sell signals as arrows on the chart.
It also plots the RSI values for the current and higher timeframes, along with overbought and oversold levels.
How It Works
Inputs:
The user can configure parameters like RSI length, overbought/oversold levels, higher timeframes, grid spacing, lot size multiplier, maximum grid levels, daily profit target, and ATR length.
RSI Calculation:
The RSI is calculated for the current timeframe and the two higher timeframes using ta.rsi().
Grid System:
The grid system uses the ATR to determine the spacing between grid levels (grid_space).
When the price moves in the desired direction, the strategy adds positions at intervals of grid_space, increasing the lot size by a multiplier (lot_multiplier) for each new grid level.
Entry Conditions:
A buy signal is generated when the RSI is below the oversold level on all three timeframes.
A sell signal is generated when the RSI is above the overbought level on all three timeframes.
Position Management:
The strategy scales into positions using the grid system.
It closes all positions if the daily profit target is reached or if a reverse signal is detected.
Visualization:
Buy and sell signals are plotted as arrows on the chart.
RSI values for all timeframes are plotted, along with overbought and oversold levels.
Example Scenario
Suppose the current RSI is below 30 (oversold), and the RSI on the 60-minute and 240-minute charts is also below 30. This triggers a buy signal.
The strategy enters a long position with a base lot size.
If the price moves against the position by grid_space, the strategy adds another long position with a larger lot size (scaled by lot_multiplier).
This process continues until the maximum grid level (max_grid) is reached or the daily profit target is achieved.
Key Variables
grid_level: Tracks the current grid level (number of positions added).
last_entry_price: Tracks the price of the last entry.
base_size: The base lot size for the initial position.
daily_profit_target: The daily profit target in percentage terms.
target_reached: A flag to indicate whether the daily profit target has been achieved.
Potential Use Cases
This strategy is suitable for traders who want to combine RSI-based signals with a grid trading approach to capitalize on mean-reverting price movements.
It can be used in trending or ranging markets, depending on the RSI settings and grid parameters.
Limitations
The grid trading system can lead to significant drawdowns if the market moves strongly against the initial position.
The strategy relies heavily on RSI, which may produce false signals in strongly trending markets.
The daily profit target may limit potential gains in highly volatile markets.
Customization
You can adjust the input parameters (e.g., RSI length, overbought/oversold levels, grid spacing, lot multiplier) to suit your trading style and market conditions.
You can also modify the drawdown protection threshold or add additional filters (e.g., volume, moving averages) to improve the strategy's performance.
In summary, this script is a sophisticated trading strategy that combines RSI-based signals with a grid trading system to manage entries, exits, and position sizing. It includes features like daily profit targets, drawdown protection, and multi-timeframe analysis to enhance its robustnes

Multi-Band Comparison Strategy (CRYPTO)Multi-Band Comparison Strategy (CRYPTO)
Optimized for Cryptocurrency Trading
This Pine Script strategy is built from the ground up for traders who want to take advantage of cryptocurrency volatility using a confluence of advanced statistical bands. The strategy layers Bollinger Bands, Quantile Bands, and a unique Power-Law Band to map out crucial support/resistance zones. It then focuses on a Trigger Line—the lower standard deviation band of the upper quantile—to pinpoint precise entry and exit signals.
Key Features
Bollinger Band Overlay
The upper Bollinger Band visually shifts to yellow when price exceeds it, turning black otherwise. This offers a straightforward way to gauge heightened momentum or potential market slowdowns.
Quantile & Power-Law Integration
The script calculates upper and lower quantile bands to assess probabilistic price extremes.
A Power-Law Band is also available to measure historically significant return levels, providing further insight into overbought or oversold conditions in fast-moving crypto markets.
Standard Deviation Trigger
The lower standard deviation band of the upper quantile acts as the strategy’s trigger. If price consistently holds above this line, the strategy interprets it as a strong bullish signal (“green” zone). Conversely, dipping below indicates a “red” zone, signaling potential reversals or exits.
Consecutive Bar Confirmation
To reduce choppy signals, you can fine-tune the number of consecutive bars required to confirm an entry or exit. This helps filter out noise and false breaks—critical in the often-volatile crypto realm.
Adaptive for Multiple Timeframes
Whether you’re scalping on a 5-minute chart or swing trading on daily candles, the strategy’s flexible confirmation and overlay options cater to different market conditions and trading styles.
Complete Plot Customization
Easily toggle visibility of each band or line—Bollinger, Quantile, Power-Law, and more.
Built-in Simple and Exponential Moving Averages can be enabled to further contextualize market trends.
Why It Excels at Crypto
Cryptocurrencies are known for rapid price swings, and this strategy addresses exactly that by combining multiple statistical methods. The quantile-based confirmation reduces noise, while Bollinger and Power-Law bands help highlight breakout regions in trending markets. Traders have reported that it works seamlessly across various coins and tokens, adapting its triggers to each asset’s unique volatility profile.
Give it a try on your favorite cryptocurrency pairs. With advanced data handling, crisp visual cues, and adjustable confirmation logic, the Multi-Band Comparison Strategy provides a robust framework to capture profitable moves and mitigate risk in the ever-evolving crypto space.
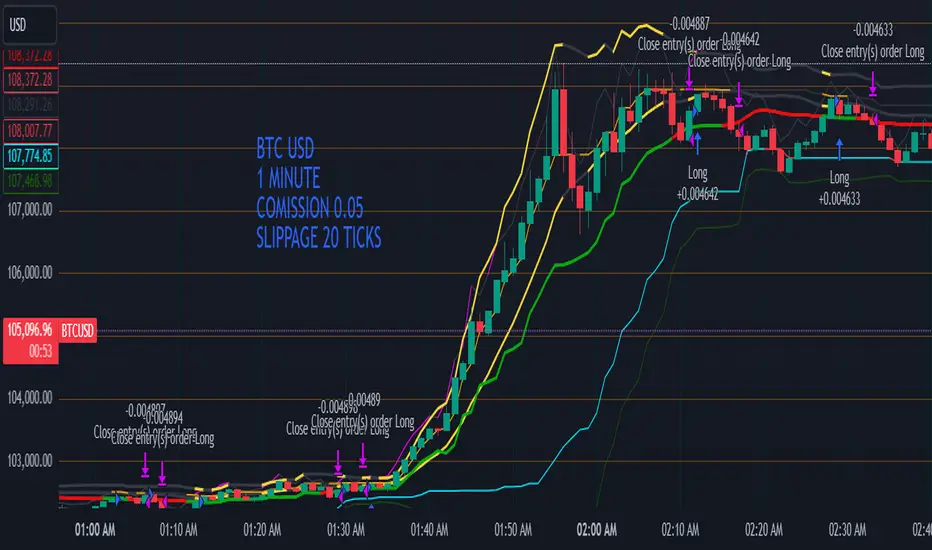
Tomas Ratio Strategy with Multi-Timeframe AnalysisHello,
I would like to present my new indicator I have compiled together inspired by Calmar Ratio which is a ratio that measures gains vs losers but with a little twist.
Basically the idea is that if HLC3 is above HLC3 (or previous one) it will count as a gain and it will calculate the percentage of winners in last 720 hourly bars and then apply 168 hour standard deviation to the weekly average daily gains.
The idea is that you're supposed to buy if the thick blue line goes up and not buy if it goes down (signalized by the signal line). I liked that idea a lot, but I wanted to add an option to fire open and close signals. I have also added a logic that it not open more trades in relation the purple line which shows confidence in buying.
As input I recommend only adjusting the amount of points required to fire a signal. Note that the lower amount you put, the more open trades it will allow (and vice versa)
Feel free to remove that limiter if you want to. It works without it as well, this script is meant for inexperienced eye.
I will also publish a indicator script with this limiter removed and alerts added for you to test this strategy if you so choose to.
Also, I have added that the trades will enter only if price is above 720 period EMA
Disclaimer
This strategy is for educational purposes only and should not be considered financial advice. Always backtest thoroughly and adjust parameters based on your trading style and market conditions.
Made in collaboration with ChatGPT.
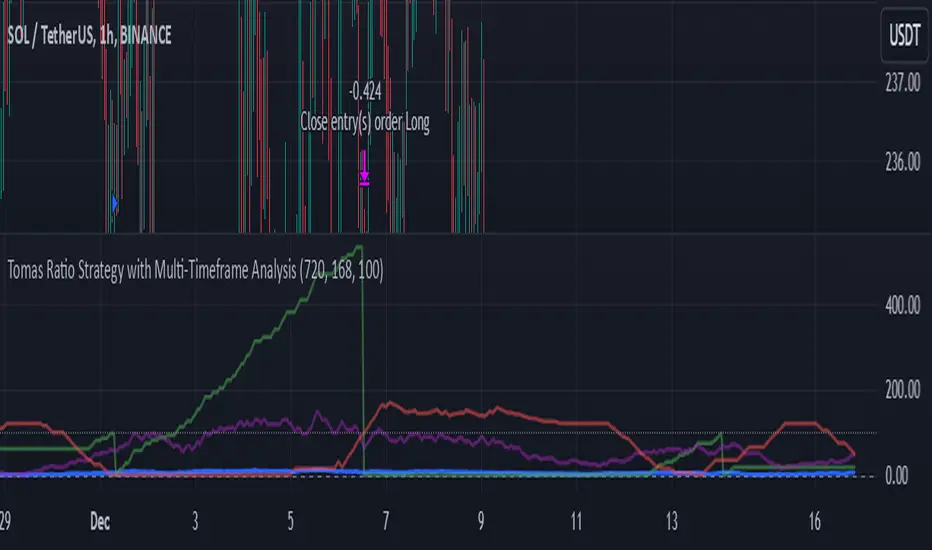
Supertrend and MACD strategyThe Supertrend and MACD Strategy is a comprehensive trading approach designed to capitalize on market trends by using a combination of the Supertrend indicator, the Exponential Moving Average (EMA), and the Moving Average Convergence Divergence (MACD). This strategy aims to identify optimal entry and exit points for both long and short trades, while incorporating strict risk management rules.
Indicators Used:
Supertrend: This indicator is used to identify the overall trend direction. It provides clear signals for trend reversals, helping traders to enter trades in the direction of the prevailing trend.
200-period EMA: This long-term moving average is used to determine the primary trend direction. The strategy only takes long trades when the price is above the 200 EMA and short trades when the price is below it.
MACD: The MACD is used to gauge the momentum and confirm the signals provided by the Supertrend and EMA. It consists of the MACD line, the signal line, and the histogram.
Entry Conditions:
Long Entry:
The Supertrend indicator shows an uptrend (direction > 0).
The MACD line is above the signal line (macd > signal).
The price is above the 200-period EMA (close > ema200).
Short Entry:
The Supertrend indicator shows a downtrend (direction < 0).
The MACD line is below the signal line (macd < signal).
The price is below the 200-period EMA (close < ema200).
Exit Conditions:
Long Exit:
Exit the long position when the MACD line crosses below the signal line (ta.crossunder(macd, signal)).
Set a stop loss (SL) below the lowest low of the last 10 periods (lowestLow - 1).
Short Exit:
Exit the short position when the MACD line crosses above the signal line (ta.crossover(macd, signal)).
Set a stop loss (SL) above the highest high of the last 10 periods (highestHigh + 1).
Risk Management:
The strategy ensures that no new positions are opened if there is already an open trade, preventing overexposure in the market.
Alerts:
Alerts are set to notify traders when the MACD crosses the signal line, providing timely updates for potential exit points.

Adaptive Squeeze Momentum StrategyThe Adaptive Squeeze Momentum Strategy is a versatile trading algorithm designed to capitalize on periods of low volatility that often precede significant price movements. By integrating multiple technical indicators and customizable settings, this strategy aims to identify optimal entry and exit points for both long and short positions.
Key Features:
Long/Short Trade Control:
Toggle Options: Easily enable or disable long and short trades according to your trading preferences or market conditions.
Flexible Application: Adapt the strategy for bullish, bearish, or neutral market outlooks.
Squeeze Detection Mechanism:
Bollinger Bands and Keltner Channels: Utilizes the convergence of Bollinger Bands inside Keltner Channels to detect "squeeze" conditions, indicating a potential breakout.
Dynamic Squeeze Length: Calculates the average squeeze duration to adapt to changing market volatility.
Momentum Analysis:
Linear Regression: Applies linear regression to price changes over a specified momentum length to gauge the strength and direction of momentum.
Dynamic Thresholds: Sets momentum thresholds based on standard deviations, allowing for adaptive sensitivity to market movements.
Momentum Multiplier: Adjustable setting to fine-tune the aggressiveness of momentum detection.
Trend Filtering:
Exponential Moving Average (EMA): Implements a trend filter using an EMA to align trades with the prevailing market direction.
Customizable Length: Adjust the EMA length to suit different trading timeframes and assets.
Relative Strength Index (RSI) Filtering:
Overbought/Oversold Signals: Incorporates RSI to avoid entering trades during overextended market conditions.
Adjustable Levels: Set your own RSI oversold and overbought thresholds for personalized signal generation.
Advanced Risk Management:
ATR-Based Stop Loss and Take Profit:
Adaptive Levels: Uses the Average True Range (ATR) to set stop loss and take profit points that adjust to market volatility.
Custom Multipliers: Modify ATR multipliers for both stop loss and take profit to control risk and reward ratios.
Minimum Volatility Filter: Ensures trades are only taken when market volatility exceeds a user-defined minimum, avoiding periods of low activity.
Time-Based Exit:
Holding Period Multiplier: Defines a maximum holding period based on the momentum length to reduce exposure to adverse movements.
Automatic Position Closure: Closes positions after the specified holding period is reached.
Session Filtering:
Trading Session Control: Limits trading to predefined market hours, helping to avoid illiquid periods.
Custom Session Times: Set your preferred trading session to match market openings, closings, or specific timeframes.
Visualization Tools:
Indicator Plots: Displays Bollinger Bands, Keltner Channels, and trend EMA on the chart for visual analysis.
Squeeze Signals: Marks squeeze conditions on the chart, providing clear visual cues for potential trade setups.
Customization Options:
Indicator Parameters: Fine-tune lengths and multipliers for Bollinger Bands, Keltner Channels, momentum calculation, and ATR.
Entry Filters: Choose to use trend and RSI filters to refine trade entries based on your strategy.
Risk Management Settings: Adjust stop loss, take profit, and holding periods to match your risk tolerance.
Trade Direction Control: Enable or disable long and short trades independently to align with your market strategy or compliance requirements.
Time Settings: Modify the trading session times and enable or disable the time filter as needed.
Use Cases:
Trend Traders: Benefit from aligning entries with the broader market trend while capturing breakout movements.
Swing Traders: Exploit periods of low volatility leading to significant price swings.
Risk-Averse Traders: Utilize advanced risk management features to protect capital and manage exposure.
Disclaimer:
This strategy is a tool to assist in trading decisions and should be used in conjunction with other analyses and risk management practices. Past performance is not indicative of future results. Always test the strategy thoroughly and adjust settings to suit your specific trading style and market conditions.
