Session Sweep Strategy V3Johannes Spezial FVG Indikator :-) zur erkennung von FVG zu definierbaren Sessionzeiten.
Multitimeframe

CT Market Fragility & Systemic Risk Monitor v1.0CT ⊕ Market Fragility & Systemic Risk Monitor v1.0
Systemic Stress & Market Regime Monitor
OVERVIEW
Wall Street-grade structural monitoring now open-source.
CT ⊕ Market Fragility & Systemic Risk Monitor v1.0 is a real-time systemic risk tool designed to detect fragility before it hits price. Built by former institutional traders, it delivers structural insight typically reserved for desks inside hedge funds and global macro desks.
This isn’t about finding entries or exits, it’s about understanding the environment you're trading in, and recognizing when it's shifting.
WHAT IT DOES
• Monitors six key market domains: Equities, Rates/Credit, FX (USD stress), Commodities, Crypto, and Macro
• Detects volatility stress, cross-domain coupling, and regime synchronization
• Classifies market structure into Normal → Fragile → Critical
• Shows a live dashboard with scores, coupling levels, and structural state
• Plots event markers (T1, T2, T3) for structural transitions
• Implements hysteresis logic to model post-stress 'memory
• Supports both single-domain ("Local Mode") and system-wide monitoring
HOW IT WORKS
This engine does not rely on traditional TA. No moving averages. No MACD. No patterns. No guesswork.
Instead, it measures how markets are behaving beneath price detecting when stress is:
• Building internally
• Spreading across domains
• Synchronizing into systemic fragility
T1 (🟠) — Early instability: acceleration in market coupling
T2 (🔵) — Fragile regime: multiple domains simultaneously stressed
T3 (🔴) — Critical regime: synchronized, system-wide stress
These are not buy/sell signals. They are structural regime alerts, the same kind used by institutions to cut risk before stress cascades.
WHY IT MATTERS
Most retail tools are reactive. They interpret surface-level patterns after the move.
This tool is different. It’s proactive – measuring pressure before it breaks structure.
Institutions have used structural fragility models like this for years. This script helps close that gap, giving everyday traders the same early warnings that pros use to reduce exposure and sidestep systemic blowups.
It’s not about finding the edge.
It’s about not getting crushed when the system breaks.
Whether you trade crypto, stocks, FX, or macro, this engine helps answer:
• Is the system stable right now?
• Are stress levels rising across markets?
• Is it time to tighten risk?
Institutions don’t wait for breakouts. They monitor structure.
Now, you can too.
KEY FEATURES
• Works on any asset class and any timeframe
• Fully customizable domain selection
• Three-tier structural alert system (T1–T3)
• Real-time dashboard: stress scores, states, and coupling levels
• Hysteresis modeling: post-stress “memory” detection
• Supports single-domain (local) or multi-domain (systemic) monitoring
• PineScript alerts built-in
RECOMMENDED USE
Active traders - all asset classes
Use the dashboard and T1–T3 alerts to stay aware of structural risk in real time.
Track multi-timeframe alignment to detect where risk originates and how it spreads across markets.
Crypto trader s
Monitor upstream domains (Equities, FX, Rates, Macro) to detect pressure before it reaches crypto.
Identify reflexive stress before Bitcoin reacts — and stay ahead of contagion events.
Macro & systematic traders
Use T1–T3 transitions as volatility filters, exposure governors, or dynamic risk overlays.
Build regime-aware models that adapt to shifting systemic conditions.
Examples & Visuals
Question: Would it have helped to know that at 9:30 on October 9th and again at 10:00 on October 10th that critical states were detected in the structural behavior of Bitcoin? Take a look:
30 min chart BTC shows two distinct T3 (critical) regime detections October 9th and 10:30 October 10th
5m BTC chart reveals high frequency instability for the same period, identifying instability, fragility, criticality
The 30minute BTC chart at 16:30 Friday October 10th,, a few hours after first detecting critical systemic risk
RISK DISCLAIMER
This is a structural analysis tool, not a predictive signal. It does not provide financial advice, trade entries, or forecasts. Use at your own risk. Full disclaimer embedded in the script.
Complexity Trading - From Wall St to Main St
No patterns. No repainting. No mysticism. Just logic, math, science and market structure - now made accessible to everyone.
Developer of LPPL Critical Pulse (LPPLCP), the Temporal Phase Model (TPM) and other
other advanced structural and attractor based systems inspired by Sornette’s LPPL framework and other differentiated thinkers.
Note on Methodology
This tool is not predictive, and not designed for academic publication.
It is a real-time structural monitoring system inspired by academically established concepts,
including LPPL attractor dynamics, cross-asset coupling, reflexivity, and phase regime transitions, implemented within the real-time constraints of PineScript, and intended for visual, exploratory, and diagnostic use.


Renko with Multi-Timeframe RSI (Non-Repaint)This is a Renko-based Multi-Timeframe RSI indicator with Inverted Volatility Oscillator that combines three technical analysis concepts to provide trading signals without repainting issues.
Core Components
1. Renko Chart Foundation
Instead of using time-based candles, this indicator creates Renko bricks based on price movement:
Green brick = Price moved up by one brick size
Red brick = Price moved down by one brick size
Brick size = Either ATR-based (dynamic) or fixed value
Key advantage: Filters out market noise by ignoring time and small price fluctuations
Non-Repaint Feature: Only processes confirmed bars (barstate.isconfirmed), ensuring signals don't disappear or change after they appear.
2. Volume-Weighted RSI (Multiple Timeframes)
Three RSI calculations:
a) Renko RSI (Purple line)
Calculated directly from Renko brick close prices
Shows momentum based on actual brick formations
More stable than traditional RSI since it's based on significant price moves
b) 1-Hour RSI (Blue line)
Standard RSI from 1-hour timeframe
Provides medium-term momentum context
c) 4-Hour RSI (Orange line)
Standard RSI from 4-hour timeframe
Shows longer-term momentum trends
RSI Interpretation:
Above 70: Overbought (potential sell signal)
Below 30: Oversold (potential buy signal)
Above 50: Bullish momentum
Below 50: Bearish momentum
3. Inverted Volatility Oscillator (Yellow line)
Measures the opposite of price volatility in Renko brick closes:
What It Actually Is:
Simply calculates volatility (standard deviation of rate of change)
Normalizes it to 0-100 scale
Inverts it (100 minus volatility)
Result: When prices are volatile, the number is LOW. When prices are calm, the number is HIGH.
This is just repackaged volatility:
Above 80: Low volatility period (calm, stable prices)
50-80: Below-average volatility
20-50: Above-average volatility
Below 20: High volatility period (choppy, erratic prices)
The "Fear/Greed" Marketing: The assumption is that high volatility = panic/fear, and low volatility = complacency/greed. But this is just a narrative wrapper around basic volatility measurement. Markets can be:
Highly volatile during euphoric rallies (not fear)
Very calm during sustained downtrends (not greed)
The relationship between volatility and sentiment is assumed, not measured.
How It Works
Signal Generation
Buy Signals occur when:
Renko RSI < 30 (oversold) OR
1H RSI < 30 OR
4H RSI < 30 OR
Inverted Volatility < 20 (high volatility = "extreme fear")
Sell Signals occur when:
Renko RSI > 70 (overbought) OR
1H RSI > 70 OR
4H RSI > 70 OR
Inverted Volatility > 80 (low volatility = "extreme greed")
Exit Conditions:
Brick color changes (green→red or red→green)
Any RSI enters opposite extreme zone
Multiple confirmations increase signal reliability
What You're Actually Getting
Legitimately Useful:
Renko filtering: Real noise reduction
Multi-timeframe RSI: Valid momentum confirmation across timeframes
Non-repainting: Reliable signal timing
Marketing Fluff: The "Fear/Greed Index" is:
Just normalized, inverted volatility
Given emotional labels to sound sophisticated
Based on an assumption (volatility = fear) that's often wrong
No actual measurement of fear, greed, sentiment, or psychology
Adds no information you couldn't get from a standard volatility indicator
Reality Check
What the indicator claims: "Fear/Greed Index measures market psychology"
What it actually does: Calculates volatility of Renko closes, flips the scale, and slaps emotional labels on different levels
Better description: "Low Volatility Warning" (>80) and "High Volatility Warning" (<20)
The indicator works fine as a multi-timeframe RSI system with Renko smoothing. The volatility component can be useful for identifying regime changes. But calling it "Fear/Greed" is pure marketing - it's just repackaged volatility with psychology buzzwords.
Bottom Line
Use this for:
Renko trend following (genuinely useful)
Multi-timeframe momentum confirmation (valid approach)
Volatility regime detection (what the yellow line actually measures)
Don't use this thinking:
It reads market psychology (it doesn't)
It's measuring actual fear or greed (it isn't)
It's anything more than inverted volatility (it's not)
// ============ DISCLAIMER ============
// EDUCATIONAL PURPOSE ONLY - NOT FINANCIAL ADVICE
// This indicator is provided for educational and informational purposes only.
// It does NOT constitute financial, investment, trading, or any other type of advice.
//
// PAST PERFORMANCE IS NOT INDICATIVE OF FUTURE RESULTS
// No trading system or indicator can guarantee profits or prevent losses.
//
// RISKS:
// - Trading and investing involve substantial risk of loss
// - You can lose some or all of your invested capital
// - Only trade with money you can afford to lose
// - Indicators can produce false signals and lag price action
//
// "FEAR/GREED INDEX" DISCLAIMER:
// The so-called "Fear/Greed Index" is simply inverted normalized volatility.
// It does NOT actually measure fear, greed, sentiment, or market psychology.
// It is a mathematical calculation based on price volatility with emotional
// labels applied for marketing purposes. The relationship between volatility
// and sentiment is ASSUMED, not measured or proven.
//
// NO REPAINTING GUARANTEE:
// While designed to avoid repainting, no indicator is perfect. Always verify
// signals on confirmed bars and test thoroughly before live trading.
//
//(RESPONSIBILITY):
// By using this indicator, you acknowledge that:
// - All trading decisions are your own responsibility
// - You have tested this indicator on historical data
// - You understand the risks involved in trading
// - The creator(s) of this indicator are not liable for any losses
//
// ALWAYS:
// - Do your own research and due diligence
// - Consult with qualified financial professionals
// - Use proper risk management and position sizing
// - Never risk more than you can afford to lose
// - Practice on paper/demo accounts before live trading
// =======================================

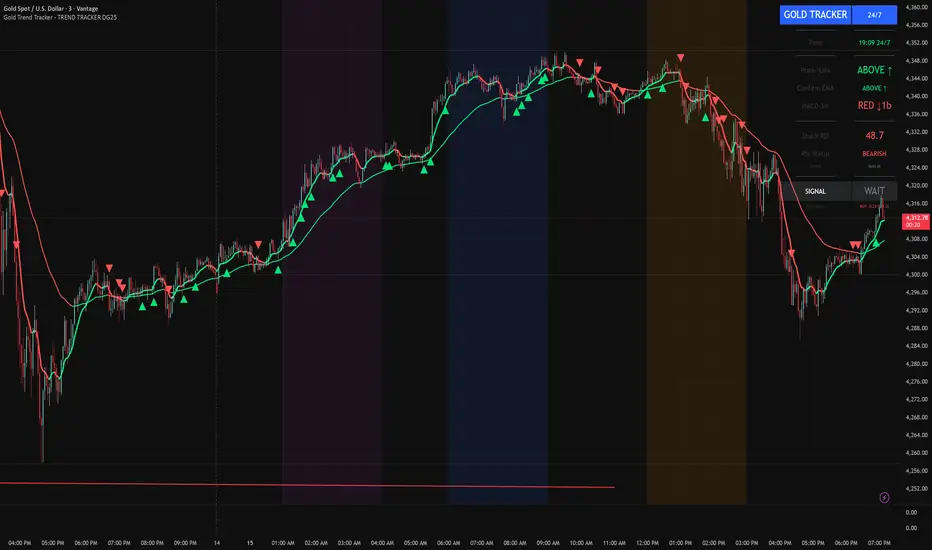
Gold Trend Tracker - TREND TRACKER DG25Gold Trend Tracker - Complete All-In-One Trading System
A professional, institutional-grade trading system specifically optimized for Gold (XAU/USD) that combines multiple technical indicators with session-based filtering and real-time performance tracking. No external indicators required - everything you need is built right in!
🎯 CORE FEATURES
Multi-Layered Confirmation System:
Dynamic EMA trend filter (default 10-period) with color-coded visualization
Optional secondary confirmation EMA (21-period) for stronger validation
3-minute MACD analysis with histogram tracking and direction monitoring
MACD bounce detection for high-probability continuation entries
Built-in Stochastic RSI (K=3, D=3, RSI Length=14, Stochastic Length=14)
Option to connect external Stochastic RSI if preferred
Intelligent Signal Generation:
Clear BUY/SELL triangles plotted directly on price chart
Minimum bars filter to eliminate signal spam and overtrading
Higher timeframe signal overlay (optional) - see 3min signals on 15min chart
Visual Stochastic RSI threshold cross markers (customizable shapes & sizes)
"Show Only First Cross" option to reduce visual clutter
Comprehensive alert system for all signal types
Advanced Session Management:
Pre-configured trading sessions: Asian (1-4am), London (6-9am), NY (12-3pm)
Timezone-aware filtering supporting major financial centers:
Europe/London
America/New_York
America/Chicago
Europe/Paris
Asia/Tokyo
Asia/Dubai
Color-coded session backgrounds (purple/blue/orange)
Individual session toggle switches
24/7 mode for continuous trading (crypto/forex)
Signals only generate during active sessions
Real-Time Performance Tracking:
Live P/L calculation since last signal entry
Customizable lot size for accurate dollar calculations
Pip movement tracking with automatic conversion
Last signal type and duration display
Performance color-coding (green profits, red losses)
Professional Dashboard:
Clean, scalable interface (Small/Medium/Large sizing)
Current time and active session display
Trading status indicator (TRADING/PAUSED/24/7)
Price position relative to Main EMA (ABOVE ↑ / BELOW ↓)
Confirmation EMA status (when enabled)
3-minute MACD color, direction arrow, and bar count
Stochastic RSI value with color-coded status
RSI status: BULLISH/BEARISH/NEUTRAL
Source type indicator (Built-in/External)
Large, clear SIGNAL display: BUY NOW / SELL NOW / WAIT
Performance summary: signal type + price change + dollar value
📊 HOW THE SYSTEM WORKS
BUY Signal Requirements:
✓ Price trading ABOVE main EMA (bullish trend confirmation)
✓ 3-minute MACD crosses above zero OR bounces higher after crossover
✓ Stochastic RSI K-line above bullish threshold (default 50)
✓ Within an active trading session (if session filter enabled)
✓ Confirmation EMA aligned (if secondary EMA enabled)
✓ Minimum bars since last signal met (prevents overtrading)
SELL Signal Requirements:
✓ Price trading BELOW main EMA (bearish trend confirmation)
✓ 3-minute MACD crosses below zero OR bounces lower after crossover
✓ Stochastic RSI K-line below bearish threshold (default 50)
✓ Within an active trading session (if session filter enabled)
✓ Confirmation EMA aligned (if secondary EMA enabled)
✓ Minimum bars since last signal met (prevents overtrading)
Multi-Confirmation Philosophy:
This system requires ALL conditions to align before generating a signal. This drastically reduces false signals and increases win rate by only trading the highest-probability setups where trend, momentum, and volume all confirm direction.
⚙️ BUILT-IN STOCHASTIC RSI
No External Dependencies:
The indicator includes a fully functional Stochastic RSI calculation based on the standard TradingView formula. No need to hunt for compatible indicators or worry about settings mismatches.
Default Settings (Optimized for Gold):
K Smoothing: 3
D Smoothing: 3
RSI Length: 14
Stochastic Length: 14
Bullish Threshold: 50
Bearish Threshold: 50
How It Works:
Calculates RSI on price data
Applies Stochastic formula to RSI values
Smooths result with K-period SMA
Uses K-line (not D-line) for cleaner, faster signals
Compares to your bullish/bearish thresholds
Generates visual cross markers when thresholds breached
Visual Markers:
Multiple shape options: Circle, Diamond, Square, Cross
Four size options: Tiny, Small, Normal, Large
Customizable colors for bullish/bearish crosses
"Show Only First Cross" prevents repetitive markers
Appears below bars (bullish) or above bars (bearish)
Flexibility:
Switch to "External" mode to connect your own Stochastic RSI indicator
Adjust all calculation parameters to match your trading style
Completely disable the filter if you prefer trend + MACD only
🎨 CUSTOMIZATION OPTIONS
Indicators:
Adjust Main EMA length (default 10)
Enable/disable Confirmation EMA (default OFF)
Set Confirmation EMA length (default 21)
Modify MACD parameters (Fast 5, Slow 14, Signal 9)
Enable/disable MACD bounces (default ON)
Set max bounces per trend (1-10, default 2)
Stochastic RSI:
Choose Built-in or External source
Adjust K/D smoothing periods
Modify RSI and Stochastic lengths
Set custom bullish/bearish thresholds
Configure cross marker appearance
Toggle dashboard display
Signals:
Show/hide signal triangles
Set minimum bars between signals (0-50, default 5)
Enable higher timeframe signal overlay
Choose HTF timeframe (e.g., 3min on 15min chart)
Sessions:
Enable/disable session filtering
Select your timezone
Toggle individual sessions (Asian/London/NY)
Customize session start/end hours
Show/hide session background colors
Display:
Choose dashboard size (Small/Medium/Large)
Adjust all visual elements
Customize colors and styling
💡 PRO TRADING TIPS
Session Optimization:
London Session (6-9am): Highest volatility, best for breakout trades
NY Session (12-3pm): Strong trends, ideal for momentum continuation
Avoid Asian Session (1-4am): Lower liquidity, choppier price action
Overlap Period (12-3pm London time): Peak volume, clearest signals
Signal Filtering:
Set 3-5 bars minimum between signals to avoid overtrading
Higher values (7-10 bars) for more conservative, swing-style entries
Lower values (1-3 bars) for aggressive scalping during high volatility
Confirmation EMA Usage:
Enable in choppy/ranging markets for extra validation
Disable during strong trending conditions (adds lag)
Set to 21 for short-term trends, 50 for medium-term
MACD Bounce Strategy:
Bounces occur when MACD histogram changes direction after crossover
Max 2 bounces = optimal (catches first continuation)
Max 1 bounce = conservative (only initial momentum shift)
Max 3-5 bounces = aggressive (catches multiple waves)
Stochastic RSI Thresholds:
50/50 = Balanced (default, works for most conditions)
30/70 = Conservative (fewer but stronger signals)
60/40 = Aggressive (more signals, requires tighter stops)
Adjust based on current market volatility
Risk Management:
Use the performance tracker to trail stops
Exit when dashboard shows opposite signal forming
Monitor MACD direction arrows for momentum shifts
Set profit targets based on average session ranges
🚀 QUICK START GUIDE
For Beginners:
Add indicator to 3-minute Gold (XAU/USD) chart
Leave all default settings (everything is pre-optimized)
Enable London session (6-9am) and NY session (12-3pm)
Set your timezone to your location
Wait for BUY/SELL triangle + "BUY NOW"/"SELL NOW" on dashboard
Enter trade when ALL conditions align
Exit on opposite signal or dashboard status change
For Advanced Traders:
Optimize EMA lengths for your preferred timeframe
Adjust Stochastic RSI thresholds based on backtesting
Fine-tune MACD bounce count for your risk tolerance
Enable Confirmation EMA for extra validation
Use HTF signal overlay for multi-timeframe confluence
Set signal filter to match your trading frequency
Customize session times for your specific market focus
📈 BEST TIMEFRAMES
Primary: 3-minute chart (system is MACD-optimized for 3min)
Alternative: 5-minute, 15-minute (adjust signal filter accordingly)
NOT Recommended: 1-minute (too noisy), 1-hour+ (signals too infrequent)
Chart Setup:
Main Chart: Your preferred timeframe (3min recommended)
MACD: Always references 3-minute data internally
Stochastic RSI: Calculates on current chart timeframe
Session Filter: Works on any timeframe
✅ WHAT MAKES THIS SYSTEM UNIQUE
All-In-One Solution:
✓ No hunting for compatible external indicators
✓ No configuration headaches or version conflicts
✓ One indicator = complete trading system
Session Intelligence:
✓ Only trades during optimal liquidity periods
✓ Automatically pauses during low-volume sessions
✓ Timezone-aware for global traders
Multi-Confirmation:
✓ Trend (EMA) + Momentum (MACD) + Volume (Stochastic RSI)
✓ Drastically reduces false signals
✓ Higher win rate through layered validation
Performance Transparency:
✓ Real-time P/L tracking on every trade
✓ Know your performance immediately
✓ Data-driven decision making
Professional Grade:
✓ Clean, institutional-style dashboard
✓ Customizable for any trading style
✓ Comprehensive alert system
⚠️ IMPORTANT NOTES
This is NOT a "Holy Grail":
No indicator is 100% accurate
Requires proper risk management
Works best during trending conditions
May produce whipsaws in choppy/ranging markets
Risk Disclosure:
Always use stop losses
Never risk more than 1-2% per trade
Past performance doesn't guarantee future results
Practice on demo account first
Optimization:
Default settings are optimized for Gold (XAU/USD)
May require adjustment for other instruments
Backtest on your specific market before live trading
Different session times may work better for your timezone
🔔 ALERTS INCLUDED
BUY Signal Alert
SELL Signal Alert
Stochastic RSI Cross Above Threshold
Stochastic RSI Cross Below Threshold
Alert Setup:
Click "Create Alert" button
Select desired alert condition
Choose notification method (popup/email/SMS/webhook)
Never miss a high-probability setup!
💬 SUPPORT & UPDATES
This indicator is actively maintained and updated based on user feedback. Future updates may include:
Additional timeframe options
More session presets
Enhanced performance analytics
Multi-asset optimization
Tags: Gold Trading, XAU/USD, Trend Following, MACD Strategy, Stochastic RSI, Session Trading, Day Trading, Scalping, London Session, New York Session, EMA System, Multi-Timeframe Analysis, Trading Dashboard, Performance Tracking
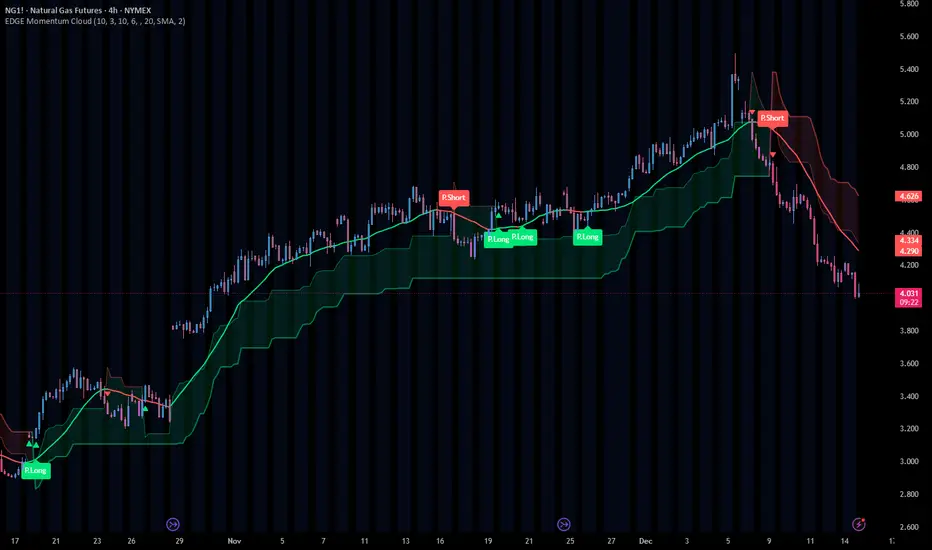
EDGE Momentum Cloud═════════════════════════════════════════════════════════════
EDGE MOMENTUM CLOUD
═════════════════════════════════════════════════════════════
█ OVERVIEW
The EDGE Momentum Cloud is a confluence-based trading system that combines adaptive volatility zones with trend direction analysis to identify high-probability trade setups. Rather than relying on a single indicator, this tool creates a visual "momentum zone" that helps traders understand the current market regime while filtering signals through trend confirmation.
The indicator generates two tiers of signals:
• Standard Signals — Based on trend direction changes
• Premium Signals — Require additional confluence with momentum zone positioning
Premium signals represent higher-conviction setups where multiple factors align.
█ HOW IT WORKS
The EDGE Momentum Cloud combines two core components working together:
❶ MOMENTUM ZONE (CLOUD)
Two ATR-based trailing bands create a dynamic volatility envelope
❷ TREND FILTER
A customizable moving average determines trend direction
❸ SIGNAL ENGINE
Evaluates confluence between trend changes and zone positioning
█ THE MOMENTUM ZONE EXPLAINED
At the core of this indicator are two ATR-based trailing bands that form the "momentum zone":
INNER BAND (FAST)
• Tighter trailing stop using a smaller ATR multiplier (default: 3.0×)
• Reacts quickly to price changes
• Defines the near-term momentum boundary
OUTER BAND (SLOW)
• Wider trailing stop using a larger ATR multiplier (default: 6.0×)
• Provides a more forgiving boundary
• Represents the broader momentum envelope
The space between these bands creates the Momentum Zone —a visual cloud that expands during volatile conditions and contracts during consolidation.
ZONE COLOR INTERPRETATION:
• Green Zone = Bullish bias (bands trailing below price)
• Red Zone = Bearish bias (bands trailing above price)
█ THE TREND FILTER EXPLAINED
A customizable moving average acts as the trend direction filter. When the trend line changes direction (turns up or down), the indicator evaluates whether conditions support a trade signal.
The trend filter supports 13 different calculation methods , allowing you to match the indicator's responsiveness to your trading style:
SMA • EMA • WMA • HMA • VWMA • RMA • LSMA
TMA • DEMA • TEMA • DWMA • SSMA • MEDIAN
Direction is determined by comparing the current value to a previous value (controlled by Direction Smoothing). Higher smoothing values reduce noise and false direction changes.
█ SIGNAL LOGIC
┌────────────────────────────────────────────────────────────
│ STANDARD SIGNALS
├────────────────────────────────────────────────────────────
│ These trigger when the trend filter changes direction:
│
│ LONG — Trend filter turns from falling to rising
│ SHORT — Trend filter turns from rising to falling
│
│ Standard signals indicate a potential trend change but
│ do not require zone confluence.
└────────────────────────────────────────────────────────────
┌────────────────────────────────────────────────────────────
│ PREMIUM SIGNALS
├────────────────────────────────────────────────────────────
│ These require confluence between trend change AND
│ favorable positioning relative to the momentum zone:
│
│ PREMIUM LONG
│ • Trend turns up while filter is ABOVE the zone, OR
│ • Price breaks into/out of zone during recent bullish trigger
│
│ PREMIUM SHORT
│ • Trend turns down while filter is BELOW the zone, OR
│ • Price breaks into/out of zone during recent bearish trigger
│
│ Premium signals have built-in confluence and typically
│ offer better risk/reward setups.
└────────────────────────────────────────────────────────────
█ VISUAL ELEMENTS
ZONE COMPONENTS
• Inner Band — Fast trailing stop (thin line)
• Outer Band — Slow trailing stop (thick line)
• Zone Fill — Shaded area between bands showing momentum regime
TREND COMPONENTS
• Trend Line — Moving average with slope-based coloring
• Green = Rising trend
• Red = Falling trend
• Purple = Neutral (if color by direction disabled)
SIGNAL MARKERS
• Triangle Up + "Long" — Standard long signal
• Triangle Down + "Short" — Standard short signal
• Label Up + "P.Long" — Premium long signal
• Label Down + "P.Short" — Premium short signal
CROSS MARKERS
• Small triangles appear when price crosses the inner or outer bands
• Up triangles = Price crossing above band
• Down triangles = Price crossing below band
BAR COLORING
• Teal bars = Price above the zone (bullish territory)
• Pink bars = Price below the zone (bearish territory)
• Purple bars = Price inside the zone (transitional)
█ CONFIGURABLE SETTINGS
┌────────────────────────────────────────────────────────────
│ GENERAL SETTINGS
├────────────────────────────────────────────────────────────
│ Confirmed Signals Only (Default: ON)
│ • When enabled, signals wait for bar close before triggering
│ • Prevents repainting on live bars
│ • Recommended: Keep ON for live trading
│
│ Display Standard Signals (Default: ON)
│ • Show/hide basic trend-change signals
│
│ Display Premium Signals (Default: ON)
│ • Show/hide confluence-based signals
│
│ Tint Price Bars (Default: ON)
│ • Color bars based on position relative to zone
└────────────────────────────────────────────────────────────
┌────────────────────────────────────────────────────────────
│ MOMENTUM ZONE SETTINGS
├────────────────────────────────────────────────────────────
│ Fast ATR Length (Default: 10)
│ • Lookback period for inner band's ATR calculation
│ • Lower = More reactive to recent volatility
│ • Higher = Smoother, less reactive
│
│ Fast Band Factor (Default: 3.0)
│ • Multiplier for inner band distance from price
│ • Lower = Tighter band, more signals
│ • Higher = Wider band, fewer signals
│
│ Slow ATR Length (Default: 10)
│ • Lookback period for outer band's ATR calculation
│
│ Slow Band Factor (Default: 6.0)
│ • Multiplier for outer band distance from price
│ • Should be larger than Fast Band Factor
│ • Creates the width of the momentum zone
└────────────────────────────────────────────────────────────
┌────────────────────────────────────────────────────────────
│ TREND FILTER SETTINGS
├────────────────────────────────────────────────────────────
│ Display Trend Line (Default: ON)
│ • Show/hide the moving average line
│
│ Resolution (Default: Chart Timeframe)
│ • Timeframe for MA calculation
│ • Leave blank to use current chart timeframe
│ • Set higher timeframe for broader trend alignment
│
│ Lookback Period (Default: 20)
│ • Moving average period length
│ • Lower = Faster, more signals
│ • Higher = Slower, fewer signals
│
│ Calculation Method (Default: SMA)
│ • Choose from 13 MA types
│ • HMA and TEMA are faster/more responsive
│ • SMA and TMA are slower/smoother
│
│ Direction Smoothing (Default: 2)
│ • Bars to look back for slope comparison
│ • Higher values reduce false direction changes
│ • Range: 1-10
│
│ Color By Direction (Default: ON)
│ • Color the trend line based on its slope
└────────────────────────────────────────────────────────────
┌────────────────────────────────────────────────────────────
│ VISUAL SETTINGS
├────────────────────────────────────────────────────────────
│ Bullish Color — Color for bullish elements (default: green)
│ Bearish Color — Color for bearish elements (default: red)
│ Neutral Color — Color for neutral/transitional states
│ Zone Fill — Opacity for the momentum zone fill
└────────────────────────────────────────────────────────────
█ ALERTS
This indicator includes five configurable alerts:
① STANDARD LONG
Triggers on basic bullish trend change signal
② STANDARD SHORT
Triggers on basic bearish trend change signal
③ PREMIUM LONG
Triggers on high-confluence bullish signal
④ PREMIUM SHORT
Triggers on high-confluence bearish signal
⑤ ANY SIGNAL
Triggers on any of the above conditions
To enable alerts:
1. Right-click on the indicator → "Add Alert"
2. Select the condition you want to be alerted on
3. Configure notification method (popup, email, webhook, etc.)
█ RECOMMENDED USAGE
TIMEFRAME
• Works on any timeframe
• Lower timeframes (1m-15m) generate more signals
• Higher timeframes (1H-Daily) generate fewer, higher-quality signals
BEST PRACTICES
• Keep "Confirmed Signals Only" enabled for live trading
• Premium signals typically offer better risk/reward than Standard
• Use zone position as context—bullish setups above zone, bearish below
• Consider higher timeframe resolution for trend filter to align with broader trend
• Combine with support/resistance or supply/demand for complete trade plans
INTERPRETATION TIPS
• Wide zones suggest increased volatility
• Narrow zones suggest consolidation
• Cross markers at bands can serve as early warnings of regime changes
• Bar colors provide quick visual reference of market position
█ SIGNAL QUALITY GUIDE
┌─────────────────┬────────────────────────────────────────┐
│ HIGHEST QUALITY │ Premium signal + Price clearly │
│ │ positioned on correct side of zone │
├─────────────────┼────────────────────────────────────────┤
│ GOOD QUALITY │ Premium signal + Price inside zone │
├─────────────────┼────────────────────────────────────────┤
│ MODERATE │ Standard signal + Price on correct │
│ │ side of zone │
├─────────────────┼────────────────────────────────────────┤
│ LOWER QUALITY │ Standard signal + Price on wrong │
│ │ side or inside zone │
└─────────────────┴────────────────────────────────────────┘
█ Final Note
This Indicator was designed specifically for the ATR cloud and the levels it provides. The buy and sell signals are a byproduct of development but more of a secondary feature. This product is published so you can take advantage of the proprietary calculations we used to make our own ATR cloud that provides excellent areas of support and resistance.
PLEASE NOTE: The "EDGE MTF ATR Bias Matrix" study that supplies the table notifying you of support and resistance is made through these ATR calculations and would pair perfectly with this study.
█ DISCLAIMER
This indicator is provided for educational and informational purposes only. It is not financial advice and should not be construed as a recommendation to buy or sell any financial instrument.
The signals generated by this indicator are based on technical analysis calculations and do not guarantee any specific outcome. Always conduct your own analysis and use proper risk management.
Danny Gee EMA Trend RibbonDanny Gee EMA Trend Ribbon - Multi-Timeframe Trend Analysis
A sophisticated 9-EMA ribbon system designed to visualize trend strength and direction with precision. This indicator creates a dynamic color-coded ribbon that adapts to market conditions, making trend identification effortless.
Key Features:
9 Customizable EMAs - Default periods: 8, 14, 20, 26, 32, 38, 44, 50, and 60
Intelligent Ribbon Coloring - Automatically displays bullish (green), bearish (red), or neutral (gray) based on EMA consensus
Smoothing Control - Adjustable smoothing period (default 2) reduces noise and false signals
Real-Time Trend Status - Live dashboard showing current trend state and EMA agreement count (e.g., "Bullish 8/9")
Visual Clarity - Color-coded EMA lines with the 60 EMA highlighted for key support/resistance
How It Works:
The indicator analyzes the slope direction of all 9 EMAs. When 7 or more EMAs agree on direction, the ribbon displays a clear bullish or bearish color. This consensus-based approach helps filter out weak or conflicting trends, keeping you focused on high-probability setups.
Best Used For:
✓ Identifying strong trending conditions
✓ Avoiding choppy, sideways markets
✓ Confirming trade direction with other indicators
✓ Multi-timeframe analysis (works on any chart timeframe)
Customization Options:
Adjust all EMA periods to match your trading style
Customize ribbon colors for personal preference
Toggle ribbon visibility on/off
Modify smoothing sensitivity
Perfect for swing traders, scalpers, and day traders looking for a clean, reliable trend filter that works across all markets - forex, crypto, stocks, and indices.

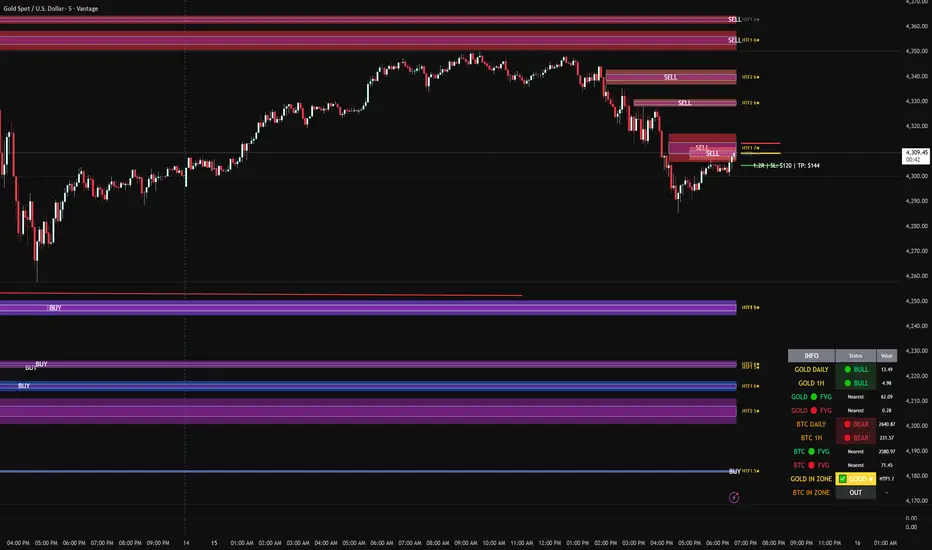
FVG DUAL HTF ALERTS - DG - FVG Dual HTF ALERTS DG - Confluence & Strength
Professional Fair Value Gap (FVG) Trading Indicator with Advanced HTF Analysis
This powerful indicator identifies and tracks Fair Value Gaps across two customizable higher timeframes (HTF), providing traders with precise entry zones, strength ratings, and real-time alerts for high-probability trading setups.
🎯 KEY FEATURES
Dual HTF Analysis
Two independent HTF settings - Analyze FVGs from any timeframe (1min to Daily)
Works on ALL timeframes - View 15min and 60min FVGs on your 1min chart
HTF confluence detection - Automatically highlights when both HTFs align
Customizable colors - Distinct colors for HTF1 and HTF2 zones
Intelligent Strength Scoring (0-10)
Each FVG receives a comprehensive strength rating based on:
Gap size relative to ATR
Volume analysis vs 20-period average
Current timeframe FVG confluence (★ indicator)
Trading session timing (London/NY sessions)
Large gap bonus
HTF confluence bonus
Rating System:
8-10 = 🔥 PREMIUM (Green) - Highest probability setups
5-7 = ✅ GOOD (Yellow) - Quality opportunities
0-4 = ⚠️ WEAK (Gray) - Lower confidence zones
Sweet Spot Inner Boxes
Precision entry zones - 10% inner box (customizable 1-50%)
BUY/SELL labels - Clear directional indicators
Customizable styling - Colors, borders, and text size
Entry optimization - Target the highest probability area within each FVG
Advanced Trading Tools
Automatic Entry/Stop/Target Lines - Up to 3 closest FVGs displayed simultaneously
Risk/Reward calculator - Shows R multiples and dollar values
Customizable position sizing - Micro, mini, or standard lots
Entry offset adjustment - Fine-tune entries ±50 pips from sweet spot center
Smart Fill Detection
HTF candle-based fills - Only checks for fills on HTF candle closes (not every lower TF bar)
Multiple fill methods:
Any Touch - Most sensitive
Midpoint Reached - Balanced
Wick Sweep - Conservative (default)
Body Beyond - Most strict
Touched tracking - Visual feedback when zones are tested
Comprehensive Alert System
8 Individual Alerts:
HTF1: Bullish/Bearish Zone Entry
HTF1: BUY/SELL Sweet Spot Entry
HTF2: Bullish/Bearish Zone Entry
HTF2: BUY/SELL Sweet Spot Entry
4 Combined Alerts:
ANY HTF: Bullish/Bearish Zone Entry
ANY HTF: BUY/SELL Sweet Spot Entry
Plus: Optional alerts for high-strength FVGs (8+)
Information Dashboard
Real-time market context display:
Gold Daily & 1H - Bullish/bearish bias with range in pips
Distance to nearest FVGs - Bull and bear zones
IN ZONE indicator - Shows when price enters sweet spots with strength rating
Optional BTC tracking - Monitor Bitcoin FVGs and bias simultaneously
⚙️ CUSTOMIZATION OPTIONS
Display Settings
Max FVGs to show per type (1-100)
Show only untouched FVGs option
Center line styling (solid/dashed/dotted)
Label visibility and colors
Strength color coding
Trading Parameters
Stop loss (1-100 pips)
Take profit (1-200 pips)
Entry offset adjustment
Lot size (0.01-100)
Dollar value display toggle
Advanced Options
Min strength filter (0-10)
Current TF confluence check
Lookback period (20-200 bars)
Max bars back (1-5000)
Require body close through gap
Test mode: Disable fill removal
💡 IDEAL FOR
Scalpers - 1min/3min charts viewing 5min/15min FVGs
Day Traders - 5min/15min charts viewing 15min/60min FVGs
Swing Traders - 1H/4H charts viewing 4H/Daily FVGs
Gold (XAU/USD) traders - Built-in gold bias indicators
Multi-timeframe analysis - See the bigger picture while trading lower TFs
🎓 HOW TO USE
Add to chart - Works best on 1-5min charts for intraday trading
Set your HTFs - Recommended: 15min + 60min for scalping
Watch for confluence - Green/orange borders indicate HTF alignment
Filter by strength - Focus on 8+ rated zones for best probability
Enter at sweet spots - Wait for price to reach inner boxes
Set alerts - Get notified when price enters high-quality zones
Manage risk - Use provided entry/stop/target lines
📊 BEST PRACTICES
✅ DO:
Focus on 8+ strength FVGs during London/NY sessions
Look for HTF confluence (lime/orange borders)
Wait for sweet spot entries (inner boxes)
Trade in the direction of HTF bias
Use multiple timeframe confirmation
❌ DON'T:
Trade low-strength FVGs (below 5) unless confirmed
Ignore the HTF bias indicators
Chase price - let it come to the zones
Trade without stops
Overtrade - quality over quantity
🔧 TECHNICAL NOTES
Max 500 boxes/lines/labels - Optimized for performance
Lookahead enabled - Accurate HTF data on lower timeframes
No repainting - All signals confirmed on bar close
Compatible with all brokers - Works on any instrument with FVGs
Mobile friendly - Clean display on all devices
📈 PERFORMANCE TIPS
For best results on lower timeframes (1min/3min):
Set "Max Bars Back" to 2000-3000
Set "Max FVGs Per Type" to 20-50
Use "Body Beyond" fill method for longer zone visibility
Enable "Check Current TF FVGs" for additional confluence
🎨 COLOR RECOMMENDATIONS
HTF1 (15min):
Bull: Blue (#2962FF80)
Bear: Red (#f2364580)
HTF2 (60min):
Bull: Purple (#9C27B080)
Bear: Light Red (#FF6B6B80)
Confluence:
Bull: Green (#00FF0060)
Bear: Orange (#FF6B0060)
💬 SUPPORT
Created by DJG9911
For questions, feature requests, or bug reports, please use the TradingView comments section.
Version: 6.0
License: Mozilla Public License 2.0
Last Updated: December 2024
Disclaimer: This indicator is for educational and informational purposes only. Always practice proper risk management and never risk more than you can afford to lose. Past performance does not guarantee future results.
MultiTimeFrame SMA/EMA & clouds [PACHI]This will allow you to plot multiple moving averages and clouds for the current timeframe and also up to 5 from different timeframes

[AlscapeLabs] HTF Candle Stack (Multi-Timeframe)
Overview
The HTF Candle Stack (Multi-TF) indicator is a powerful visualization tool designed to overlay high-timeframe (HTF) price action directly onto your current chart, independent of the chart's price scale. This gives traders a clear, aligned, and non-overlapping view of simultaneous price movements across customizable timeframes.
By stacking the candles horizontally next to the chart's price action, the indicator allows for quick identification of multi-timeframe correlation, trend confluence, and key levels without switching chart timeframes.
Key Features
6 Independent Stacks: Configure up to 6 separate timeframes (e.g., 5m, 15m, 1H, 4H, Daily, Weekly) to view the complete market fractals from micro to macro.
Price-Aligned Visualization : All HTF candle stacks are perfectly aligned with the main chart's vertical price axis
Replay Mode Safe : Includes dedicated logic to prevent "duplicate candles" during Bar Replay, ensuring accurate backtesting and historical analysis.
Toggleable Stacks : Each stack can be individually enabled or disabled via input settings
Dynamic Spacing : The distance between active stacks is automatically calculated and adjusted based on the visibility of the preceding stack.
Settings Guide
Stack Configuration (1 - 6)
Each of the six stacks has identical controls:
Show/Hide : Enable or disable this specific stack.
Timeframe : The specific HTF to display (e.g., "60" for 1 Hour, "D" for Daily).
[*} Count : How many candles to show in this stack (Current Active Candle + Past Closed Candles). Tip: Use higher counts (10-12) for lower TFs (Stack 1-2) and lower counts (2-4) for higher TFs (Stack 5-6)
Candle Color
Controls global coloring
Bullish / Bearish : Customize the body colors.
Wick : Separate control for wick color and transparency
Layout
Distance from Chart : How far (in bars) to the right the first stack begins
Space between Stacks : The gap (in bars) between each active stack.
Candle Width : The thickness of the HTF candles.
Labels
Displays a time-frame next to the active (live) candle in each stack
Show TF Labels : Enable or disable labels through all stacks
Text Color : Label text color
Background : Label background color
Style : Label position (Left, Down)
Size : Label text size (Tiny, Small, Normal, Large, Huge)
Developed by AlscapeLabs

Chartology Strategy+🔍 Chartology Strategy+
This tool provides a comprehensive way for users to analyze trend levels and access other Matrix features across selected tickers and timeframes. Results can be tailored by strategy, with the option to filter displayed tickers based on custom user‑defined rules.
Bullish & Bearish Entry Signal (Safe & Scalping).
Entry Level, SL, T-SL & Two TP Levels (Based on Possible Movement).
Dashboard Table for Easy Presentation of All Levels.
Timeframe Scanner for Current Signal (Trend) on Different Timeframes.
Gap Up & Gap Down for Untraded Price Marking.
Institutional Candles for High Volume and Big Price Movement.
Neutral Candle for Low Volume and Small Price Movement.
Supply Demand (Based on Swing High & Low).
Mega Trend Band (Based on HMA) for Overall Trend.
🟢 Bullish & Bearish Entry Signals
Shows the expected direction of the symbol. It shows Bullish and Bearish direction mark on Chart. Entry Level is Closing of the Candle.
Input Settings
Signal Type: Safe
Appears after a proper trend confirmation.
Low frequency, fewer signals, but more reliable.
Best for swing traders who want strong confirmation before entering.
Signal Type: Scalping
Appears frequently during small downward moves.
High frequency, quick signals for short-term trades.
Best for intraday
Traders who want multiple opportunities in small movements.
🎯 Entry Level, SL, T-SL & TP Levels
Generated based on price movement and trend range.
Levels on Chart
Entry Level: Closing price of the candle where the signal appears.
SL (Stop Loss): Maximum risk allowed for the trade.
TSL (Trailing SL): Dynamic SL to reduce risk and lock profits.
Level 01: First TP level with 1:1 risk-reward ratio. Used for partial booking.
Level 02: Final TP level for full exit.
Input Settings
Levels: You can Increase or Decrease Level Amount for the Level 2.
Risk: You can Increase or Decrease Stop Loss (SL).
📊 Dashboard Table for Easy Presentation of All Levels.
Displays all key levels and metrics in one place:
Metrics
Symbol Name Shows the name of the current chart (e.g., NIFTY, BANKNIFTY).
Bar Age Displays the How many candles (Bars) before Latest signal appears.
Entry Shows the entry level where the latest bullish or bearish signal was generated.
Level 1 (TP1) First target level, based on 1:1 risk-reward ratio. Used for partial booking to secure profits.
Level 2 (TP2) Final target level where you can exit the remaining position.
SL (Stop Loss) Shows the maximum risk limit for the trade. Helps you control losses.
MTM (Mark to Market) Shows the difference between CMP and Entry Level. Helps track how far price has moved since entry.
P&L (Profit & Loss) Shows the difference between Entry and Target Level achieved. Helps measure actual gain or loss.
Date & Time Displays when the latest bullish or bearish signal was generated. Helps check how old or fresh the signal is.
Timeframe Scanner or Current Signal (Trend) on Different Timeframes. Shows the current signal across multiple timeframes.
Row 1 Fixed signals for 1M and 3M.
Row 2 Any 2 Custom Timeframes chosen in input settings.
Traders use this to confirm signals across different timeframes before entering trades. Example If the Day trend is bullish but the 15M chart shows bearish, many traders avoid that trade.
🚦 Gap Up & Gap Down for Untraded Price Marking.
Marks untraded price zones where price may react.
Gap Up & Down Flag Mark
Gap Up: Bullish Bias, Marked Green flag, plotted when candle opens above previous high.
Gap Down: Bearish Bias, Marked as Red flag, plotted when candle opens below previous low.
Input Settings
Enable / Disable from Chart
Threshold: Minimum gap size Threshold to detect
🟡 Institutional Candles for High Volume and Big Price Movement
Indicate strong price movement with high volume.
Marking
Displayed as Yellow Body Candles
Helps identify zones where big players are active.
Input Settings
Enable / Disable from Chart
Body %: Compare of Open & Close with High & Low
Size %: Compare Total Candle Size from Past Range
Volume %: Compare Total Candle Volume from Past Range
⚪ Neutral Candle for Low Volume and Small Price Movement
Shows low volume and minimal price movement.
Marking
Displayed as Hollow Body Candles
Traders usually avoid trading during these candles.
Input Settings
Enable / Disable from Chart.
Candle %: Compare Size of candles.
Volume %: Compare Volume of Candles from Previous Range.
🟥🟩 Supply Demand Zones (Based on Swing High & Low).
Based on swing highs and lows to identify possible reversals.
Zones
🟥Supply Zone: Near swing high, marked with Light Red Zone.
🟩Demand Zone: Near swing low, marked with Light Green Zone.
Input Settings:
Bars Left: How many past Bars Swing will Calculate.
Bars Right: After How many Bars, Zone will plot.
Max Zones: Number of Supply or Demand Zone want to plot on Chart
Delete Breaked Zones: Want to see Disappeared Zone, Uncheck it.
Extend Right: Want to see till End of the Chart, Uncheck it.
📈 Mega Trend Band (Based on HMA) for Overall Trend
Based on HMA (Hull Moving Average) to show overall trend and Help in Filters out trades against the main trend.
Working
Price above band → Bullish trend
Price below band → Bearish trend
Input Setting
Enable / Disable from Chart
HMA Period Setting: 45
👓 How to Use All together for Better Confidence.
🔍Watch for the New Entry icon on the chart.
Find New Signals with help of Automated Alerts.
Check Entry Level, SL, Level 1 and Level 2 (TP2).
Verify Date & Time → how fresh the signal is. Signal not too old.
🧭 Signal is not Self Sufficient for Good Accuracy. So, we suggest a few rules.
Cross‑Check Current Signal with Timeframe Scanner. Trade only when smaller timeframe aligns with bigger trend. (e.g., If Day = Bullish ▲ but 15M = Bearish ▼, avoid entry. Trend may not be stronger.)
Validate with Market Context of Gap. (e.g., If new signal came on Gap Up / Gap Down, avoid entry. Price may reverse.)
Zone Awareness Use Supply Demand zones to refine entries/exits and avoid false signals. (e.g., Entry: If any zone is available between Entry and Level 01, Avoid trade until Zone breaked, Exit: If Zone create between the trade, modify SL according to T-SL and wait.
Trend Filter of overall direction. (e.g., If Mega Trend Band Bullish and Trend is Bearish, Avoid the Trade.)
🕵🏻 Quick Checklist Before Trade
Bullish or Bearish signal?
Dashboard Table shows fresh entry?
SL defined and acceptable risk?
Timeframe Scanner aligned?
No Neutral candle interference?
Institutional candle or Gap supports move?
Supply/Demand zone not against trade?
✅ All Okay - Go for the ENTRY
Set a Proper Entry Point
Always respect SL, Good Trader Never avoid it.
Book partial profits at Level 1, It secure your Trade.
Keep Modifying your SL, According to T-SL Level.
On Level 2, Exit remaining All position for full profit.
📊 Healthy Trading Tips
Risk Small: Never risk more than 1–2% per trade.
Size Smart: Adjust position size to volatility and account size.
Diversify: Don’t put all money in one asset/sector.
Plan Ahead: Set entry, exit, and stop‑loss before trading.
Trade Less: Focus on quality setups, avoid overtrading.
Use Both Analyses: Combine technical charts with fundamental news/events.
Control Emotions: Stick to strategy, avoid fear/greed.
Journal Trades: Record reasons, outcomes, and lessons.
Stay Informed: Track economic calendars and global events.
Take Breaks: Step away after wins/losses to reset.
🎯 Advanced Discipline
Partial Exit: Book profits in stages (e.g., 50% at 1:1, 50% at Final Level).
Check News: Avoid trading during major announcements.
No Tweaks: Don’t change plan mid‑trade; wait for SL/TP.
Fixed Rules: Trade with fixed risk, fixed gains.
No Averaging Losses: Close bad trades, don’t add more.
Keep Learning: Evolve strategy with market changes.
Believe: Trust your plan and process.
Backtest: Practice setups until they’re second nature.
Daily Routine: Pre‑market Preparation, post‑market review.
Optimize Setup: Clean workspace, fast platform, no distractions.
Track Metrics: Win rate, average reward, expectancy, time of day, setup performance.
Trader Identity: Follow rules; money is a byproduct.
Liquidity Check: Avoid low‑volume instruments.
Respect Trend: Trade with momentum, not against it.
Avoid Over‑Leverage: Keep leverage low, avoid margin unless planned.
Risk Disclaimer
This content, including any tools, software, datafeeds, indicators, or scanners, is provided strictly for charting, educational, informational, and paper‑trading purposes only. It does not constitute investment advice, buy/sell recommendations, or real‑money trading strategies.
Not Advisors: We are not registered as investment advisors or research analysts.
Charting Only: Use is limited to testing strategies and evaluation; any application to real trading is at the user’s sole risk.
No Liability: No liability is accepted for financial loss, trading loss, or damages arising from use of the tools or data.
Data Limitations: Market data may be delayed, inaccurate, or incomplete. Past or hypothetical performance is not indicative of future results.
Signals Disclaimer: Automated signals are for evaluation only and should not be treated as accurate or real trading instructions.
High Risk: Trading and investing involve substantial risk and can result in losses beyond the initial capital.
Independent Judgment: Users must exercise independent judgment and consult licensed professionals before making financial decisions
⚠️ Final Note: Trading is speculative and may not be suitable for all investors. Use only risk capital and never invest money you cannot afford to lose.
✅ Always remember🧠 my 3R Rule💡: If the money💰 is yours then, RISK⚖️, REWARD🏆 and REGRET😔 are solely yours. 🔥


Multi-TF EMA Alignment with Curvature (Buy & Sell) 2when you pick 3 times frames as a Context, Validation, and Entry, when all EMA's stack on all three time frame with curvature up or down it signals a long or short

UNDETECTED FX - 250 Pip LevelsIndicator Description – UNDETECTED FX: 250-Pip Psychological Levels
This indicator automatically plots major 250-pip psychological levels on XAUUSD and highlights the price zones around them. These levels act as strong reaction points where liquidity, reversals, and institutional activity commonly occur.
What the Indicator Does
✔ Plots every 250-pip level starting from a user-defined base (e.g., 4050 → 4075 → 4100 → 4125 → …)
✔ Each level is represented by a thick black horizontal line for maximum visual clarity
✔ Around every 250-pip level, the indicator draws a liquidity zone
Top of zone: +200 pips
Bottom of zone: –200 pips
(configured as ± zoneHalf in settings)
✔ Uses extend: both, so levels stretch across the entire chart and stay fixed, no matter how far you scroll
✔ Zones are filled with a customizable color for clear premium/discount visualization
✔ The indicator never repaints and requires no updates after drawing — all levels are fixed on their price coordinates
Why It’s Useful
🔹 Helps quickly identify institutional levels where gold often reacts
🔹 Acts as a framework for scalping, intraday trading, and swing bias
🔹 Makes it easy to spot liquidity sweeps, rejections, and premium/discount areas
🔹 Clearly shows market structure breaks around key psychological levels
🔹 Forces discipline by creating predefined, fixed levels for trading decisions
Best Use Case
XAUUSD scalpers
Intraday traders who rely on precision entries
Traders who use psychological levels, liquidity grabs, or smart-money concepts
Anyone wanting a clean, non-cluttered chart with high-impact levels only

Warpath Structure + Liquidity Tool (Updated - V3)Warpath visually organizes the key elements required to trade Gold professionally:
1. Market Structure Clarity
Automatically labels HH / HL / LH / LL on major pivot points (current chart timeframe). Makes directional bias immediately obvious. Helps prevent counter-trend trading in strong expansions.
2. Liquidity Sweep Detection (Wick-Only)
Highlights true liquidity sweeps using wick behavior (no breakout guessing). Marks the sweep wick with user-defined colors. Draws a swept-zone box that extends forward to show where liquidity was taken. Designed to identify fuel vs reversal behavior in trends.
3. Key Session Levels
Automatically plots:
Asian High / Low
Previous Day High / Low
Equal Highs / Equal Lows from current timeframe and higher timeframes (1H / 4H / Daily)
These levels represent where price is likely to react, not where trades should be forced.
4. Multi-Confluence HTF Bias Dashboard
Small dashboard showing bias for 15M, 1H, 4H, and Daily timeframes. Each timeframe bias is calculated using four confluence factors:
EMA Stack: 8/21/50 alignment and price position relative to EMAs
Structure: Recent HH/HL vs LH/LL pivot behavior
Price Patterns: Engulfing candles, hammers, double bottoms/tops, break of structure
Momentum: Recent candle direction and close trend
Displays a confluence score (e.g., "BULLS (4)") so you can see signal strength, not just direction. Overall bias weights higher timeframes more heavily for smarter alignment.
5. Trade Positioning Dashboard
Replaces basic overbought/oversold readings with actionable positioning context:
Range Position: Shows exactly where price sits within the selected range (Previous Session, Previous Day, or Weekly) as a percentage. Zones include Deep Discount (0-25%), Discount (25-40%), Equilibrium (40-60%), Premium (60-75%), and Deep Premium (75-100%).
VWAP Deviation: Displays distance from VWAP in standard deviations (σ). Readings beyond ±1.5σ indicate meaningful extension. Readings beyond ±2σ suggest caution on continuation and potential mean reversion.
Trade Favor: Combines HTF bias alignment, range position, and VWAP deviation into a single directional score. Displays as "LONGS ●●●○" or "SHORTS ●●○○" so you know at a glance whether conditions favor continuation or reversal.
6. Continuation Reload Awareness (Strong Trend Environments)
Built to handle markets that:
Remain overbought
Stay in premium
Sweep buy-side liquidity repeatedly
The multi-confluence scoring system catches trend continuation setups (like higher lows forming with bullish momentum) even before swing structure fully confirms. Supports compression → expansion continuation behavior. Prevents missed participation during multi-day trends without abandoning discipline.

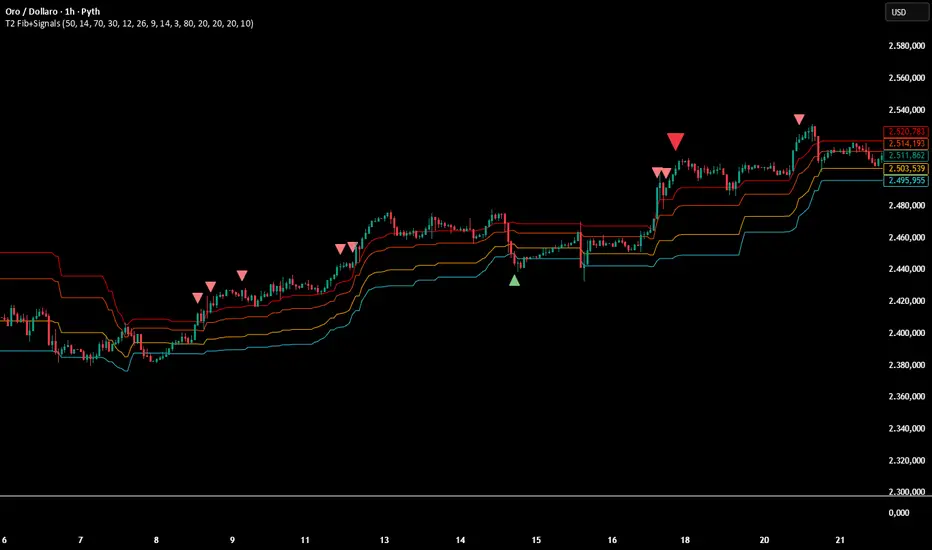
Multi-Confirmation Fib Zones This indicator combines **dynamic Fibonacci-style price zones** with a **multi-signal confirmation layer** to highlight areas where reactions are more likely to matter.
Core purpose
* Map out **contextual price areas** derived from recent market ranges.
* Provide a structured way to read potential **reaction / continuation zones** without relying on a single input.
Zone framework
* The tool continuously tracks the market’s recent extremes and builds **adaptive reference zones** around them.
* It can display both **bullish-context** and **bearish-context** zones, depending on the current market behavior.
Confirmation layer (confluence concept)
Instead of treating any zone touch as a signal, it evaluates **multiple market perspectives**, such as:
* momentum pressure,
* momentum shifts,
* short-term oscillation balance,
* participation / activity confirmation.
Signals are intended to be interpreted only when **several views align**, helping reduce false positives.
Practical use
* Useful for traders who want **structured levels + confirmation** in one visual workflow.
* Can support both **trend continuation** and **reaction-based setups**, depending on broader context.
* Best treated as a **decision support system** (a “dashboard”), not a standalone trade trigger.
Best conditions
* Works best when markets are **respecting ranges and reacting at obvious areas**.
* In extremely noisy, thin, or news-driven spikes, confirmations may desync and require more discretion.
*For educational and analytical purposes only. Always validate across different instruments and timeframes.*
MP SESSIONS, DST, OTTHere’s a clear description you can use for this script (for yourself or as a TradingView “Indicator Description”):
---
### MP SESSIONS, DST, OTT – What this indicator does
This script is a **multi-session market timing tool** that:
1. **Draws full trading sessions on the chart** (Asia, Sydney, Tokyo, Shanghai, Europe, London, New York, NYSE)
2. **Automatically adjusts for Daylight Saving Time (DST)** for Sydney, London, and New York
3. **Shows a live info table** with session times, DST status, and whether each session is currently open or closed
4. **Adds optional custom “OTT” vertical lines** at user-defined intraday times (for your own models, killzones, or time blocks)
---
### Main Features (high level)
#### 1. Market mode & time zone handling
* **Market Mode**:
* `Forex`
* `Stock`
* `User Custom` (you type your own session ranges)
* `TFlab suggestion` (predefined “optimized” session times)
* **Time Zone Mode**:
* `UTC`
* `Session Local Time` (local exchange time: Sydney, Tokyo, London, New York etc.)
* `Your Time Zone` (converts to the user-selected TZ, e.g. `UTC-4:00`)
* Handles separate time zones for:
* Asia, Sydney, Tokyo, Shanghai, Europe, London, New York, NYSE
* Has logic to **recalculate session start/end depending on DST** and the chosen mode.
---
#### 2. Daylight Saving Time (DST) engine
The function `DST_Detector`:
* Calculates when DST **starts and ends** for:
* `Australia/Sydney`
* `Europe/London`
* `America/New_York`
* Detects the correct Sunday (2nd, 4th, etc.) for start/end using day-of-week and week counts.
* Returns `'Active'` or `'Inactive'` for each region.
* These values are then used to **shift the sessions** (e.g. New York 13:00–21:00 vs 12:00–20:00 in UTC).
The script can also **draw vertical lines** on the chart when DST starts/ends and label them:
* “Sydney DST Started / Ended”
* “London DST Started / Ended”
* “New York DST Started / Ended”
---
#### 3. Session timing & sessions on the chart
The function `Market_TimeZone_Calculator`:
* Based on **Market Mode** + **Time Zone Mode** + **DST state**, it returns:
* Time ranges for: Sydney, Tokyo, Shanghai, Asia (combined), Europe, London, New York, NYSE
* These ranges are in `"HHMM-HHMM"` format.
Then the script:
* Converts these to `time()` conditions using the proper time zone
* Creates boolean series like `On_sesAsia`, `On_sesEurope`, `On_sesNewYork`, etc., which are **1 when the session is open and 0 when closed**.
---
#### 4. Session high/low boxes & labels
The function `LowHighSessionDetector`:
* Tracks **high and low of each session** while it’s active.
* When a new session starts:
* Resets and starts recording the session high/low.
* While session is active:
* Updates `High` with the max of current bar high and previous session high.
* Updates `Low` with the min of current bar low and previous session low.
* When the session is "on":
* Draws a **box** from session low to high (`box.new`) and extends it to the right as long as the session continues.
* Places a **label with session name** (Asia, London, New York, etc.) near the high:
* Style depends on the session (down/right/left).
You have visibility toggles per session:
* `Asia Session`, `Sydney Session`, `Tokyo Session`, `Shanghai Session`, `Europe Session`, `London Session`, `New York Session`, `NYSE` (for TFlab mode).
So you visually see:
* A shaded box for each session
* The full H/L range for that session
* A text label with the session name.
---
#### 5. Info table
The indicator builds a **table in a corner of the chart** showing:
* Header:
* “FOREX Session”, “Stock Market Trading Hours”, “User Custom Session”, or “TFlab suggestion” depending on mode.
* Columns:
1. Session name (Asia, Sydney, Tokyo, Shanghai, Europe, London, New York, NYSE)
2. DST status for that region (“Active 🌞 / Inactive 🍂 / Not Observed”)
3. Session **start time**
4. Session **end time**
5. Current **status** (“Open / Closed”, with green/red background)
The function `SplitFunction`:
* Parses the `"HHMM-HHMM"` strings for each session.
* Converts them into:
* Either raw times (if viewing in UTC/session local)
* Or converted times in **Your Time Zone** using `timestamp` and `hour/ minute` with `YourTZ`.
* Returns formatted `Start` and `End` strings like `9:30`, `13:00`, etc.
So the table is effectively a **live session schedule** that:
* Auto-adjusts to DST
* Can show times in your own time zone
* Shows which session is open right now.
---
#### 6. OTT vertical lines (custom intraday markers)
At the bottom, there is an **OTT section** which lets you draw up to **three sets of vertical lines** at specific times:
* Each OTT block has:
* Enable toggle (`Enable OTT 1/2/3`)
* Start hour & minute
* End hour & minute
* Color
* Global OTT settings:
* Line style: `Solid / Dashed / Dotted`
* Line width
* Toggle: “Show OTT Labels?”
Logic:
* `is_ott_time()` checks if current bar’s `hour` and `minute` match the OTT input time.
* `draw_ott()`:
* When the bar time matches, draws a **vertical line** through the candle from low to high (`extend.both`).
* Optionally adds a label above the bar, like `"OTT1 Start"`, `"OTT1 End"`, etc.
Use cases:
* Marking **open/close of your trading session**
* Defining **killzones**, news times, or custom model windows
* Visual anchors for your intraday routine (NY open, 10 AM candle, etc.)
---
### TL;DR
This indicator is a **session toolkit + DST engine + time markers**:
* **Visually paints the main global sessions** with boxes and labels.
* **Handles DST automatically** for Sydney, London, New York.
* **Shows a live table** with session times, DST status, and open/closed status in your time zone.
* **Adds up to three configurable vertical time markers (OTT)** for custom session windows or key times.
If you want, I can also write a **short version** (2–3 sentences) for the TradingView “Description” field.

Multi-TF EMA Alignment - Safe 3/4 Above EMA50 + ATR Pullbackthis script only triggers when your context, Validation, and entry time frames EMA's align for long positions

MASTER ENGINE v6
MASTER ENGINE v6 is a multi-timeframe decision engine that shows direction, alignment quality, risk conditions, and a realistic target zone — without forcing trades.
What it actually does (short version)
Finds the dominant direction using multiple timeframes
Weights higher timeframes more heavily so noise can’t override structure
Grades trade quality (A–D) so you know when conditions are strong or marginal
Checks timing alignment so you’re not trading against momentum
Flags stretched or reversal-risk conditions early and clearly
Shows a conservative ATR-based target zone, scaled by trade quality
Everything is filtered through risk first, not opportunity first.
How to read it (at a glance)
DIR / ALIGNMENT → market bias and confidence
GRADE → trade quality, not probability
PLUS1 / NOW → timing agreement
TRADE → ON, CAREFUL, or stand aside
WHY → the single most important reason
TARGET ZONE → potential distance, not a promise
What it is not
❌ Not an entry signal
❌ Not a take-profit system
❌ Not predictive
❌ Not automated
In short
MASTER ENGINE v6 acts like a calm, experienced trader sitting next to you, saying:
“Direction is clear.”
“Timing is okay… but be careful.”
“Market’s stretched — don’t force it.”
“This is a reasonable zone, not a guaranteed target.”
You still make the final decision.

MTF FVG 3-candleMTF FVG 3-candle is an indicator that detects Fair Value Gaps using a 3-candle pattern on the timeframe selected in the settings. It projects FVG zones onto lower timeframes, tracks the first touch and full fill of each zone, and provides alerts.

Reversal Strength with Momentum Ratings on 4hr charts Here's a quick breakdown of what you'll see on your chart and how to actually use the indicator!
Reversal Labels:
↑ = Bullish reversal (price reversing upward)
↓ = Bearish reversal (price reversing downward)
STRONG (bright green/red) = High-confidence reversal (score > 65)
weak (faded green/red) = Low-confidence reversal (score ≤ 65)
Number on label = Reversal strength score (0-100)
Momentum Table (Top Right):
Overall Score (0-100) = Total momentum strength
Green (80+) = Very strong momentum
Yellow (40-60) = Moderate momentum
Orange/Red (<40) = Weak/stalling momentum
Individual Momentum Scores (each worth 0-20 points):
Volume = How much trading activity vs average
Price ROC = How fast price is moving (rate of change)
MA Spacing = How spread out the moving averages are (trend strength)
ADX = Directional movement indicator (trend conviction)
RSI Mom. = How far RSI is from neutral 50 (momentum extreme)
Status Indicators:
🔥 STRONG = Momentum > 70 (strong move happening)
📈 BUILDING = Momentum 50-70 (gaining strength)
⚠️ WEAK = Momentum 30-50 (losing steam)
💤 STALLING = Momentum < 30 (very weak/choppy)
Background Tint:
Light green background = Strong momentum (>70)
Light red background = Very weak momentum (<30)
The key is: look for STRONG reversal labels when momentum is building/strong for the best trade setups! Also this is mainly for the 4hr time frame.

MTF Fractal LevelsMTF Fractal Levels is a fractal-based indicator designed to highlight key price levels and provide timely alerts when price reaches those levels.
The indicator can display fractals from the current timeframe as well as from a higher timeframe selected in the settings.
When a higher timeframe is selected, its fractal levels are correctly projected onto all lower timeframes, allowing higher-timeframe levels to be used as context for entries on lower timeframes.
The Fractal Strength parameter allows filtering of fractal formation by controlling how significant a price extremum must be to be considered a valid fractal.
Levels are displayed as horizontal zones/lines with flexible visual style settings.
The indicator supports intra bar alerts that trigger at the exact moment price touches a fractal level, without waiting for the candle to close.

Vertical Time LinesVertical Time Lines is an indicator that draws vertical lines at specific times of each day on the price chart.
⚙️ Main Features
Up to 5 independent time lines
Precise hour and minute editing (HH:MM)
Individual enable/disable option per line
Customizable line color and style
Works on any asset and any timeframe
📝 Note
Due to Pine Script limitations, the lines are drawn using UTC time, not the time zone configured on the chart.
Lines are generated only when a candle exists exactly at the configured minute. If candles for the specified hours and minutes are not visible on the chart, the lines will not be displayed.
