Ultimate MACD Suite [BigBeluga]🔵 OVERVIEW
The Ultimate MACD Suite is an advanced momentum-based system that enhances the classic MACD with modern features tailored for professional traders.
It transforms MACD into a full market-decision engine — offering multi-timeframe confluence, adaptive histogram behavior, divergence detection, heatmap trend visualization, and actionable reversal signals.
This toolkit goes far beyond standard MACD, helping traders identify trend momentum shifts, exhaustion zones, high-probability reversal areas, and breakout confirmation signals across multiple timeframes simultaneously. It's to be used as part of a major trading system and to simplify usage of the MACD.
⚠️ Note:
This is not a traditional MACD — it uses normalized values , enhanced visual feedback, and a multi-timeframe dashboard engine for superior signal quality and clarity.
🔵 CONCEPTS
Combines MACD momentum, signal-line crossovers, and histogram reversals into one system
Uses normalized scaling to detect extreme momentum levels and exhaustion zones
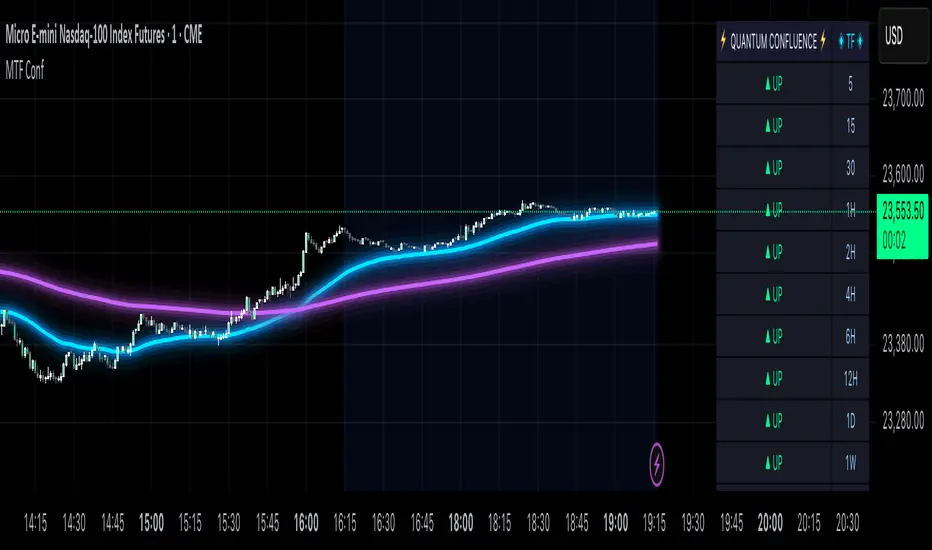
Multi-timeframe dashboard displays consensus signal alignment across several timeframes
Divergence engine identifies bullish & bearish trend weakening early
Heatmap mode visually distinguishes strong trend phases from neutral or fading momentum
Reversal arrows & crosses highlight actionable turning points on chart
🔵 FEATURES
Normalized MACD Engine — improves signal clarity across all assets/timeframes
MACD Heatmap Mode — color-coded slope intensity for trend strength monitoring
MACD Rising and Falling Mode — color-coded rising and falling MACD regimes
Histogram Reversal Detection — early momentum fade signal before price turns
Signal-Line Momentum Shifts — bullish ▲ & bearish ▼ alerts on cross-confirmation
Overbought/Oversold Bands — enhanced visual thresholds at ±80 levels
Smart Divergence Detection (Non-Lag) — confirms regular bullish & bearish divergences
Multi-Timeframe Dashboard — MACD, signal, histogram & divergence signals across 5+ TFs
Reversal Push-Filter — ensures only clean signals after confirmed momentum inflection
On-Chart Reversal Labels — optional compact signal markers for clean visual execution
Histogram Color Logic — rising/falling or heatmap mode for deeper momentum reading
🔵 HOW TO USE
Look for MACD crossing above signal + green histogram to confirm bullish momentum
Use ▼ and ▲ arrows to catch confirmed momentum reversals
Monitor the dashboard — the more timeframes align, the stronger the setup
Watch divergences for trend exhaustion or reversal setups
Treat histogram trend shifts as early momentum clues before price reacts
Use ±80 levels to identify overheated conditions & fade opportunities
Combine with structure, volume, or BigBeluga liquidity tools for higher accuracy
🔵 ALERTS
The indicator includes a full alert suite for automation and real-time trade readiness:
MACD crossovers (Bullish / Bearish)
Histogram reversals & zero-line shifts
Bullish / Bearish divergence detection
Overbought / Oversold MACD alerts
Bullish ▲ and bearish ▼ reversal triggers
Use these alerts to automate signal monitoring or feed algorithmic systems.
🔵 CONCLUSION
The Ultimate MACD Suite transforms a classic indicator into a powerful trading engine.
With multi-timeframe alignment, heatmapping, divergence logic, normalized scaling and automated signals, it becomes an elite momentum-confirmation and reversal-timing system built for serious traders.
Whether scalping intraday or managing swing positions, this MACD engine helps identify the most profitable phases of trend movement — while warning early when a trend is weakening.
Skrip berbayar