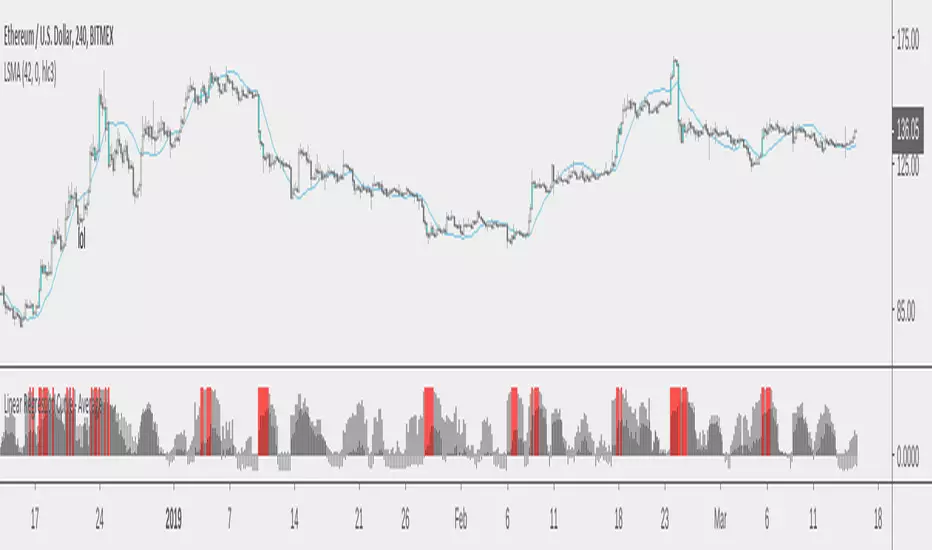
Linear Regression Curve - AverageIdea is that the average of price has something to do with sudden changes in trend. Finding trend shifts in mundane.
Neobutane
Binance TRX & BTTShows TRX with BTT, subtracted or added to. Subtracting makes it in line with BitMEX futures. The option to add is considered for 'true value'. Airdrops, like new coin forks, can split value: a good example being BCHABC and BCHSV.
Getting TRX futures to match TRX on Binance is likely tied to the monthly airdrop rate as defined here: support.binance.com
I'm guessing it has something to do with (spot price * estimated airdrop rate) trading too far from futures. Maybe even too close. Or because futures are trading above spot near a monthly airdrop snapshot. Much complicate. Such guess. Wow.
Binance is chosen as pricing source for its liquidity and earliest open date.

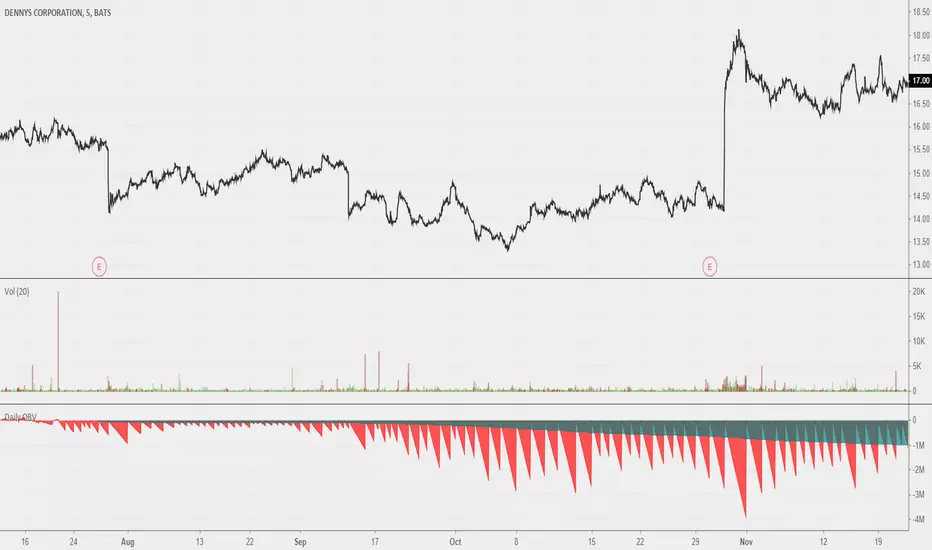
Levels Ft. VolumeThese are levels based on volume. The idea is that candles of high volume a higher amount of traders with active long/short positions to either close out, protect, or add to.
A stack of red candles means that area is a point of interest, similar to a VPVR POC.

Daily OBVOBV that should reset on a daily session break. Looks neat when you scroll out all the way. Good use remains to be found; I believe this could be a useful reference for a more fleshed out idea for 'local zone' OBVs. Maybe comparing previous sessions' daily OBVs to current.
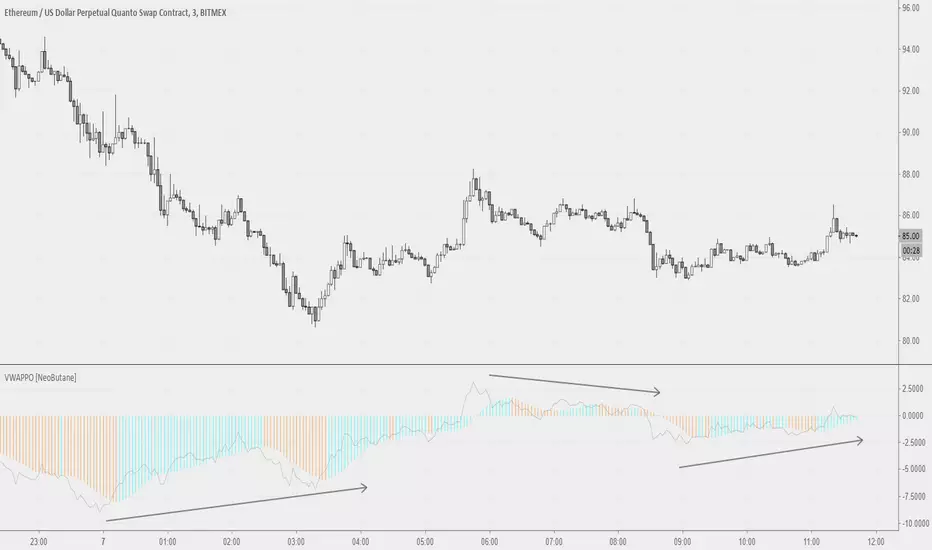
Volume Weighted Average Price Oscillator [NeoButane]VWAP on PPO but not PPO. Two histograms, with the second one being SMAs of the first and signals color/trend change.
1.0 - Release
Framework laid out
Power level readings should be within 9000
Volume Zone Oscillator and Price Zone (VZO/PZO) [NeoButane]" Volume Precedes Price is the conceptual idea for the oscillator."
"The main idea of the VZO was to try to change the OBV to look like an oscillator rather than an indicator, also to include time; primarily to identify which zone the volume is located in during a specific period "
How to read this indicator:
Positive reading -> bullish
Negative reading -> bearish
-60 or 60 is seen as the limit of the oscillator range, and a pullback should be expected from there.
Plus and minus signs have been added to the top and bottom for VZO and PZO, with an adjustable threshold to trigger.
Alert conditions have been added to this indicator for ease of use.
Volume Zone Oscillator, write-up by the author (recommended reading)
http:capitalsynergy.com/resources/IFTA09VZO.pdf
Volume Zone Oscillator, uses and formula
https:www.investopedia.com/articles/active-trading/072815/how-interpret-volume-zone-oscillator.asp
Price Zone Oscillator, uses and formula
https:www.investopedia.com/terms/p/price-zone-oscillator.asp

Daily Auto Fibonacci ToolCalculates Fibonacci retracements based on daily highs/lows, and further beyond that if specified. The main difference between this and other auto Fibbing tools is ease of visibility.
Options:
Take highs/lows from a few days back or take highs/lows from each daily candle
Hide retracements before today
Show labels for each retracement level
Hide/Show retracement levels
Change colors quickly and uniformly (in script)
Retracements used:
-0.382 / 0 / 0.236 / 0.382 / 0.5 / 0.618 / 0.786 / 1 / 1.272
