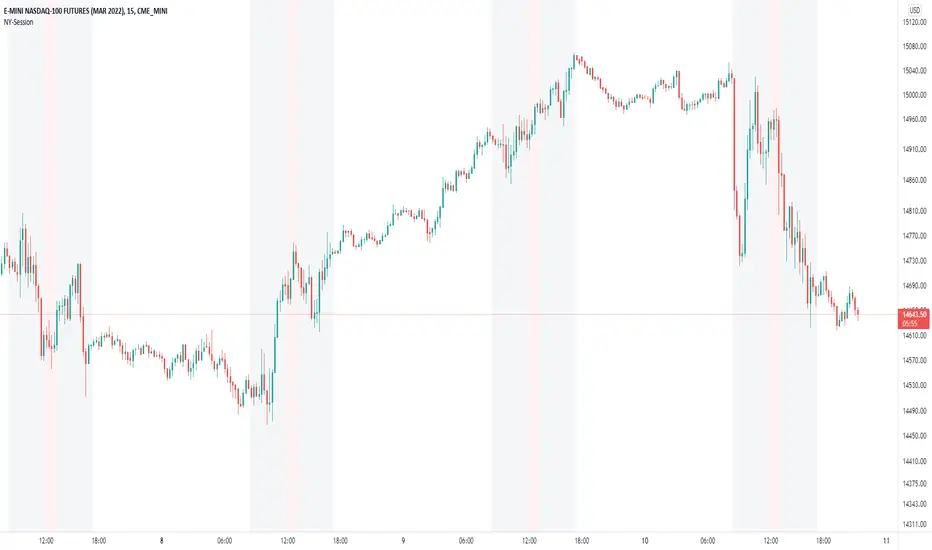
Main Market Opener Breakout [RH]Based on my observations while analyzing the crypto and forex charts, particularly BTCUSDT and EURUSD, I have noticed that the prices exhibit significant movements during most stock market sessions, particularly during New York main market session.
With the aim of capturing these moves, I embarked on extensive research. Through this research, I discovered that by considering the very first "15m" or "30m" candle of the main market trading session and marking that first candle's high and low points, we can create potential trigger points.
A break above the high point indicates a bullish signal, while a break below the low point suggests a bearish signal. To further refine our analysis and filter out some noise, we can incorporate the Average True Range (ATR) value of that candle.
Candle time is very important here. We will mark the candle when the actual trading begins in New York stock exchange. The trading hours for the New York Stock Exchange (NYSE) typically begin at 9:30 AM and end at 4:00 PM Eastern Time (ET), Monday through Friday. This is known as the "NYSE Regular Trading Session." However, it's important to note that there are also pre-market and after-hours trading sessions that occur outside of these core hours. We will not consider these pre and after-hours.
Example:
First break-above and break-below is marked automatically and alerts are also available for first breaks.
Example:
I have also added the option to add the, London Stock Exchange Main Market and Tokyo Stock Exchange Regular Trading Session. You can add those sessions also and test with different symbols.
Stocks symbols from different stock exchanges just mark the very first candle of the day(main market trading session).
Alerts are available.
Newyorksession

New York, London and custom trading sessionsHi Traders
The script :
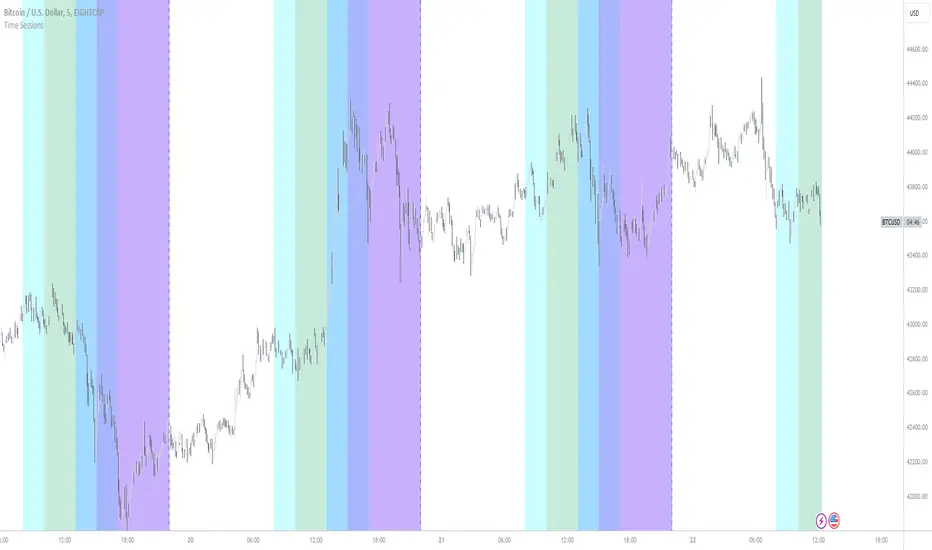
The Time sessions script plots the trading sessions of both New York and London markets (background fills), In addition to the above the script also plots a user defined trading session period (vertical lines). All plots may be toggled true or false inorder to ensure you can focus on the respective market / markets / custom session.
Market sessions are useful for technical or quantitative analysis, as the majority of trading activity and net daily volume occurs in these zones, in fact the U.S./London market overlap tends to have the greatest volume accumulation across that range of time / bars than that range at any other time within the daily session. For FX traders it may also be important to take into account for many currency pairs the average exchange rate pip movement is greatest within these zones.
The custom session, is intended to be used for traders who trade only within specific intervals within the market session or day for 24/7 traded asset classes
Additional notes :
Not as of now, I have only added three optional trading sessions. If you would like to change the sessions, copy the scripts code and change the "ctm_session" default time range value, insuring the second time value is 1 min > than the first.
As always i Hope this is a useful script, and I will be updating this script in the near future.
Diddly - Charts (Asian, London & New York Session + Weekdays)Overview:
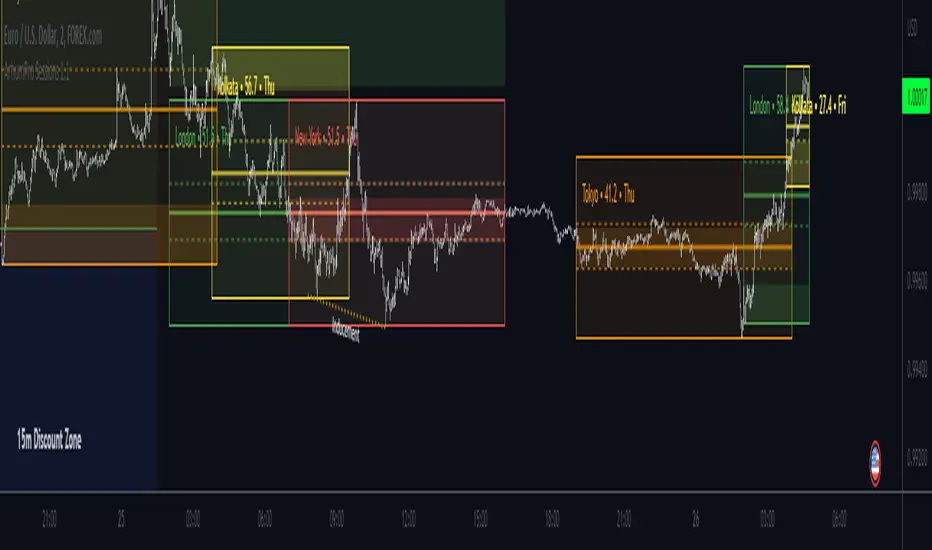
Diddly Charts is for providing intraday context to where we are in the market. It does this through a series of ranges displayed throughout the day, typically broken down into the Asian, London, and New York sessions.
This indicator also highlights key market structures like monthly, weekly, and previous day's highs and lows. Lines are provided for weekday and weekend separators, with the days of the week at the bottom of the chart, making it extremely useful for traders when identifying weekly cycles.
Usage:
All aspects of this indicator are changeable within the settings, allowing you to utilise the elements that are most important to your trading strategy.
The default layout is extremely useful for currency pairs, where traders use the London and New York boxes as windows of when to engage with the market. The times of these trading sessions can be changed to suit the trading periods that you want to trade.
Adhering to trading windows can help improve discipline to ensure that you are only taking entries within the time periods that match your trading strategy.
Some traders prefer a cleaner interface and don't want any indicator to detract from the price action they are reading, this can be achieved through changing the colour and their transparency in settings. In this example, you will see different labels used to annotate key structures, these can be changed to something that is relevant to your strategy in the settings.
It can also be used for trading Stocks where sessions are broken down into pre-market, market hours and post-market. This can be helpful to see those stocks that breakout of pre-market session highs and lows and also provide trading windows to keep traders out of trades that do not comply with their trading strategy.
Using higher time frames like a 4 hour chart or even the 1 hour chart, the intraday sessions are hidden away so traders can get a broader perspective without the clutter when zooming out. Although there are options to turn it on if you would prefer.
Here on a zoomed out 1 hour chart we have the option to only display the weekly line separator, which can help get an overview of weekly cycles.
Helpful Information
The main setting that you may want to change is at the top of the indicator settings, which is asking "what asset type" is the symbol being looked at. The indicator needs to know how to display the session range information. For example for currencies, the range size will be displayed in pips. For stocks or Futures it would display the financial amount. Beyond the visual display of information, this setting has no other impact on the indicator behaviour. The default setting is "Currencies".
We often get asked what the labels that appear on the chart mean. These can all be changed to your requirements, but by default what you will see when you apply the indicator to the chart is:
Under the Asian Range appears a couple of labels.
A = x : This is the range size of the session in pips for forex or amount for other assets, from the lowest to the highest price traded during that window.
ADR = y : This is the Average Daily Range over the last 21 days for this ticker
Under the London and New York session you will see a L = x or NY = y . This is the range size of each session in pips for forex or amount for other assets.
Structure Labels
YH = Yesterday's High
YL = Yesterday's Low
WH = Current Week's High
WL = Current Week's Low
MH = Current Month's High
ML = Current Month's Low
We greatly appreciate the support and feedback from the Trading View community, and we are dedicated to continuing to improve our indicators with your support.
We want to help you manage risk, and that's why we emphasise that trading is risky and any technology used to support our trading decisions is based on information from the past. We encourage traders to take responsibility for their trading businesses and always prioritise risk management.

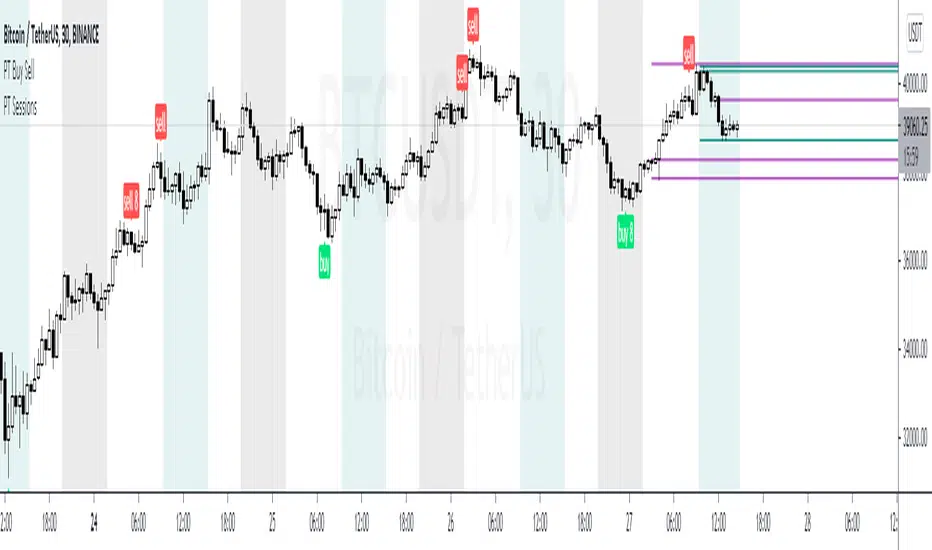
PT Levels SessionsVersion 1.0 - PT Levels offers visual for Daily, Weekly, Monthly, Quarterly Yearly range.
Some sauces:
PT Range - Daily open, Monday High, Monday Low, Weekly Open
Weekend range, Wednesday range, CME Open, CME Close, NY Range, London Range & Asia Range
Strategy:
Price tends to gravitate between the Daily level when playing intraday scalps. If playing the weekly, you want to be above the weekly pivot to punt longs & under the weekly level to punt shorts. More likely than not, when the price hits a monthly or yearly level, we get a noticeable reaction off it.
These levels will give you an idea of where the price can react if reached. Consider them pivotal areas. We included a toggle that will help you go between the candle's High/Low to the candle's Open/Close. Both features are unique when scalping & swinging. The Level Sessions will paint a beautiful visual for your day-to-day trading & the Open/Close will help you determine where price maxed opened & closed for that specified timeframe.
If analyzing the crypto markets - Try to pay attention to price action on the weekend. We included a weekend range to offer a visual of the HIGH/LOW during the weekend when the volume is low & price is easier swayed.
Feel free to contact us for any suggestions. Check our indicator suite for the rest of our developed tools.

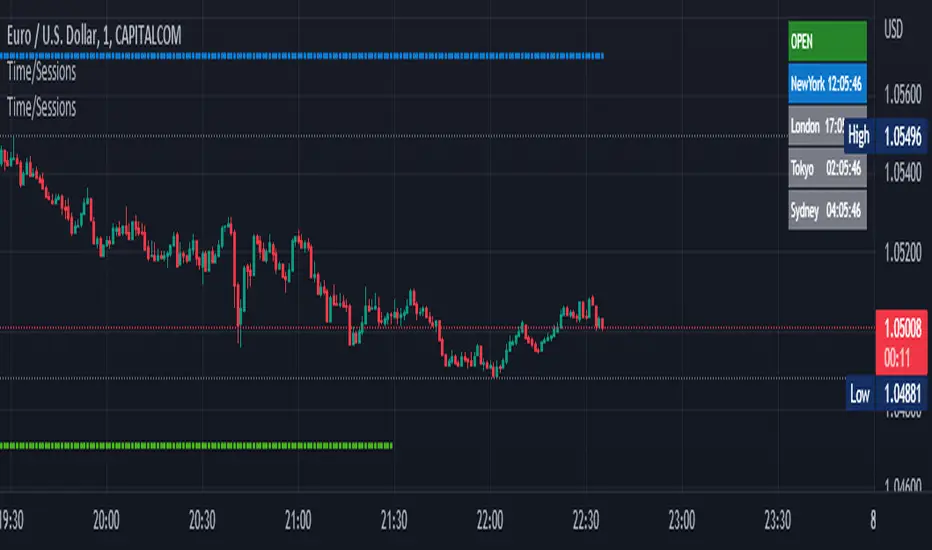
Time Zone / Market SessionsTime Zone / Market Sessions indicator is a handy tool to display current major Market Open / Close condition along with present time at that Exchange. Sydney, Tokyo, London, New York market sessions are included. Clear display of Overlap Zones and Kill Zones.. Can be used to estimate market Pumping and Dumping. Alerts can be set when a market opens.
Time is Displayed in Table Layout
Active Market is displayed as Dots on top and bottom
You can select as Timeline or Table display
Overlap is clearly displayed on top and bottom without any mess
Gray color in Table layout Shows Closed Markets
You are free to reuse this code No Limitations.
Kill Zones are indicated in Table format. When some of the markets are closed
Alerts included for market openings
Market Sessions [Kaspricci]A simple indicator to show you the opening hours of the main markets in London, New York, Tokio and Sydney. It is not shown in your main chart window and as such does not make the chart more difficult to read.
You can turn each market on and off individually and also change the start and end time, if you wish so. All based on GMT timezone, but will be translated into your local timezone.
Happy to receive your feedback.

Trading Sessions [ArtiumPro]ArtiumPro Sessions is packed with tons of features and alerts to help you with your trading. It is public so enjoy it!
- History - Yes or No, No will show the most current session only.
- Pre-Sessions Range with Opening Range Breakout Alerts
- Pre-Sessions Range Can Be Listed From 15 minutes To 4 hours
- Sessions Line Style - Solid, Dash, or Dots
- Sessions Box - Default 1 Can Be Increased
- Sessions Closed Icon - Yes or No, No will show an icon on all previous sessions not active
- Pip Session Ranges
- Lookback (minutes) will color code opening range settings which you can also use for testing previous sessions ranges to help with strategies
Sessions Alerts
- Sessions Start/End
- Opening Range Breakouts
- Price Crossed Session's High/Low After Session Closed
Time Zones Supported:
- America/Los_Angeles - America/New_York - America/El_Salvador - America/Chicago - America/Argentina/Buenos_Aires
- Europe/London - Europe/Berlin - Europe/Moscow
- Asia/Dubai - Asia/Bangkok - Asia/Hong_Kong - Asia_Tokyo
- Australia/Bribane - Austalia/Sydney
- India/Kolkota
New York Session
London Sessions
Asian Sessions
Indian Sessions
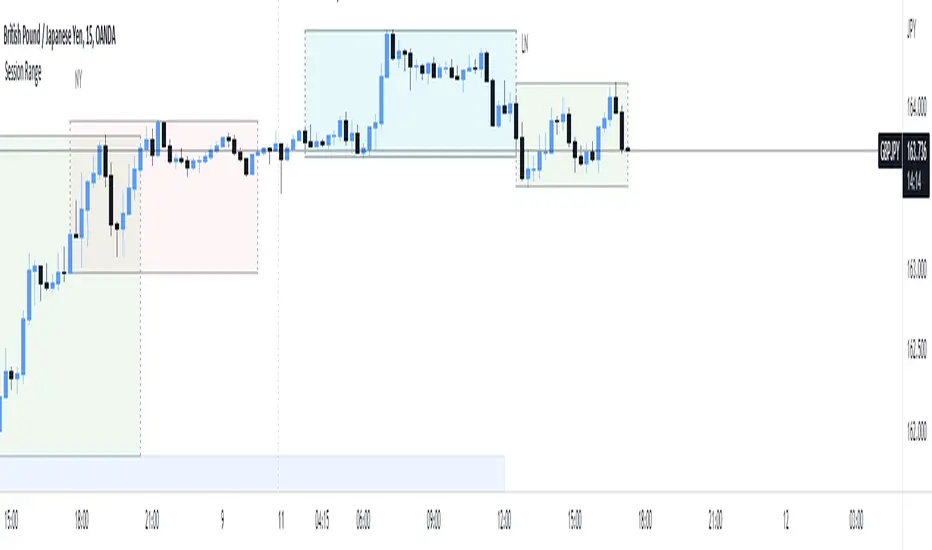
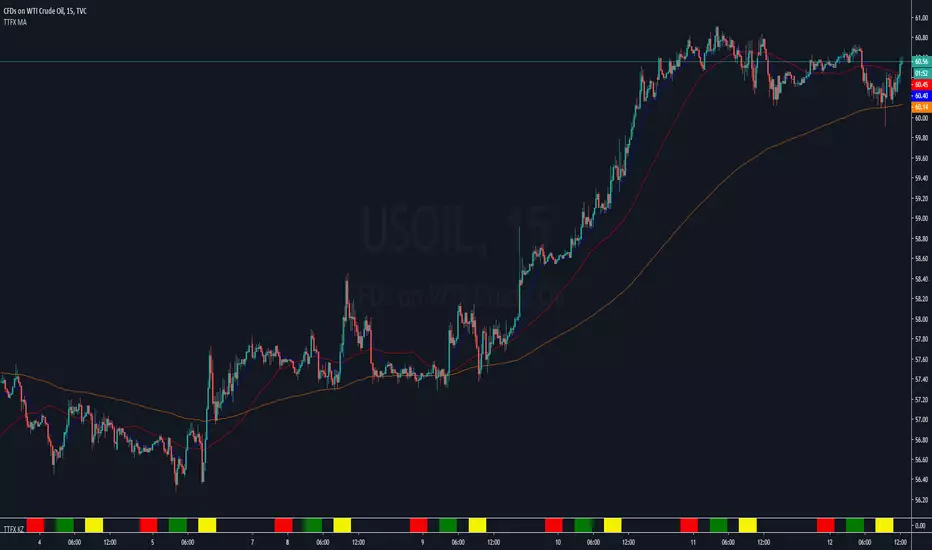
Session High Low
This indicator shows Session High Low line and prices.
1: Session range is adjustable based on your timeframe. Nomore confusing timezone settings.
You can choose your timezone then set your Session start and end time.
Script will show you the following session high and low lines which is extendable until next session.
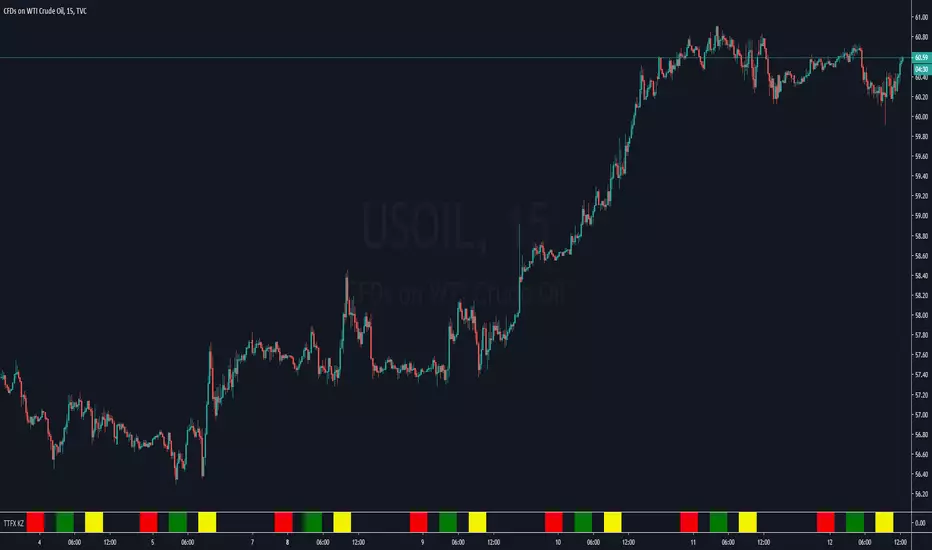
2: All historical lines and price levels are can be partially or fully hidden.
And line colors are adjustable so you can use suitable color on your chart.
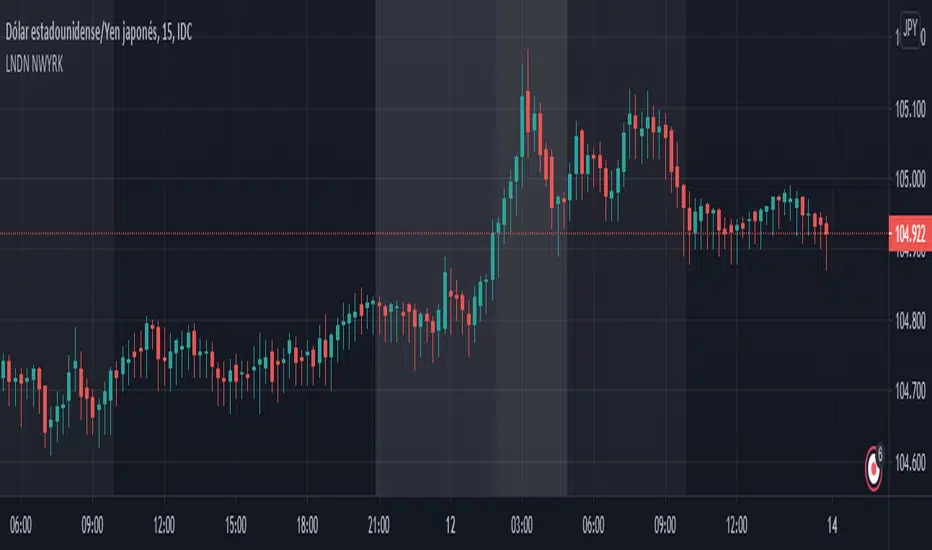
Based on session you choose this script can be used as a session break strategy AKA (Asian session break, London session break strategy).
You can create your own trading Session and high lows.
Personally I monitor how price reacts on London session high lows during the NewYork trading session.
In this chart Session starts at 8am (London open) and closes at 12:30 (NewYork open). Script is showing high lows only in this session range.
Always double confirm with your trading style. It's not a Financial advice.
Inputs:
1: Hide history - Hides all historical lines and prices that means you can see only todays session.
2: Show price - Shows price level of session high lows. You can hide price level if you want to see only lines.
3: Session time - You can set your time range of session.
4: Start time - Session start time. You can see vertical line on your chart or you can hide line.
5: End time - Session end time. You can see vertical line on your chart or you can hide line.
6: Line extend time - End of the high low lines. You can draw line until the end of the session or you can draw short line.
7: All line and price colors are optional.
Thank you.

Fx Session RangeHello traders ,as you know the session timing plays a major role in trade execution.
I was searching for a good session indicator for a very long time but I was not satisfied with the indicators which are already available on Trading view. So I decided to code one my self.
This indicator is based on the timing provided by the website www.forex.timezoneconverter.com and time is set according to Ney York time zone.
I have added almost all major sessions including (Sydney , Tokyo and Frankfurt) and almost all features which I could.
I hope you guys 👍this indicator .
Incase you notice any bug or want any features added, let me know in comment section or you can Dm me as well.
Thank you all , enjoy :D
New York Happy HourNew York Happy Hour
Script inspired by Stacey Burke’s 'Trading New York Open 1 Hour a Day'. You know where to search. The algos run on New York time. You’ll be looking to trade from 9.30 AM NY EST using a full day of trading data behind you.
Instruments:
- Gold, major currency pairs, indexes, metals and crypto
Timing: 15 Min
Best Trade Setups:
- 3 Levels (HOD/LOD)
- Trend Trades
- Reversal Trades
- Trading Range
- Or what you see best fit
Script Breakdown:
Sessions:
Asia: 8-11 PM
London: 2-5 AM
New York: 8-11 AM
Other lines:
New York Midnight Open
New York Open
London and NY vertical lines
Previous daily and weekly high and low

Futures Exchange Sessions 2.0Description
Successor to Futures Exchange Sessions indicator. Completely rebuilt code from the ground up. Every feature has been redesigned and refactored to be the most beneficial while allowing for complete configuration by the user.
This indicator displays Futures Sessions as live boxes that expand dynamically as price moves over the time interval. These boxes make liquidity levels extremely easy to spot and visualize. It helps the user identify market structure and develop their own bias of price action. Everything about the Session boxes can be configured. Box color, border color, border style, and border width are all individually controllable. Each Future Session can be turned on or off at any time. Also, each box has their own text label (Asian Session, London Session, New York Session) and this text can be moved around the box, change color, and change size.
Previous days highs and lows (major liquidity levels) are always important to the futures trader. This indicator now allows the user to individually display the three previous days highs and low levels as lines with optional label. Each line can be independently toggled on or off and like always, every conceivable customization option is available to the user. And the labels can be moved to the right (via the Input Settings) to allow unobstructed views of candles.
The midnight EST open and 8:30 AM EST open horizontal lines (developed by the Inner Circle Trader) are returning in this indicator. But the biggest improvement is that the lines stop at the current bar or the last bar of the trading day. Additionally, the time lines are displayed on previous days so the user can easily see how the candles reacted to these important times of the day.
The Session boxes and the horizontal time lines now can be set to only display a certain number of day back. If the user wants just to see Session boxes for the previous day only, they can do that. If the user wants to see the last 15 days of boxes or lines it is very easy to increase the days back in the settings. Currently, the max days back is 80 calendar days.
Additional Images
Easily visualize and understand price action across time
Everything is customizable so the user can easily match this indicator to their color preferences
Special Notes
To turn off box session text set opacity to 0%
Boxes and horizontal time lines only display when timeframe is <= 30 minute

Futures Exchange SessionsIn the 24-hour trading of the futures market, this indicator provides the user with full customization concerning the most important factor: time. This indicator is centered around three main visualizations: labels, backgrounds, and lines that minimalistically allows the user to keep track of the many time intervals that occur during a futures market 24-hour trading cycle. It also artfully displays the previous days highs and lows. And everything can be individually toggled and configured so the user can get exactly what they want.
Labels
There are three main futures market sessions in a 24-hour period: the London, New York, and Asian Sessions. Each session is given an independent label for the open and close times. The six labels (LO, LC, NYO, NYC, AO, AC) can be individually toggled on or off, the label background color changed, the text switched between black or white, and the height can be lowered or raised. These customizations are intended to give the user full control of the session they are interested in at the moment.
Backgrounds
Backgrounds are the heart of this indicator. There are different colored transparent backgrounds for each of the futures sessions. So the user can clearly see the session they want to highlight without cluttering their chart and getting in the way of analyzing the candles.
If you are familiar with the London and New York killzones, these backgrounds are each individually configured.
If you are familiar with the Inner Circle Trader’s (ICT) NY Morning and Afternoon sessions, these are available. Also, most times weird price action occurs during the lunch hour of these sessions. The London and New York have a background for their respective lunch hours so the user is never caught of guard during these periods.
Lines
The markets are constantly looking for liquidity. To help the user see runs on liquidity, this indicator projects the previous days highs and lows on to the current day with a line and a price label. The line make it very easy to see where price may be headed. See the image below for the perfect example of this phenomenon. Each of the lines can be independently controlled by color, style, and width. And even the labels can be toggled on or off if the user would prefer just to see the lines. Lastly, there is a line that marks the midnight open price in EST.
Special Notes
This indicator is specifically designed for futures tickers.
All of the backgrounds are not designed to be turned on a once (there are many that overlap). They are designed to give the user ultimate control over exactly what timeframe backgrounds to display on their charts.
The labels only appear when timeframe is 1 hour or less.

PT SessionsVersion 1.0 -
The sessions indicator helps you separate Asia, London & NY trading zones. We found it very useful to identify each session for scalping benefits.
The main strategy to this indicator is to scalp long/short at each sessions open/close where we suspect volatility to be at its peek. The high/low of each session is usually put in at the open/close of the zone. This helps set the tone for the upcoming sessions & more so for the full day. This indicator works well for FX and Crypto but was built specifically around crypto volatility times.
If you are interested in using our version of the PT Sessions , shoot us a message!
All in one CR- gRiZzLyRoCKsThis script is exclusively for users in Central America Costa Rica and Nicaragua as it does not take any input parameters for the session timing (hours) more than the price explained later here.
Features:
1. It paints Tradingview´s background to start differenciating between London session candle sticks and New York session candle sticks, only those two session.
2. Also it paints Tradingview´s background chart to differenciate weekends to make vissually attrative when a new trading week is starting.
3. It also prints a line that will differenciate when London Open candle stick has been printed on chart as well for New York open and the New York Stock Exchange market open.
Also the script will be printing labels for each day of the week, and here you need to make sure to enter the right input, the only input require. It is a price level so the script knows the coordinates to display week days labels, to avoid displaying on the candle sticks, so write as input a price number that is above the candle sticks by far at least 30 pips away.
The script its customizable, so please feel free to customize the colors at your own taste.
You can always hide some of the scripts markups on the chart, by clicking its configuration and checking/unchecking each element, e.g London Open, NYSE Open lines as example, or the labels with the week days names.
Important to know:
For Costa Rica and Nicaragua users, please make sure you have UTC-6 time zone selected for your tradingview's session, hopefully it will work as well for Panama users, but I did not tested.
Any question or bug report, please communicate with gRiZzLyRoCKs via tradingview´s chat.
For Central America users, I will be updating the script for each time zone change affecting London or New York sessions time schedule, depending if it is winter or summer.
PST:
Another feature-similar script will be released soon with time input capabilities for the remaining people around each country.

MM Session Open AlgoThe MM Session Open Algo is a strategy to catch the opening breakout of a security
displays the current session with background color
Entry, Stop Loss Based on Atr, and two Take Profit levels
Kill zone entries for New york and London session
provides valid signal for entry once price crosses entry line
and set "opening session price" to determine what signal you are looking for. based on time frame
shows the Daily,Weekly,Monthly high and low
average daily range
and comes with trend filter.
Directions are Simple
when price crosses and closes above entry line. you get in with the set inputs of Tp and Sl
or you can set buy/sell stops with the price provided for you and ride the wave of the direction it goes with he Tp and Sl provided
Link below or PM us for access to this indicator Happy Trading

LONDON NEWYORK SESION BY dobleRBackground colors that show open-close of London and New York market sessions
Written for CDMX, MEXICO (UTC-6).
Kviateq - Session PivotsFirst of all, I must say that this script wouldn't be possible without the help of one of the best script developers on TradingView - @ahancock (thanks a bunch for your help)
This script draws opening ranges for each of the sessions - Tokyo, London and New York and plots session high, low and pivot range of the previous session.
So if you trade London session - you would only take longs if we're above the Tokyo pivot range and vice versa for shorts.
Often times previous session's highs act as resistance and lows act as support, so careful trading around those levels.
It is obviously meant for lower timeframes, since each of the sessions only lasts a few hours.
Default settings are set to the exchange that I use and my timezone (GMT +7), so you might need to adjust the settings accordingly.
Tokyo - 12am GMT
London - 7am GMT
New York - 12pm GMT

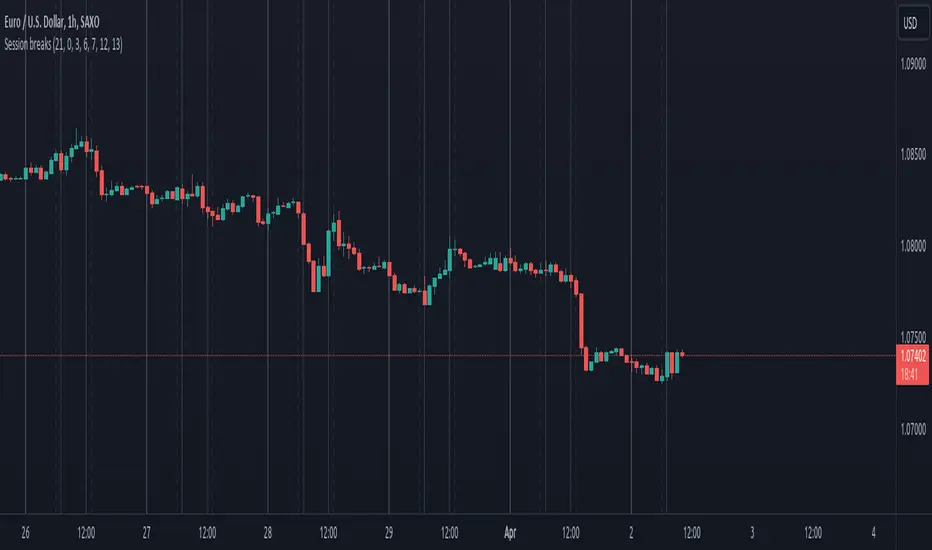
Session breaksThis indicator marks the start of each trading session around the world, starting with Tokyo at 0am UTC, London at 7am UTC, NY at 12pm and Sydney at 9pm, is non-intrusive (light gray vertical lines) and works with both UTC and exchanges' local time and handles DST / timezone offsets as well.
You can easily see that sometimes it acts as pivot-point especially on high volume.
And last, it is supposed to replace the "Session breaks" option that you can find in "Settings - Appearance" that only displays the end of session for the current exchange.

Forex Trading Sessions with Daylight Savings TimeV1 - Max WarrenDifferent version of the CM one but everything is configurable and easy to manage.
Daylight savings may also be toggled, I cannot automatically toggle it yet but hopefully with a pine update I will be able to.
It had the four main sessions but version two could possibly have all of them as optional toggles
Hope it is useful
