Market Movers: Sectoral IndexThe indicator will show the Sectors which are leading or lagging NIFTY50 index based on Alpha & Beta values. Stock selection can be done based on the respective Sectors.
Look for alpha & beta values.
Prefer one with high beta.
Greens are leaders & Blues are lagers.
This don't completely indicates a trend, but it can give the overview of a major trend & market movers.
Gray line is the base index NIFTY50, it is Zero.
Turn on Indicator Name Label in Settings > Chart Settings.
In intraday or positions, in a leading Sector there will be a leading stock, spot it out.
Make a sector wise watchlist of stocks.
Use higher or Daily timeframe for Swing trades.
Detailed descriptions are available in my previous Alpha & Beta indicators.
NIFTY

Wide BarsSimple scripts show the wide range bars within in the look back period, visualizing the bigger momentum.
Added four exponential moving averages which define the trend of the instrument.
Wide range candles in the direction of overall trend on higher timeframes; give confluence of higher participation in the same direction.
Note : Decent volume above the average volume with wide range candle adds more value.

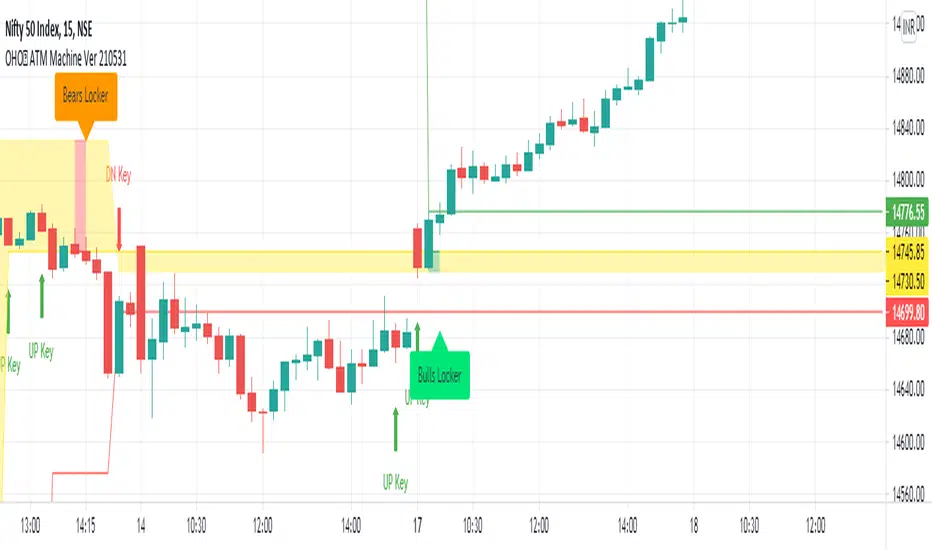
OHO ATM MachineStudies Used:
We have used different type of candle stick patterns, open, close, high, low, Moving Averages, volumes and Average True Ranges in creation of this indicator.
Usage:
It can be used for scalping and intra-day trading. It works best on Nifty 5 Minutes , 15 Minutes, 1 Hour, Daily, Weekly and Monthly Time Frames.
It provides easy to visualize multiple information:
1) It gives the correct Entry on Time. Yellow ATM Area, Means No Trade.
2) Fake Signals are shown when There is Sell Signal and Below is ATM Area.
3) Fake Signals are shown when There is Buy Signal and Above is ATM Area.
4) It gives proper Target at the time of Entry.
5) Stop Loss is Hit when The Candle Closes below ATM Area in Buying and vice versa.
6) No Trade is Recommended, when ATM Area is Yellow.
How to read OHO ATM Machine Indicator?
Buy - When ATM Area is Turned Green in Color First Time after Last Red.
Sell - When ATM Area is Turned Red in Color First Time after Last Green.
Stop Loss - When The Candle Closes below ATM Area in Buy Trade and When The Candle Closes above ATM Area in Sell Trade.
Target - Thin Green Line for Buy Trade and Thin Red for Sell Trade.
Trailing SL - We can Trail the Trade, till the Stop Loss is HIT.
Recommendations:
This can be used for Nifty, Bank Nifty, Stocks, Commodities, Bitcoin, Currency and any other tradable instrument.
What time frame should I use?
5 Minutes and 15 Minutes are best time-frames for Intra-day Trades.
15 Minutes and Hourly are best time-frames for Swing Trades.
Hourly and Daily are best time-frames for Short Term Trades.
But you can check different time-frames in Strategy Testing section or as per your requirements.
Disclaimer:
Past performance is not the guarantee of future performance.
For any type of queries kindly send us personal message.
Screener: Alpha & Beta IndexThis is a Index Screener which can short list the major Sectors contributing to NIFTY movement that day.
This helps in sector based trading, in which we can trade in the stocks which falls under that particular sector.
No need to roam around all the stocks in the whole watchlist.
It is recommended to create sector wise watchlist of all sectors. It will be easier to concentrate in only one sector.
For example in IT sector index there are certain stocks which contribute to the movement of IT sector.
This will be available in NSE (or exchange website).
For detailed description check out the descriptions in my previous 2 Alpha and Beta indicators.
Combine and use this screener with my previous Alpha & Beta indicator.

EMA Strategy - VaibhavRules are simple:
For CE only
1) Wait until the candle closes above the green line and a cross appears below the candle.
2) Enter on the next candle and keep your Sl at the previous candle low.
3) You can get multiple confirmation by add the pin bars from the settings.

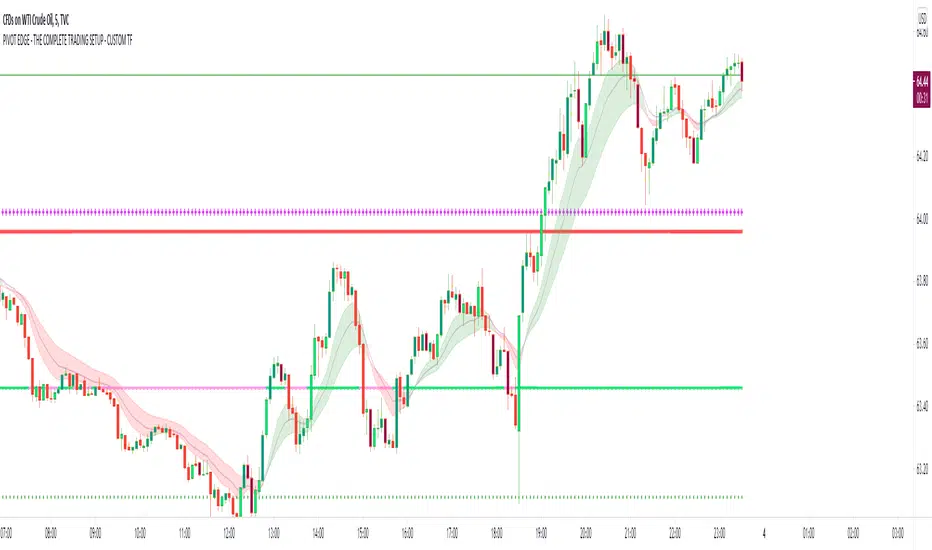
PIVOT EDGE - THE COMPLETE TRADING SETUP - CUSTOM TFIntroduction to the Indicator " PIVOT EDGE - The complete trading setup - CUSTOM TF " It means custom timeframe
The Foundation layout for this indicator is based on PIVOT's which are nothing but the most important levels that the price has respected in the past. The values for the pivots are derived from the key attributes of the price in any timeframe such as the OPEN, HIGH, LOW and CLOSE. These define the mood of the price and where it intends to move in relation to the previous range formed. Earlier HIGH - LOW i.e the RANGE indicates the possible movement that a stock can make in the current session and as per the calculated pivots we can possible find out the tentative supports and resistances. In addition to this indicator, It is advisable to use the price action theory which helps in taking a right decision for entries.
This indicator by itself is complete in nature, i.e it guides the user for possible entry levels and the projected targets that we can achieve and also the likely stop loss limit in case the price reverses. So beforehand even before entering into a trade position, the user can ascertain what can be his loss or max profit and then he can chose an optimum position size for favorable results.
The beauty of this Indicator lies in the fact that it can be used for all types of trading like Scalping, Intra day, Swing or Positional and Investments also. It works on all timeframes and across all market segments like EQUITY, COMMODITIES , FUTURES , OPTIONS , FOREX etc.
This indicator can be used for any exchange and any time zone also without any changes or adjustments needed.
Now let us understand the features of this Indicator in detail.
TIMEFRAME - It has options to choose between Day, week and month as timeframe. By default it is set to Day timeframe
DISPLAY MAJOR LEVELS - These are the important support and resistance levels calculated based on the past price data. Most important ones are marked in BOLD RED and BOLD GREEN between which the price tends to move generally.
Apart from these, We have breakout level marked in light green and if price breaks this level we can expect targets upto extended levels and beyond marked in blue.
we also have breakdown level marked in light red and if price breaks this level we can expect targets down up to extended levels and below it marked in blue.
In addition I have coded intermediate target levels that appear in light gray between the extended levels or blue lines. Sometimes when the gap between these targets are huge, price cannot reach the targets and reverses at these intermediate targets. You can use them as targets or trailing stop loss based on your plan
DISPLAY HIDDEN LEVELS - These levels are intermediate supports and resistances that can be used whenever the present day indicated range is very wide. Whenever we have an explosive moments in market the range of that day is very huge and so he next day support and resistance band becomes very wide indicating the sideways movement day within that range. And on those days we can switch on the hidden levels and the price respects these levels and most of the days it is inside this range only.
DISPLAY PREVIOUS HIGH / LOW / CLOSE - I have included Daily / Weekly and monthly levels. It is important to know the earlier highs / lows and close since price respects it very must just like support and resistance .
PEMA - This is an important EMA based indicator which potentially indicates curves of support and resistance during retracements or pullbacks. If the curves are breached then the trend is reversed and the price will tend to move to the next pivots .
IMPORTANT NOTE : This indicator does not guarantee any favorable results nor protect your from any loss. You own the complete risk of your trades. It is suggested that you use this indicator and do back testing for considerable period to understand how it works the the potential win rate it can give. If you have any doubts or need any clarifications of assistance in understanding, you can message me and I will try to help.
Happy and Safe trading - Mohan from PIVOT EDGE
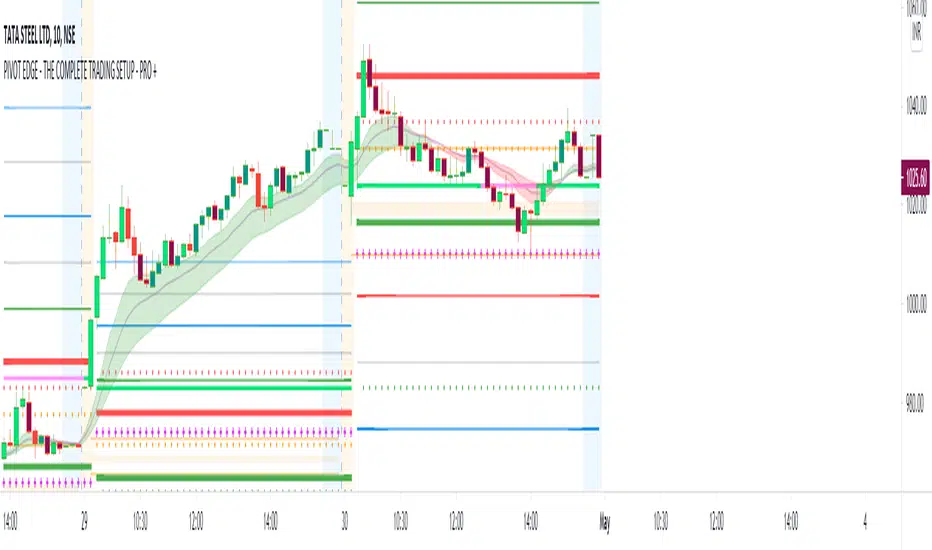
PIVOT EDGE - THE COMPLETE TRADING SETUP - PRO +Introduction to the Indicator " PIVOT EDGE - The complete trading setup - PRO+ "
The Foundation layout for this indicator is based on PIVOT's which are nothing but the most important levels that the price has respected in the past.The values for the pivots are derived from the key attributes of the price in any timeframe such as the OPEN, HIGH, LOW and CLOSE. These define the mood of the price and where it intends to move in relation to the previous range formed.Earlier HIGH - LOW i.e the RANGE indicates the possible movement that a stock can make in the current session and as per the calculated pivots we can possible find out the tentative supports and resistances. In addition to this indicator, It is advisable to use the price action theory which helps in taking a right decision for entries.
This indicator by itself is complete in nature, i.e it guides the user for possible entry levels and the projected targets that we can achieve and also the likely stop loss limit in case the price reverses. So beforehand even before entering into a trade position, the user can ascertain what can be his loss or max profit and then he can chose an optimum position size for favorable results.
The beauty of this Indicator lies in the fact that it can be used for all types of trading like Scalping, Intra day, Swing or Positional and Investments also. It works on all timeframes and across all market segments like EQUITY, COMMODITIES , FUTURES , OPTIONS , FOREX etc.
This indicator can be used for any exchange and any time zone also without any changes or adjustments needed.
Now let us understand the features of this Indicator in detail.
TIMEFRAME - It has options to choose between Day, week and month as timeframe. By default it is set to Day timeframe
DISPLAY MAJOR LEVELS - These are the important support and resistance levels calculated based on the past price data. Most important ones are marked in BOLD RED and BOLD GREEN between which the price tends to move generally.
Apart from these, We have breakout level marked in light green and if price breaks this level we can expect targets upto extended levels and beyond marked in blue.
we also have breakdown level marked in light red and if price breaks this level we can expect targets down up to extended levels and below it marked in blue.
In addition I have coded intermediate target levels that appear in light gray between the extended levels or blue lines. Sometimes when the gap between these targets are huge, price cannot reach the targets and reverses at these intermediate targets. You can use them as targets or trailing stop loss based on your plan
DISPLAY HIDDEN LEVELS - These levels are intermediate supports and resistances that can be used whenever the present day indicated range is very wide. Whenever we have an explosive moments in market the range of that day is very huge and so he next day support and resistance band becomes very wide indicating the sideways movement day within that range. And on those days we can switch on the hidden levels and the price respects these levels and most of the days it is inside this range only.
DISPLAY PREVIOUS HIGH / LOW / CLOSE - I have included Daily / Weekly and monthly levels. It is important to know the earlier highs / lows and close since price respects it very must just like support and resistance .
PEMA - This is an important EMA based indicator which potentially indicates curves of support and resistance during retracements or pullbacks. If the curves are breached then the trend is reversed and the price will tend to move to the next pivots .
VALUE AREA - One of the most important feature of this Indicator is this which is derived from the Volume profile concepts. It indicates the fair value area Indicated by orange band and the upper and lower limits indicated by orange lines. Whenever the price is overvalued or undervalued, it is pushed back to its fair value and we can judge the present price position in relation to the value area and then take position in anticipation of the price reaching its fair value area. This must be coupled with price action for favorable results.
IMPORTANT NOTE : This indicator does not guarantee any favorable results nor protect your from any loss. You own the complete risk of your trades. It is suggested that you use this indicator and do back testing for considerable period to understand how it works the the potential win rate it can give.
If you have any doubts or need any clarifications of assistance in understanding, you can message me and I will try to help.
Happy and Safe trading - Mohan from PIVOT EDGE
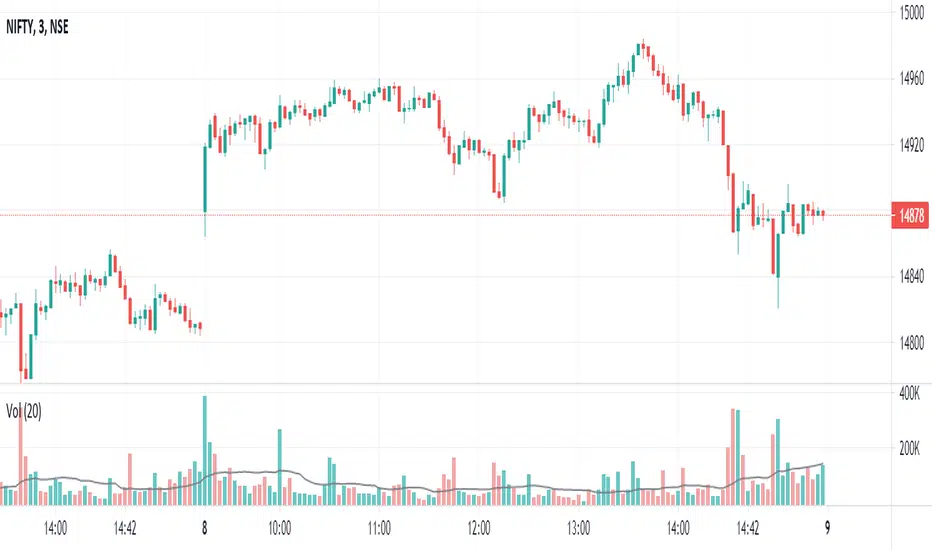
Nifty 20 VolumeThis script computes the volume for Nifty 50 index. I am using top 20 stocks here that constitute about 75% of the Nifty 50. I had used the script created by @shijithlal as a base for this. He has used all 45-50 stocks in his script. You can look that up if you want a more accurate volume.

Winning tickThis screener can be used for intraday purpose only. it generates Buy and sell signal based on pre defined criteria. script can be used across all product type however this can be used in different time frames.
please note before using this script please do necessary back testing from your end,.
Disclaimer : please consult your financial advisor before Buying/selling stocks based on this indicator. This is created for educational purpose and user of this indicator is solely responsible for result.

RR 2
Software signal with Trend of the market/Central Pivot Range combined with RR1 for better results.

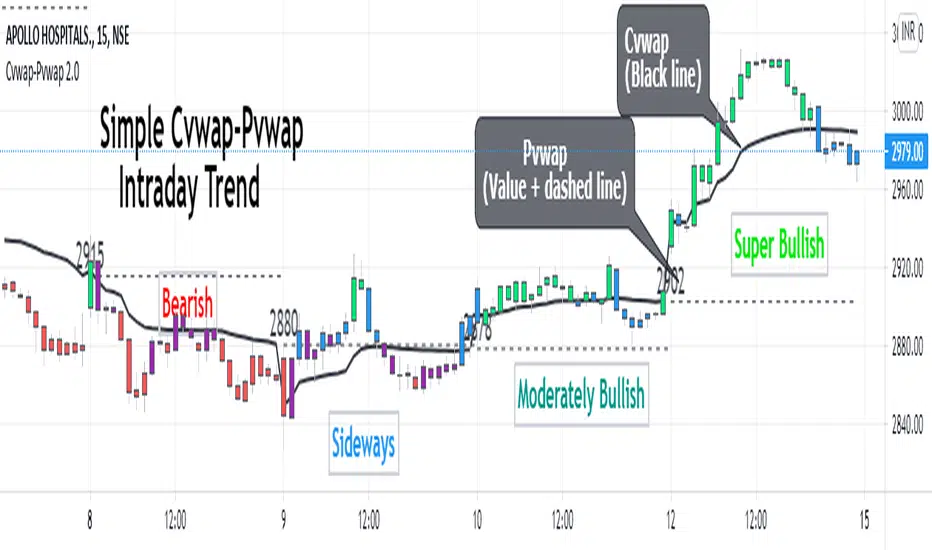
Cvwap-Pvwap 2.0A simple vwap based Intraday trend indicator.
Volume-Weighted Average Price (VWAP) - the average price weighted by volume, starts when trading opens and ends when it closes. This can help institutions buy or sell in large orders, without disturbing the market.
After buying or selling, institutions compare instrument price to closing VWAP values at end of the day.
For big financial institutions;
A buy order executed below the VWAP value, considered a good fill because the security was bought at a below average price.
A sell order executed above the VWAP would be deemed a good fill because it was sold at an above average price.
Simple price based moving average is not helpful for them; = as it doesn't incorporates volume traded. Hence - VWAP :)
So how it helps us in decoding the IntraDay-trend? - Through a 2 day vwap co-relation.
So, Closing value of previous day vwap = Pvwap
Today's running vwap = Cvwap
Defining the IntraDay Trend:
Moderately Bullish = candle closing price above Pvwap but below Cvwap
Super Bullish = Closing price is above both (Cvwap and Pvwap)
Moderately Bearish = Closing price is above Cvwap but below Pvwap
Super Bearish = Closing Price is below both (Cvwap and Pvwap)
A big gap between the Cvwap and the candle closing price defines the strong participation from institutions in that direction. (Strong Trend)
Moving with the smart money, in the overall trend is a wise decision for any intraday trader and this helps at its best.
Custom GAP UP scanner for NIFTY StocksThe security function can be called 40 times in a codescript. We can therefore scan about 40 stocks out of NIFTY 50 stocks with a single script.
This code can be modified to search for other scripts by changing the condition function
condition() => open > (close * 1.0025)
Only stocks which have gap up of 0.25% or more will be reported.

MAST TrendHello Traders !!
This is a simple super trend based MAST trend.
By default the supertrend is 10 period with 3 ATR multiplier.
A moving average is used to benefit from the pullback entries.
Bullish Pullback : Price above Supertrend & below MA
Bullish: Price above Supertrend and above MA
Bearish pullback : Price below Supertrend & above MA
Bearish : Price below Supertrend & below MA
Refer to investopedia or any relevant articles for in detail about Supertrend.

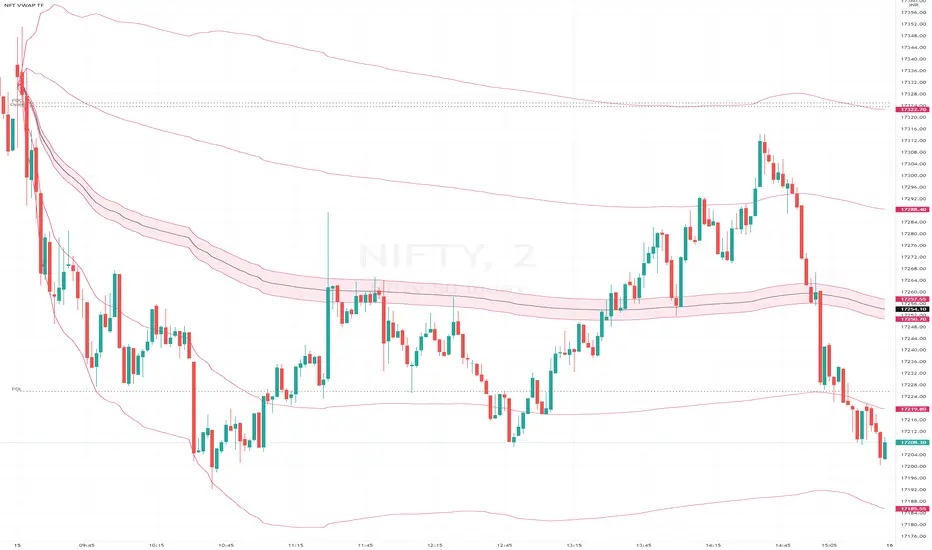
Vwap Pvwap Intraday Trend - NiftyKishoreHello Traders !!
This is a simple trend identification script which is based on the current vwap (Cvwap) and previous vwap (Pvwap).
Pvwap in the sense; previous day vwap closing value.
Bullish: price is closing above the current day vwap and previous day vwap(pvwap).
Bearish : Price is closing below the current day vwap and previous day vwap (pvwap).
Made a change to the barcolors as well :)
Bullish
Green Bar: close is above Pvwap and Cvwap.
Blue bar: close is above Pvwap but below Cwap.
Bearish
Red bar: close is below Pvwap and Cvwap.
Purple bar: close is below Pvwap but above Cvwap.
Simple but effective
Cheers !!
Nifty VWAP
NIFTY INDICES IS WIEGHTAGE OF 50 STOCKS AS DECIDED BY EXCHANGE.
NSE VWAP CALCULATES COMBINED VWAP OF THESE 50 STOCKS AND GENERATES VWAP FOR NIFTY
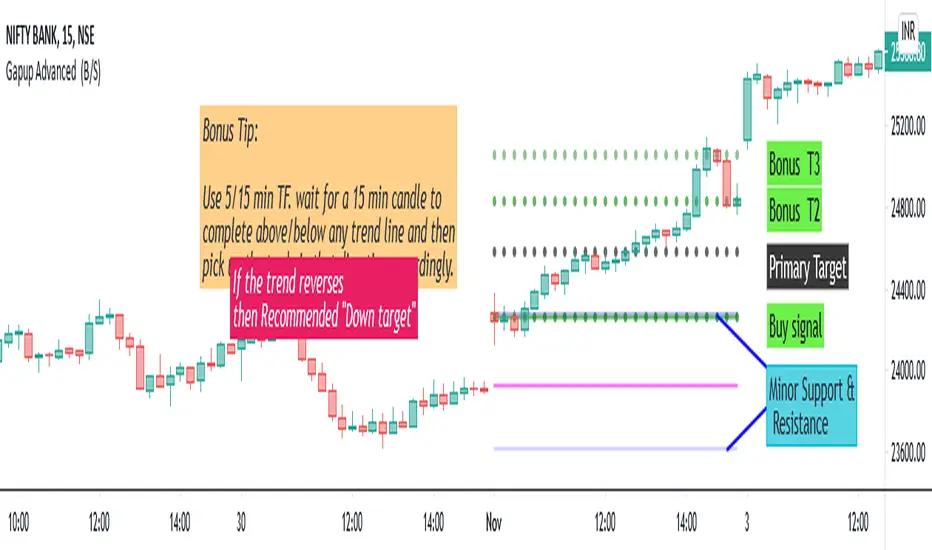
Gapup Advanced (B/S)This indicator provides you support and resistance line for Intraday trading. We have made the calculations using the historical data of (EMA 10, open ,high,low,close,52week high,52w low). We tried to capture the rapid moment of stock depending on the previous day values and EMA 10. Unlike the lagging indicator which changes the values periodically.
This is a Leading Indicator which uses TRADINGVIEW's powerful code "Resolution "-ie the indicator values will not change for the intraday, though you change to any timeframe.
Our indicator will take care of the work of conditioning and plotting and plot only if it matches all the criteria. So plotting of EMA is not required. If you want to plot EMA manually ,I would (recommend tf=15min,10ema) .
How to use this Indicator ?
When we can go long?
When you get a green line along with dot, go for BUY. Once the candle hits our target (i.e the black dotted line) close the trade and book your profits. And once the dot in the green line is off ,it means the stock will not go beyond primary target. When the dot in the green line is off, it means it has the possibility to go DOWN further.
Bonus Tip: If the 15 min candle closes above any of the trend line and in the next candle if it takes support from that line itself then it has the possibility to go up further.
When we can go short ?
When you get a red line along with dot, go for SELL. Once the candle hits our target (i.e the black dotted line) close the trade and book your profits. And once the dot in the red line is off , it means the stock will not go beyond primary target. When the dot in the red line is off, it means it has the possibility to go UP further.
Bonus Tip: If the 15 min candle closes below any of the trend line and in the next candle if it faces the resistance from that line itself then it has the possibility to go down further.
The other 2 green dotted lines/ red dotted lines are Bonus targets 2 and 3.
ie. The trend may reverse @ any point above the primary target in case of buy.
Ie. The trend may reverse @ any point below the primary target in case of sell.
To be a Consistent Profitable Trader:
Always aim for the one adjacent level above or below the current level.
Unique Feature - "THE PINK LINE"
In case of buy call, if the trend reverses we give you a recommended down target.
In case of sell call , if the trend reverses we give you a recommended up target.
Minor Support & Resistance line:
Also if the trend reverses,
In case of buy, minor support and resistance are present below.
In case of sell, minor support and resistance are present above.
It can used to trade in Options, futures ,equity. Suitable for all high moment stocks,indices, commodities.
Final Bonus Tip:
I always recommend for every trader to trade with min stock quantity eg:1-10 with any indicator/ strategy. Then you can choose to trade in lots in futures and options.
It is useful for scalpers and Intraday traders.
Recommended Time Frame : 5/15 min.
Suitable for all stocks,indices, commodities .
BANKNIFTY - Anchored VWAP
An attempt to make Anchored VWAP for NSE:BANKNIFTY from Volume of underlying securities.
Notes :
- To cross check one may verify by changing Symbol to any stock and use in-built VWAP indicator
- Works only with BANKNIFTY and stocks. Does not work with other NSE Indices

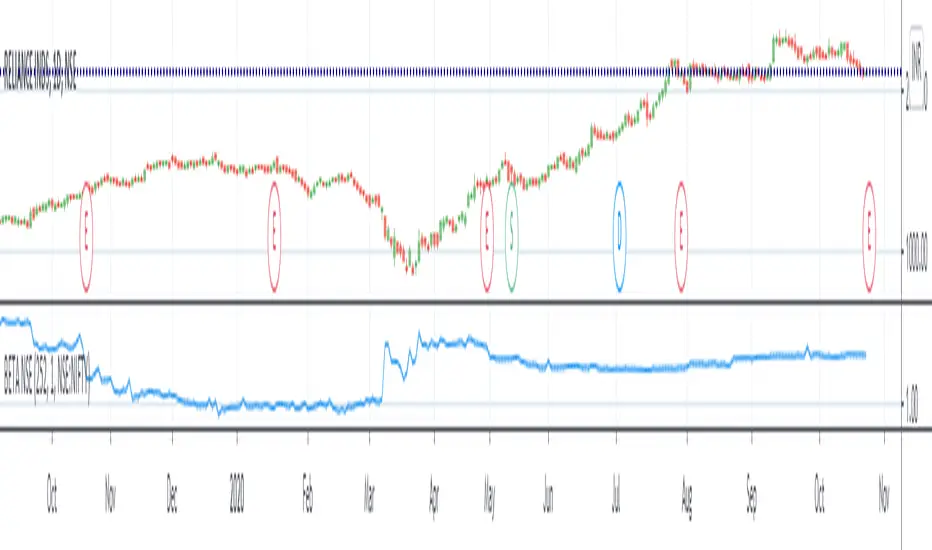
BETA (against any benchmark index - defaulted to NSE:NIFTY)Beta value of a stock relative to benchmark index. Thanks to Ricardo Santos for the original script. This script is adapted from it.
To understand beta, refer Investopedia link: www.investopedia.com
A beta value of 1 means the stock is directly correlated to benchmark index - volatility would be same as overall market.
Beta value less than 1 and greater than 0 means the stock is less volatile than the market.
Beta value more than 1 would mean the stock is more volatile than the market.
A beta value of 1.2 would roughly translate to the stock being 20% more volatile than the overall market.
A negative beta value indicates the stock is inversely correlated to market.
In the example chart, you can see the Beta value change in NSE:RELIANCE with respect to NSE:NIFTY.
NIFTY Money Flow - Scalping/SwingBrief Description About Script
It considers the change of price in the direction
change of price is +Ve then considered as +Ve money flow
-Ve then considered as -Ve money flow
and it multplied by Volume change
This Strategy works best with NIFTY
For Scalping:-
Settings:- 1 Min Candle Time Frame, Length 20
For Swing:-
Setting:- 30 Min Candle Time Frame, Length 11
How to use it?
Common usage:-
Buy - When turns Red to Green Buy by keeping 1.5 * ATR as SL or Trailing SL(Optional) at the same time frame
Sell - When turns Green to Red SL by keeping 1.5 * ATR as SL or Trailing SL(Optional) at the same time frame
Trend reversal:-
Draw Divergence between indicator and price
Buy - Indicator forms Higher Highs(Red Side), Price Lower Lows
Sell - Indicator forms Lower Lows(Green Side), Price Higher Highs
Breakouts:-(Less Accurate compared to other scenarios)
End of Triangel/Box Indicator Turns Red to Green - Bullish Breakout, Green to Red Bearish Breakout
can use for breakouts chart patterns and guess which side it's going to break
can use for reversal as well by observing divergence between price & indicator
Note:-
In the future, an updated version is coming with it auto-generated buy/sell signal on the chart & gives backtesting results as a strategy

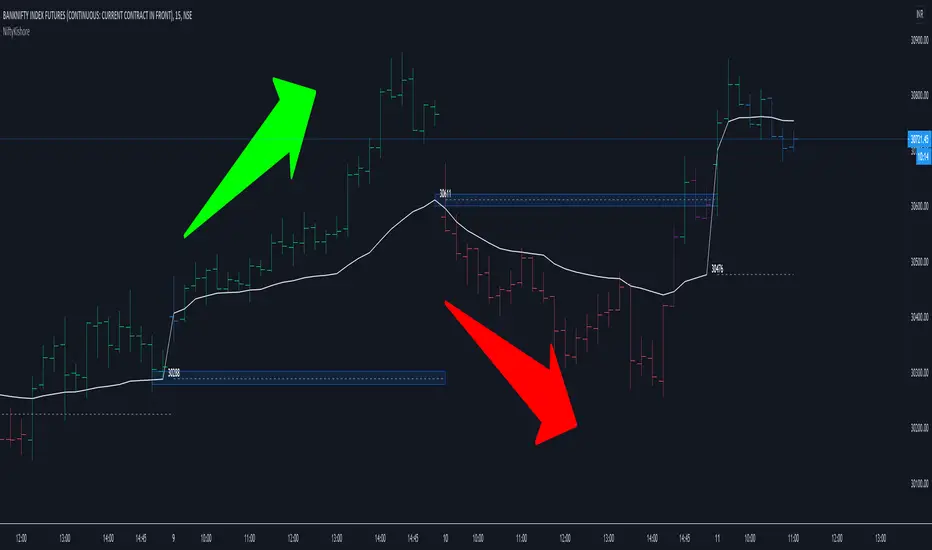
Crazy Signals - Early Detection of a Short Term TrendThis is a simple yet powerful tool that helps you detect Trends for the short term.
Time Frames:
- Avoid using very small time frames as there will be too many signals in a short period
- Intraday: 15 mins, 30 mins, 60 mins seem to detect trends well
- Overnight Trades: 60 mins
- Positional: 1D is recommended
- For Investment, one can week a weekly timeframe
Rules of Engagement:
1. The Upward Arrow (Green) indicates possible upside. While the Downward Arrow (Orange) indicates a possible downside
2. Not every Signal has to be traded. Rules to check before taking a trade:
a. The candle on which the Signal is generated, should be either small or medium size compared to other candles on the chart. If the candle is large, ignore it
b. In case of a Buy Signal, entry should be made once the Price crosses above the High made on the Signal Candle
c. In case of a Sell Signal, entry should be made once the Price crosses below the Low made on the Signal Candle
d. For extra caution, in steps b & c, one can wait for the current candle to close higher than the High of Signal Candle for Buy Signal and close lower than the Low of Signal Candle (this is for extra safe traders)
This tool is to be used for trades that usually last for a few candles.
Please do your own research before trading.

PremiumSAR indicator by Alpha2SigmaConcept:
Short term momentum pattern with a trend filter
Setup:
It can be observed on charts that when a candle cuts an important support or resistance level a good move follows on the side of the breakout. The extent of the breakout differs from candle to candle, however the move on break from the support/resistance level to its new pivot point is large enough to be considered as a potential profit.
Challenge:
1. Waiting for end of the day to initiate or exit a trade can put the account at a great risk if you are trapped on the wrong side of the move
2. Lowering the timeframe will lead to
a. whipsaws (too many failed signals)
b. active time and efforts (time spent on trading signals vs. productive work)
c. slippages (execution delays and spread)
d. charges (higher number of transactions)
Expectation:
We need a system which is relatively painless from the perspective of
• time invested (return on time invested)
• money spent on stock trading charges
• conservative when in losses and aggressive when it comes to letting profits run
Filter:
1. Select hourly time frame (~55-60 signals per annum / ~ 5-6 per month)
2. Select “Premium SAR indicator by Alpha2Sigma” on Tradingview charting platform
Entry:
1. Long Trades: When the Premium SAR indicator turns positive
2. Short Trades: When the Premium SAR indicator turns negative
Exit:
1. Long Trades: When the Premium SAR indicator turns negative
2. Short Trades: When the Premium SAR indicator turns positive
Position sizing:
1. 3x Leverage is preferred
RISK DISCLOSURE:
• The indicator demonstrates trending moves and should not be used as a trading recommendation
• Active trading is not suitable for everyone
• Past performance does not guarantee future results

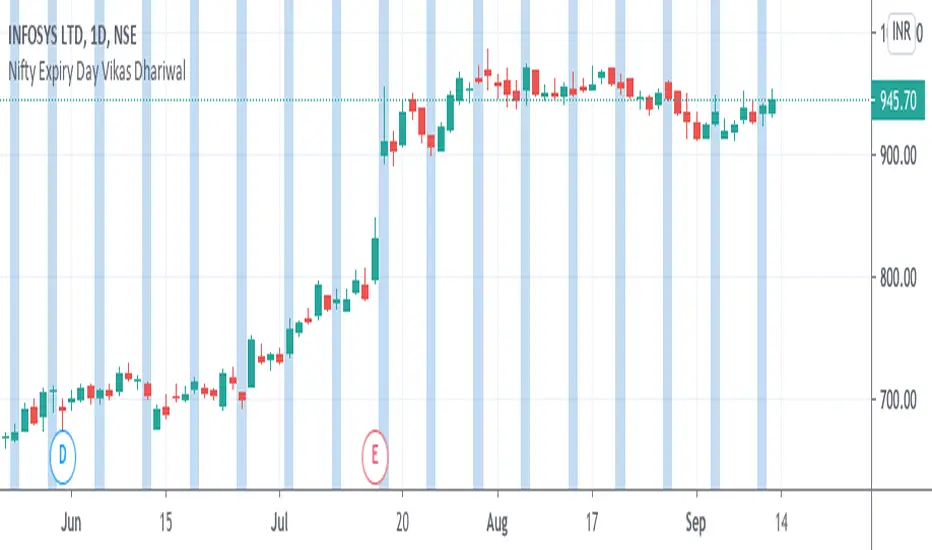
Nifty Expiry Day Vikas DhariwalStrategy for Expiry day plan
Here you can find easy expiry day of nifty and bank nifty
mark Thursday with color to find that day for test any expiry strategy plan
thanks call for more updated 8287335651