Options Scalping V2This Indicator is Owned by Team Option Scalping.
It has 4 Plots and 2 Tables.
This indicator to be used only in BankNifty Futures
VWAP ( Volume weighted average price )
• User can input the source and enable/disable the VWAP from input section.
• When price is more than the VWAP its Bullish Trend and vice versa.
VWMA ( Volume weighted moving average )
• Default value of 20 is used in VWMA . User can enable/disable it from input section.
• When price is more than the VWMA its Bullish Trend and vice versa.
Parabolic SAR
• User can input “start”, “increment” and “maximum” values from input section and can enable/disable SAR also.
• When price is more than the Parabolic SAR its Bullish Trend and vice versa.
SuperTrend
• User can input ATR Period and ATR Multiplier values from input section. By defaults it’s 10 and 2.
• User have option of enable/disable “Change ATR calculation Method”, if enabled then ATR is calculated differently for SuperTrend.
• Enable/disable “BUY/SELL signals” on SuperTrend.
• When price is more than the SuperTrend its Bullish Trend and vice versa.
Top Right Corner TABLE ( 6 , 10 )
When you are trading in Banknifty futures , we have to check major Banks which is contributing to Banknifty move. So we have given that in this tab.
This table consist data of 9 following stocks:
• BankNifty
• Nifty
• Dow
• INDIA
• VIX
• HDFC
• ICICI
• KOTAK
• AXIS
• SBI
And following data of each stock has been provided:
• LTP
• Daily Change
• Daily Percentage Change
• 15-minute Change Percentage
• 1-Hour Change Percentage
Bottom Right Corner TABLE (3, 6 )
This table consist of 4 indicators values and Up/Down indicator:
• VWMA (When price is more than the VWMA its Bullish and vice versa)
• SuperTrend (10.2, When price is more than the SuperTrend its Bullish and vice versa.)
• RSI (14)
• VWAP (When price is more than the VWAP its Bullish and vice versa.)
Nifty50

Nifty Relative PerformanceDISCRIPTION:-
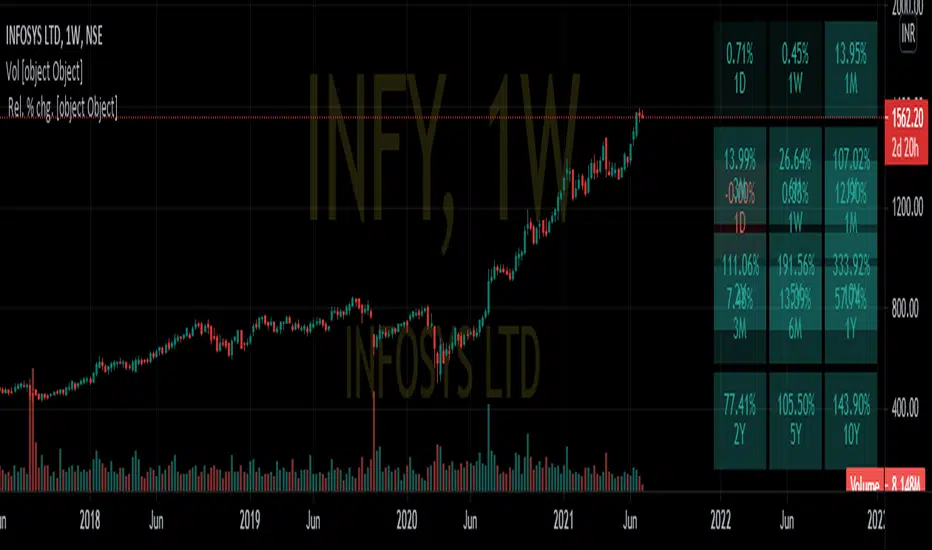
This indicator is used to determine relative performance of a stock based on different time intervals as well as compared to benchmark indices as Nifty 50,Nift IT, Nifty auto etc.
USE CASE SCENARIO:-
The top right table provide performance of stock based on different interval
while the bottom table depicts its relative performance compared to an index
eg:-
INFY compared to Nifty 50
&
INFY compared to Nifty IT
DISCLAIMER:-
if using an android device kindly toggle full-screen mode and view it horizontally
In desktop full screen mode may provide better comprehensive view
BankNifty - VWAP + StdDev Bands- By Default the script draws Daily VWAP for Bank Nifty based on Futures Volume or underlying Index Stocks based on user input
- Optionally one may Anchor it to Week/Month etc or anchor it from a particular Time.
- It also draws 3 Standard Deviation Bands from the VWAP based on User Input.
- Optionally draws Previous VWAP Close for and Bullish or Bearish Move.
- It works with NIFTY 50 as well but only using Futures Volume(Pine limitation to number of security calls) . Please change the Symbol and Futures Volume symbol to "NSE:NIFTY" and "NSE:NIFTY1!" NSE:BANKNIFTY NSE:NIFTY

Screener: Alpha & Beta IndexThis is a Index Screener which can short list the major Sectors contributing to NIFTY movement that day.
This helps in sector based trading, in which we can trade in the stocks which falls under that particular sector.
No need to roam around all the stocks in the whole watchlist.
It is recommended to create sector wise watchlist of all sectors. It will be easier to concentrate in only one sector.
For example in IT sector index there are certain stocks which contribute to the movement of IT sector.
This will be available in NSE (or exchange website).
For detailed description check out the descriptions in my previous 2 Alpha and Beta indicators.
Combine and use this screener with my previous Alpha & Beta indicator.

Nifty50 Bullish Bearish Scanner▪ How to use ?
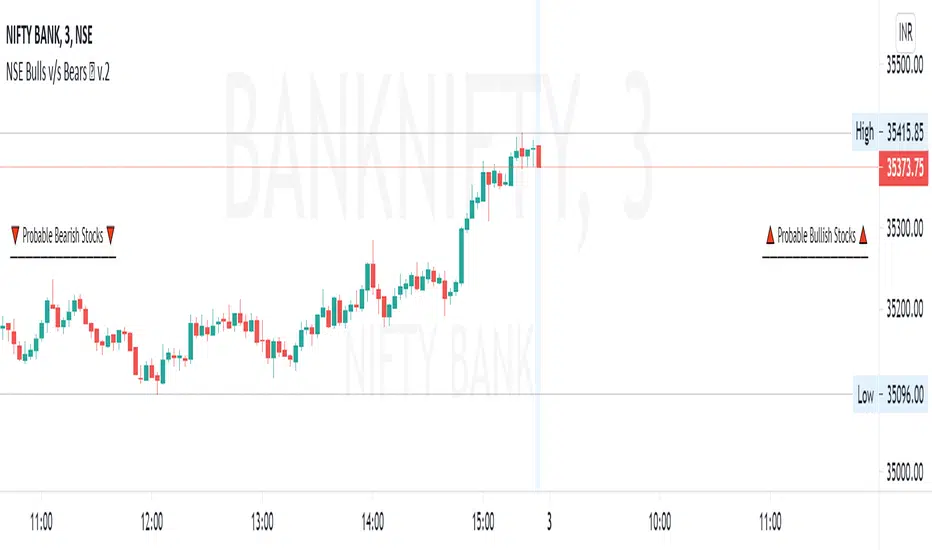
The Screener has 40 stocks which are selected from NSE Nifty50 (list is given below) (cannot be editable) and after 9:15 am IST, it will scan most probable Bullish and Bearish stocks, both stocks will be labelled separately.
▪ Entry may be made at specified near the Stock name and target and SL is also mentioned nearby. Priority to be given to the stop-loss first. User can change profit percentage and Stop-loss percentage as per need, max. 10% can be done, default SL = 0.5% and Profit = 2%. Do use the indicator with other analysis, indicators, strategies, etc. Do not wait for target to hit, also use your calculations to book profit.
▪ How the figures are calculated ?
Conditions for Bullish and Bearish are calculated when trade day starts, and the default timeframe is for 1 Day (i.e.-Current Whole Day)
means the target and stop-loss are for intraday whole day, which can be changed to week, month, etc., Here Entry points are calculated depending upon the current days open price, with consecutive profit and stop-loss are calculated. The Percentage profit and stop-loss are
calculated including previous days price also, confusion to be avoided with figures.
▪ Caution :
If in morning any stock comes in any of list and if it goes from that list, that means the reversal took place for that stock(s) and stop-loss is hit. If any stock is opened Gap-Up or Gap-Down that it will come in either of the Bullish / Bearish stocks, then those stocks maybe
avoided.
▪ Which Nifty50 Stocks are included ?
Top 40 stocks from NSE Nifty50 are selected which are included are below =
ADANIPORTS, ASIANPAINT, AXISBANK, BAJAJ_AUTO, BAJFINANCE, BHARTIARTL, BPCL, BRITANNIA, CIPLA, DIVISLAB, DRREDDY,
EICHERMOT, GRASIM, HCLTECH, HDFC, HDFCBANK, HEROMOTOCO, HINDALCO, HINDUNILVR, ICICIBANK, INDUSINDBK, INFY
ITC, JSWSTEEL, KOTAKBANK, LT, M_M, MARUTI, RELIANCE, SBILIFE, SBIN, SUNPHARMA, TATACONSUM, TATAMOTORS, TATASTEEL
TCS, TECHM, TITAN, UPL, WIPRO.
▪ Indicator options :
Choice to hide bearish / bullish stocks labels, change background color of label, change text color of label, user can change position of label from the current bar, modify stop-loss and profit percentage.
▪ Alerts
You can create an alert from it easily. No additional configuration is required, message and alert on close is used the code.
The current timeframe candle is considered as alerts is set to once per bar close.
▪ Note: The initial load may be slow. If something doesn't seem to work, you can try the following:
- wait more time for it to load.
- hide & show or remove & add back to chart.
- don't add the indicator to chart multiple times in a short amount of time, as you may be rate limited
- Remember that majority of indicators fails in a sideways market, also every indicator is not 100% accurate.
▪ Disclaimer
Please remember that past performance may not be indicative of future results.
Due to various factors, including sudden changing market conditions, the indicator may not perform good.
This description and the indicator don’t provide any financial advice.
PIVOT EDGE - THE COMPLETE TRADING SETUP - PRO +Introduction to the Indicator " PIVOT EDGE - The complete trading setup - PRO+ "
The Foundation layout for this indicator is based on PIVOT's which are nothing but the most important levels that the price has respected in the past.The values for the pivots are derived from the key attributes of the price in any timeframe such as the OPEN, HIGH, LOW and CLOSE. These define the mood of the price and where it intends to move in relation to the previous range formed.Earlier HIGH - LOW i.e the RANGE indicates the possible movement that a stock can make in the current session and as per the calculated pivots we can possible find out the tentative supports and resistances. In addition to this indicator, It is advisable to use the price action theory which helps in taking a right decision for entries.
This indicator by itself is complete in nature, i.e it guides the user for possible entry levels and the projected targets that we can achieve and also the likely stop loss limit in case the price reverses. So beforehand even before entering into a trade position, the user can ascertain what can be his loss or max profit and then he can chose an optimum position size for favorable results.
The beauty of this Indicator lies in the fact that it can be used for all types of trading like Scalping, Intra day, Swing or Positional and Investments also. It works on all timeframes and across all market segments like EQUITY, COMMODITIES , FUTURES , OPTIONS , FOREX etc.
This indicator can be used for any exchange and any time zone also without any changes or adjustments needed.
Now let us understand the features of this Indicator in detail.
TIMEFRAME - It has options to choose between Day, week and month as timeframe. By default it is set to Day timeframe
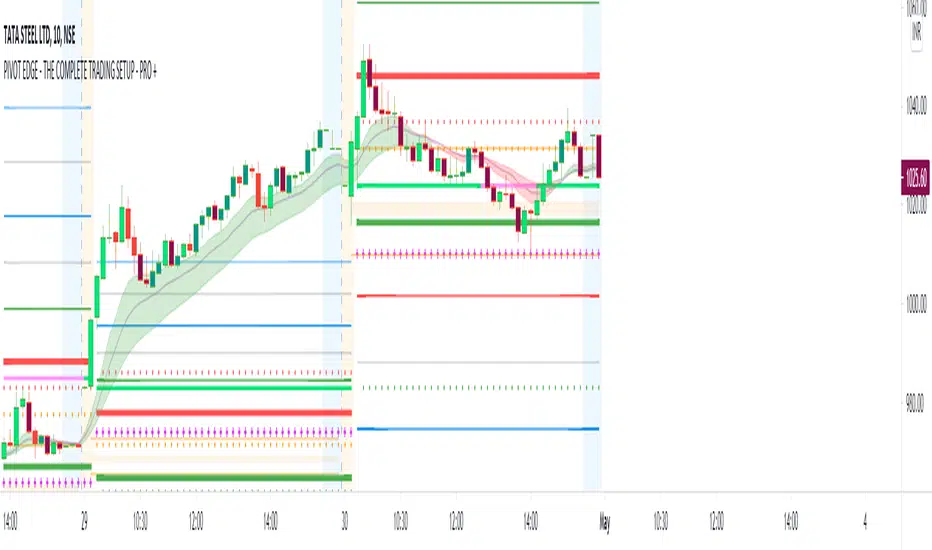
DISPLAY MAJOR LEVELS - These are the important support and resistance levels calculated based on the past price data. Most important ones are marked in BOLD RED and BOLD GREEN between which the price tends to move generally.
Apart from these, We have breakout level marked in light green and if price breaks this level we can expect targets upto extended levels and beyond marked in blue.
we also have breakdown level marked in light red and if price breaks this level we can expect targets down up to extended levels and below it marked in blue.
In addition I have coded intermediate target levels that appear in light gray between the extended levels or blue lines. Sometimes when the gap between these targets are huge, price cannot reach the targets and reverses at these intermediate targets. You can use them as targets or trailing stop loss based on your plan
DISPLAY HIDDEN LEVELS - These levels are intermediate supports and resistances that can be used whenever the present day indicated range is very wide. Whenever we have an explosive moments in market the range of that day is very huge and so he next day support and resistance band becomes very wide indicating the sideways movement day within that range. And on those days we can switch on the hidden levels and the price respects these levels and most of the days it is inside this range only.
DISPLAY PREVIOUS HIGH / LOW / CLOSE - I have included Daily / Weekly and monthly levels. It is important to know the earlier highs / lows and close since price respects it very must just like support and resistance .
PEMA - This is an important EMA based indicator which potentially indicates curves of support and resistance during retracements or pullbacks. If the curves are breached then the trend is reversed and the price will tend to move to the next pivots .
VALUE AREA - One of the most important feature of this Indicator is this which is derived from the Volume profile concepts. It indicates the fair value area Indicated by orange band and the upper and lower limits indicated by orange lines. Whenever the price is overvalued or undervalued, it is pushed back to its fair value and we can judge the present price position in relation to the value area and then take position in anticipation of the price reaching its fair value area. This must be coupled with price action for favorable results.
IMPORTANT NOTE : This indicator does not guarantee any favorable results nor protect your from any loss. You own the complete risk of your trades. It is suggested that you use this indicator and do back testing for considerable period to understand how it works the the potential win rate it can give.
If you have any doubts or need any clarifications of assistance in understanding, you can message me and I will try to help.
Happy and Safe trading - Mohan from PIVOT EDGE
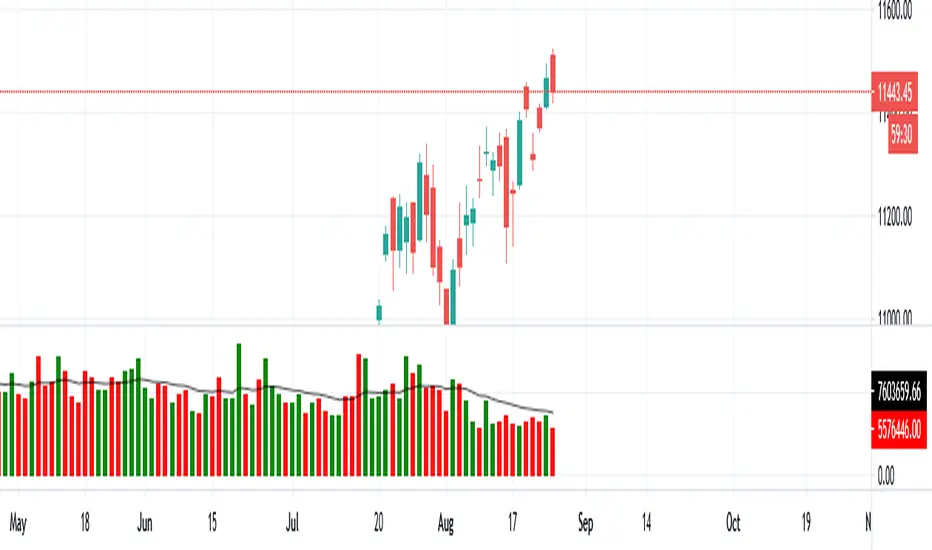
Nifty 20 VolumeThis script computes the volume for Nifty 50 index. I am using top 20 stocks here that constitute about 75% of the Nifty 50. I had used the script created by @shijithlal as a base for this. He has used all 45-50 stocks in his script. You can look that up if you want a more accurate volume.

Alpha & BetaHow to use Alpha(α)?
If Alpha is positive the stock outperforms, if the value is negative means the stock underperforms.
α < 0: The investment has earned too little for its risk (or, was too risky for the return)
α = 0: The investment has earned a return adequate for the risk taken
α > 0: The investment has a return in excess of the reward for the assumed risk
How to use Beta(β)?
β = 1: Exactly as volatile as the index
β > 1: More volatile than the index
β < 1 > 0: Less volatile than the index
β = 0: Uncorrelated to the index
β < 0: Negatively correlated to the index
β > 2: Trending stock
Higher the β higher risk/reward
Example: If the beta is 1.1, the share price is like to move by 10% more than the index
Trading Tip
Choose a stock with Alpha greater than 0 and Beta greater than 1.9 for intraday in 5min timeframe for long positions
Remember that such stocks will have high risk and high reward
Shortlist stocks with Beta greater than 1.9 for next day in 5min timeframe

Winning tickThis screener can be used for intraday purpose only. it generates Buy and sell signal based on pre defined criteria. script can be used across all product type however this can be used in different time frames.
please note before using this script please do necessary back testing from your end,.
Disclaimer : please consult your financial advisor before Buying/selling stocks based on this indicator. This is created for educational purpose and user of this indicator is solely responsible for result.

Zeta Bank Nifty & Nifty50The Problems of Day Trading
Lot many indicators are made by thousands of traders all over the world, which give good or not so good signals.
Despite good signals, many times we end up in loss because we could not take entry or could not exit at appropriate time-point.
Sometimes even winning position also comes into loss if market takes back whatever you gained till a certain point.
Also, there are professional, office going people who can not take trades on their own during office-hours.
To solve all these problems, you need an automated strategy which could take trades, trail your stop loss up and exit when stop loss gets hit.
Strategy also lets you know how a certain formula performed over a period of time.
How this strategy works?
The strategy generates trades with 02 type of formulas:
1. It seeks price breaking away from support/resistance (up or down) which is calculated with the help of automatically detected pivot points.
2. It seeks reversal based upon RSI and Price Action.
If there are no open positions right now and a Buy/Sell signal comes, 1 lot is bought or sold.
This position is closed when either Stop Loss gets hit or when opposite signal comes.
What are other features of the strategy
1. You can set the session time when you want the strategy to take trades. For example, if you want to take trades only between 10:00 hrs and 14:00 hrs, that can be set in settings.
2. You can set up your own Stop Loss percentage, but the optimum value, as we found fit in backtesting, is set at 0.5%
3. There is a max. daily loss safeguard also which by default is set at 5%. It means if a series of losses happen during the day and your capital loss reaches this maximum loss value set by you, the strategy stops trading for that day.
4. There is an option to close all positions by End of Day. By default, this feature is disabled, but you can enable it if you don't want to carry forward your positions.
5. A label displayed at the last bar gives you cumulative profit or loss and daily profit/loss statistics.

Custom GAP UP scanner for NIFTY StocksThe security function can be called 40 times in a codescript. We can therefore scan about 40 stocks out of NIFTY 50 stocks with a single script.
This code can be modified to search for other scripts by changing the condition function
condition() => open > (close * 1.0025)
Only stocks which have gap up of 0.25% or more will be reported.

pSignal CFB and Slope Trend Folow This indicator shows the trend of an asset (nifty, crypto, forex, stock, etc., taking as a starting point the volatility and direction of the market.
When the moving average slope crosses up CFB (see CFB explanation below) it is BUY.
When the Moving Average Slope crosses CFB down it is sell.
The system also has a support and resistance (daily, weekly, or mouth) identifier.
The alarm of resistance or support signal: When price close and volume break daily support or resistance the general system is a visual signal.
Bull Wick= the high price broke the resistance.
Bear wick = the low price broke the support.
Break Out color blue color = the close price and the volume broke the resistance.
Break Out color maroon color = the close price and the volume broke the support.
The system also has the Bollinger bands that show us the volatility of the market and when it is up or down. Read more about the use of the Bollinger band
CFB
his indicator was designed to filter out lower price actions for a clearer view of trends. Inspired by QQE's volatility filter, this filter applies the process directly to price rather than a smoothed RSI . Range Filter and bands are now calculated in a singular function. There are now two different calculation methods for the filter. Select the type you want to use through the "Filter type" entry. Type 1 is the original formula. Multiple range size methods are now available.
You can choose between the following scales:
- Points
- Pips (Works best with currency pairs, obviously)
- Ticks -% of the price - ATR - Average change (default. This is the original sizing method). - Standard Deviation
- Absolute (absolute numerical value)
- Smoothing with the range elder is now optional, and you can specify its smoothing length.
Smoothing only affects dynamic scales (ATR, average change, and standard deviation).
- Filter movement can now be determined using highlights or closing price. This can be specified through the input.

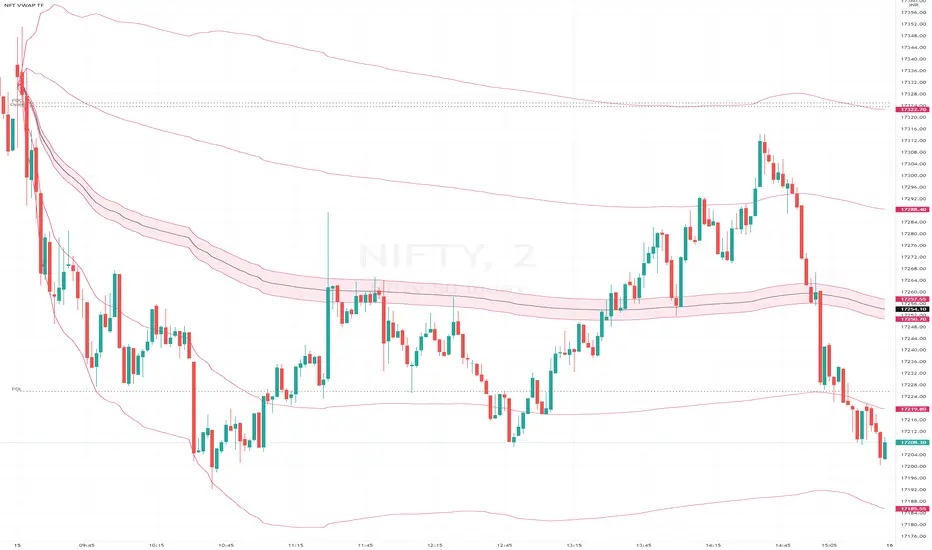
Nifty VWAP
NIFTY INDICES IS WIEGHTAGE OF 50 STOCKS AS DECIDED BY EXCHANGE.
NSE VWAP CALCULATES COMBINED VWAP OF THESE 50 STOCKS AND GENERATES VWAP FOR NIFTY
[astropark] DMI/ADX strategy [strategy]Dear Followers,
today I'm happy to share with you my DMI / ADX Strategy .
It provides directional trend information, so if a bullish or a bearish trend is going to start. Statistically it works better on lower timeframes (from 5 minutes to 1 hour).
It is both a Swing and Scalping Strategy indicator , based on a simple trend following theory , good for trading FOREX, Indexes, Stocks, Commodities and Cryptocurrencies.
To help in Taking Profits, the strategy integrates 2 special other than bull/bear signals:
Overbought and Oversold RSI Signals , which appear both as darker background (the darker the color, the more the price is in overbought/oversold) and green "ob"-"tp" / red "os"-"tp" labels (they optionally pop up only on a configurable stronger overbought/oversold condition) (you can enable/disable it optionally)
Peak Profit Tracker , which resets every time a new trade starts and keeps track of price fluctuation during the trade: the message is don't be too greedy and take profits or lock them with a stoploss in profit (you can enable/disable it optionally)
You can edit many options in order to
have more/less bull/bear signals
enable/disable showing bull/bear signals
enable/disable showing RSI TP signals (you can edit RSI length, overbought (OB) and oversold (OS) levels)
enable/disable showing peak profits on each trade
The user who wants to use this strategy, especially via an automated bot, must always set a stoploss (example 150$ from entry on bitcoin ) or use a proper risk management strategy .
This is not the "Holy Grail", so use it with caution. It's highly suggested to use a proper money management .
This script will let you backtest performance of the indicator based on bear/bull signals.
You can find the alarms version by searching for my DMI / ADX Strategy and choosing the "alarms" named.
Here there are some examples how this DMI / ADX strategy works on many markets:
LTC/USDT 15m
BTC/USD 15m
BNB/BTC 15m
ETH/USD 15m
GOLD (XAU/USD) 15m
GOLD (XAU/USD) 1h
FB 15m
AAPL 15m
TSLA 1h
BANKNIFTY Index 5m
NIFTY 50 Index 5m
This is a premium indicator , so send me a private message in order to get access to this script .

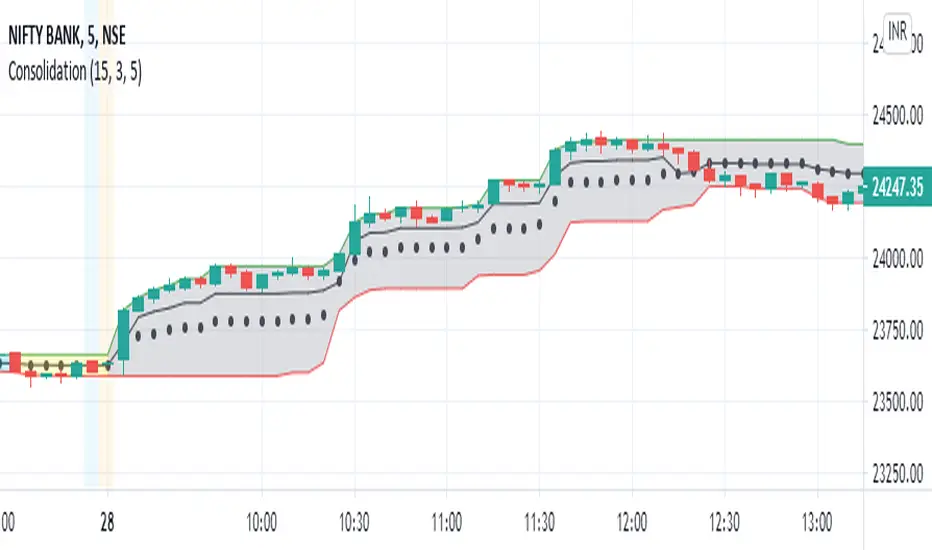
Consolidation and Breakout detectorExperimental : This script identifies the consolidation of a stock for selected time period. The consolidation period and range can be configured. 2 levels of consolidation levels can be selected. i.e Strong and medium. The range for strong and medium level of consolidation can also be configured by the user.
A movement in the direction of breakout of the consolidation level is observed most of the times. I have also added reversal line/stoploss line, so that the breakout movement is cancelled once that line is crossed by the candle close.
Currently consolidation levels are configured for 5 minute chart NSE:BANKNIFTY OANDA:NAS100USD . Can be reconfigured easily for any timeframe.
Nifty Volumes by OHO TradingProudly Presenting the Volumes Chart of Nifty 50 Spot of Indian Market
Studies Used
We have used Exponential Moving Averages in this Chart
BNF VWAP & MAThe script picks up Bank nifty stocks with their current respective weights and plots a Volume Weighted Average Price ( VWAP ) line along with 2 EMAs of your choice and an alert when the EMAs cross over and also when price crosses VWAP .
You can customize the script for MA type and lengths and to remove alert. Basic utility of the script is to analyse volumes driving the Bank Nifty index.
Credits to @daytraderph and his script (Custom Volume ) who's code I used to build this script. Also thanks to my friend @Varun who helped me code it.

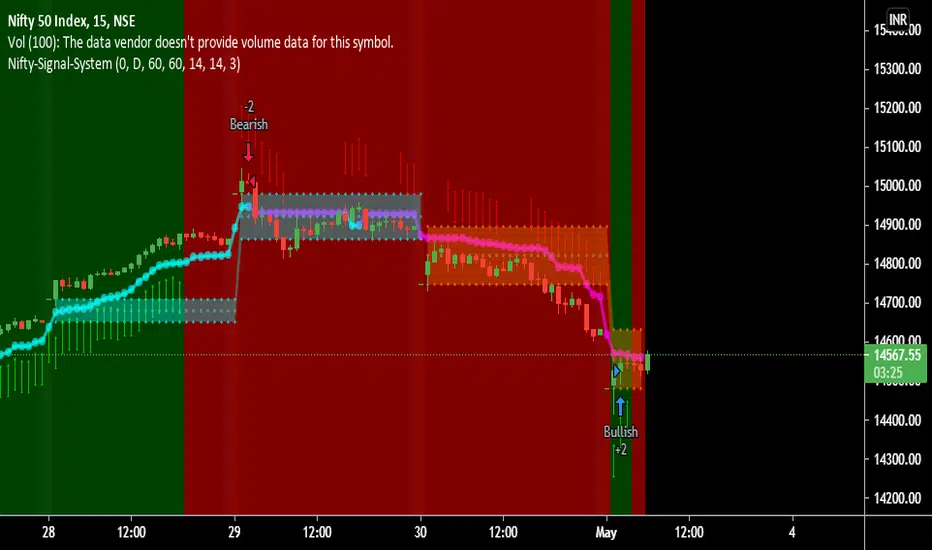
Nifty-Signal-SystemNifty-Signal-System is giving Bullish and Bearish signal for trade to buy and sell.
This signal system is mainly finding trend change and momentum change in the scripts.
There is two signal one Big triangle for Bullish and Bearish signal and another is arrow signal.
Arrow signals are generating for finding the continuation of trend.
Each arrow trader can do pyramiding with trend and close the trade whenever small red arrow come or bearish signal start and can take opposite side of the trade.
I have designed this signal system for NSE:NIFTY Index only.
Default Parameter are : Time Frame, ATR Period, ATR Multiplier, Look Back Period
Default parameter given on Input is giving optimum results if user want to change the setting results can vary.
With Strategy Tester i am able to give performance report. User can check the report .
I have mentioned order details with commission and slippages on each trades.
This signal is available on subscription. contact me or ping me for more details.
Nifty Volume profile + VWAP + EMA The script picks up nifty stocks with their current respective weights and plots a Volume Weighted Average Price line along with 2 EMAs and an alert when the EMAs cross over.
You can customize the script for EMA lengths and to remove alert. Basic utility of the script is to analyse volumes driving the Nifty 50 index.
Credits to @daytraderph and his script (Custom Volume) who's code I used to build this script. Also thanks to my friend @Varun who helped me code it.
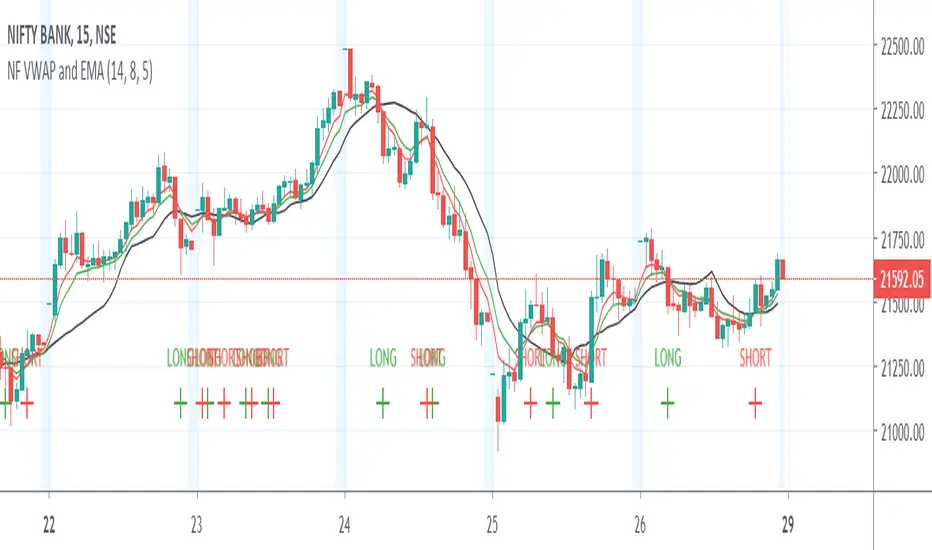
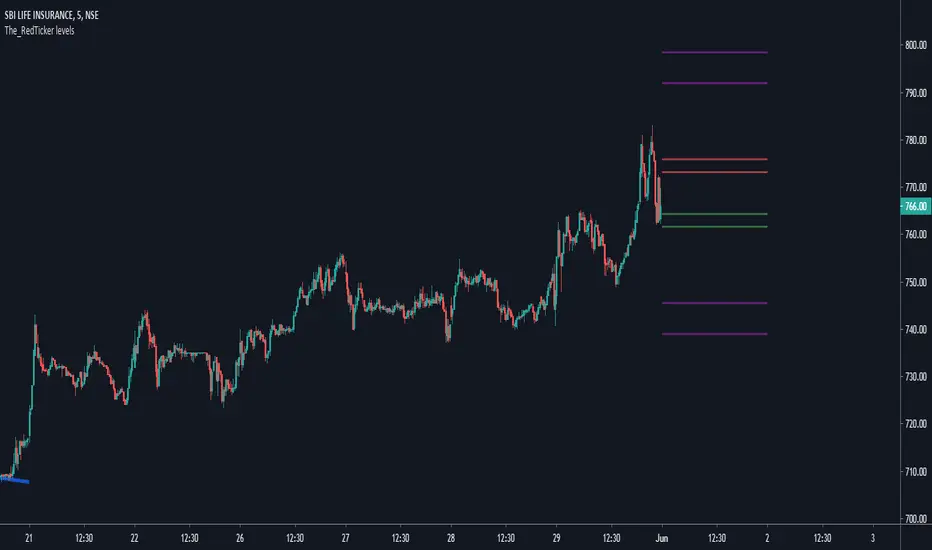
The_Redticker's Intraday IndicatorThis is a simplistic indicator capable of predicting Intraday Reversal regions for almost any chart on NSE/BSE (Indian Stock Exchanges)
Notes for Usage:
Best works when used on both indexes NIFTY and NIFTYBANK simultaneously in correlation. Its easy to understand that correlation, any one using it should spot it in a few days
Also, should only be used on 3 or 5 mins timeframe.
ENTRY:
The Inner regions marked by Red and Green lines are to be used for entries. Can look for both long and short reversal on either zones, can be teamed with other oscillators for better understanding.
Basically, when the CMP enters either Red or Green Zone, look for a long or short entry at the close outside the zone on 3 or 5 mins timeframe with the other side of the zone as stoploss trigger price.
While the Purple line on either side indicates the target zones.
P.s. If entering Short reversal at the Red Zone, then Green zone can also serve as first target and Purple zone as the final target depending on Market momentum. Vice-versa for entry at Long reversal at Green zone too.
Note: This indicator is most of the time absolutely correct, but needs to corrected every few months for VIX change. If and when that is done next will update it to show a NOTE on chart regarding that.
Look at any Index ideas on my profile to see live examples.
Intraday Strategy - NIFTY INTRADAY STRATEGY - NIFTY (Index)
INSTRUMENT TO TRADE - Nifty Futures, Nifty Options (Buy) - In The Money Call / Put Options
TIME FRAME - 05 mins
DURATION TYPE - Intraday , every trade must be closed at End Of Trading Day.
STRATEGY TYPE - Trend following, Intraday
The script will indicate when to BUY / SHORT the Index instruments and when to EXIT the trade.
The backtesting is done using 1 qty of NIFTY on intraday trade.
Brokerage and commissions are included in backtest results.
Tradingview doesn't have Nifty futures data hence strategy is build on Nifty spot price.
The purpose of the scipt is for self learning / improvement and analysis.
Trading is a risky business and a trader must take any trade at their own RISK.
The author shall not be held responsible for Losses / Profits

Custom VolumeIdea : Idea of script is getting the volume of index BNF and NIFTY50 ( as Tradingview don't provide the volume information of the indexes )
How it works : Script works on getting the weighted volume of underlying stocks and the plotting them by weight in volume
Benefits:
1. Can server as example how, once can plot the mixed volume of symbols
2. Will help the traders who consider volume also as decision making factor while trading BNF from tradingview chart
3. Can give volume information on any TF **in my knowledge only available for premium users
Important factor to note: Weight of stocks may change time to time depending on Exchange decision.

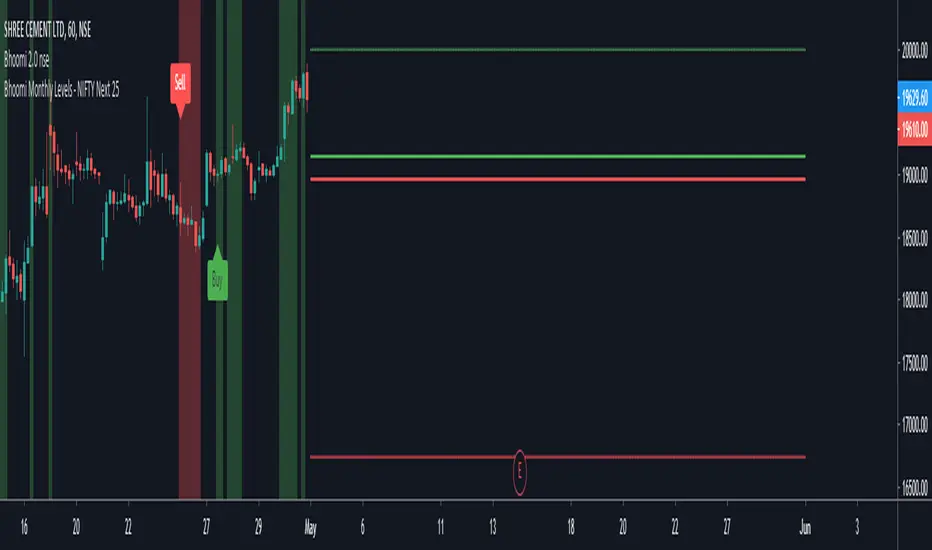
Bhoomi Monthly Levels - NIFTY Next 25This is a custom indicator which assists with monthly levels of Next25 stocks of NIFTY 50.