Moving Average MultitoolI made this script as a personal tool while backtesting multiple moving averages. It allows you to easily access and switch between different types of moving averages, without having to continuously add and remove different moving averages from your chart.
It also has the option to show the a 14 period average distance between the closing price of an asset and the selected moving average, as a multiple of ATR. This number can be shown by enabling the "Show ATR Between MA and Close" setting. The intention of this value is to quantify and compare the speed of different moving averages across any instrument and any timeframe. The higher the value, the slower the moving average. The lower the value, the faster the moving average.
Nnfx

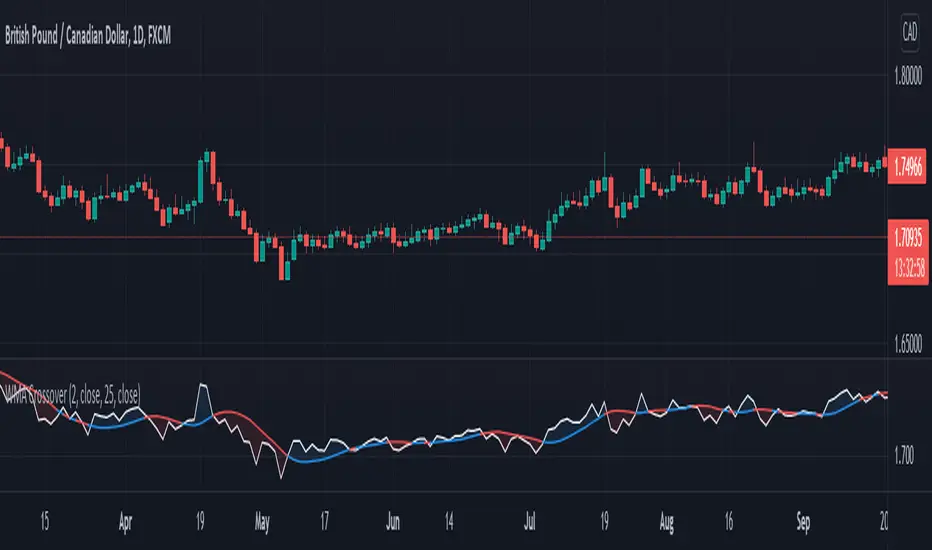
WMA Combo Crossover V2Before I begin I want to mention:
1. This is an upgrade of my indicator WMA Combo Crossover. (Link: www.tradingview.com)
2. The upgrade was inspired from the CCI and Bollinger Bands indicator by matsu_bitmex. (Link: www.tradingview.com)
3. I have combined the indictor with Bollinger Bands , coloring those sections as yellow, to increase winning trades as well as avoid losing trades by spotting potential reversals with the aid of news avoidance
4. This indicator is designed primarily for NNFX (No Nonsense Forex) though it can be used for any type of trading style
5. Also, I want to thank kurtisbu for helping me out. Thank you!
The indicator:
1. When WMA 25 is blue and is going upwards, it means there is an uptrend
2. When WMA 25 is red and is going down, it means there is a downtrend
3. During a trend, the color may switch to red and blue occasionally. When the color switches back to the direction of the trend, it can be used for re-entries
4. All trades based on the yellow color MUST be during a trend
5. When the color changes to yellow that means price is very volatile and only on the 1st candle is it advisable to enter a trade. (I have not backtested entering on the 2nd candle of a yellow color change)
6. During a trend, when the color changes to yellow and there is an incoming news event, then the chances of a reversal increase and I recommended avoid entering

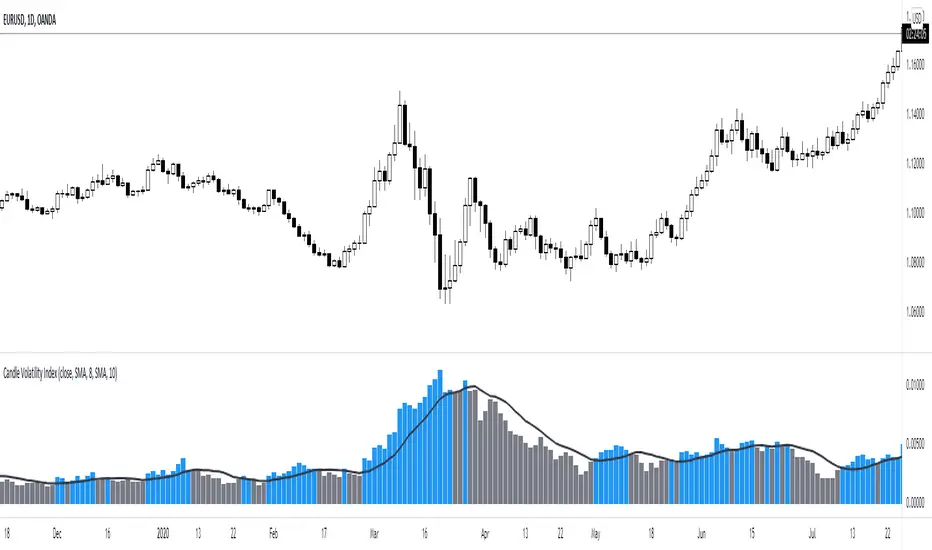
Candle Volatility Index [by NicoadW]This is the migration of the CandleVolatilitIndex from MT4.
The indicator works as following:
Step 1: The "Volatility Value" is calculated by applying a moving average to the change of the selected source (default: 10-Period-SMA applied to the change from last close to this close -> SMA(close-close , 10) )
Step 2: The signal line is calculated by applying a moving average onto the "Volatility Value" calculated in step 1.
The default settings are the same as in the original MT4 version.
Visualization:
The histogram shows the "Volatility Value" calculated in step 1.
Case 1:
The value is above the signal line (blue bar) -> Volatility is given
Case 2:
The value is below the signal line (grey bar) -> Volatility is not there
This is intended to be used as a Volume/Volatility Indicator for a NNFX-System but can be used in any strategy.
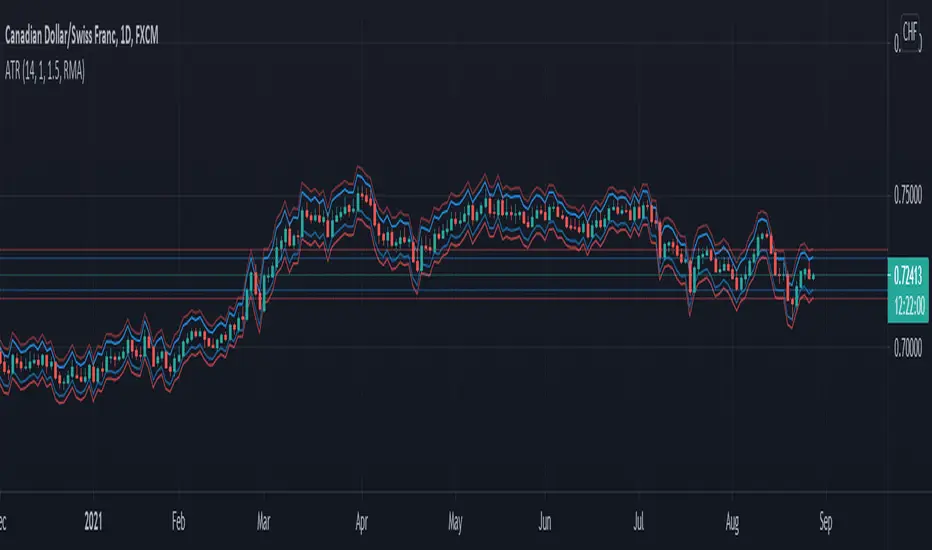
NNFX ATRBefore I begin I want to mention:
1. This is an indicator specially made for NNFX traders who use the ATR rule of ATR1x for Take Profit and ATR1.5x for Stop Loss
2. It is a product of combining the in-built ATR and Dillon Grech's ATR ()
The indicator:
1. It can be used for a quick look using the lines to see instead of calculating whether price hit a TP or SL. However I have kept the Main ATR for those who want to record the ATR into the spreadsheet when back testing or forward testing
2. When placing a buy/long order, TP is blue and appears above price, SL is red and appears below price
3. When placing a sell/short order, TP is blue and appears below price, SL is red and appears above price
4. The Main ATR, which is yellow, is way below price because I didn't want the chart to be overwhelmed by a 5th line in the middle of 2 TPs and SLs aka make the chart look claustrophobic
WMA Combo CrossoverBefore I begin I want to mention:
1. This is an inspiration from the Ultimate Oscillator by zinlytics. (Link: )
2. I wanted to make an indicator similar to the Ultimate Oscillator by making it more responsive to price
3. This indicator is a trend indicator which uses the Weighted Moving Average (WMA)
4. Also, I want to thank PhoenixBinary for helping me out
The indicator:
1. Made several changes such as switching over to a WMA instead of an EMA
2. When WMA 20 is blue and is going upwards, it means there is an uptrend
3. When WMA 20 is red and is going down, it means there is a downtrend
4. During a trend, the color may switch to red and blue occasionally. When the color switches back to the direction of the trend, it can be used for re-entries
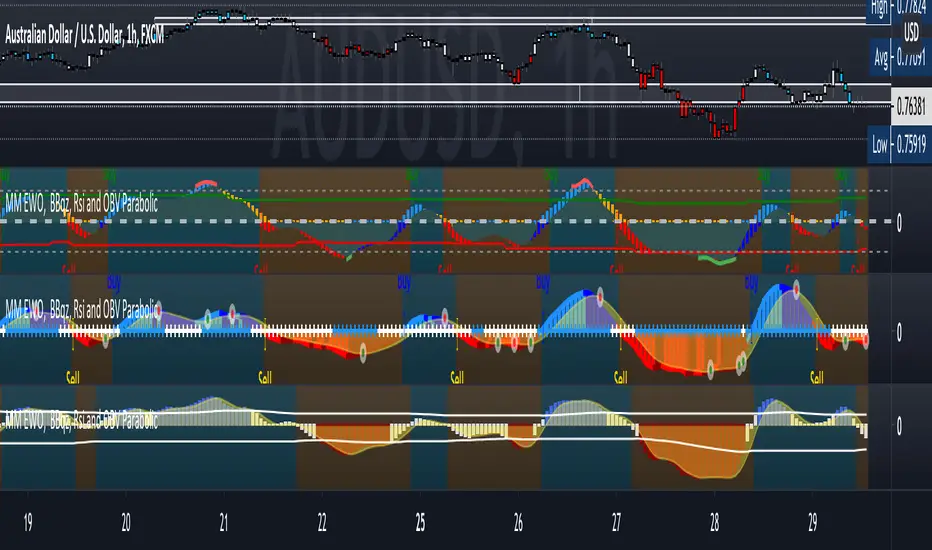
[FTA] Curvature of MeniscusIntroduction:
Curvature of Meniscus is a hybrid indicator comprised of three parts:
1. The first part is a heavily modified Demarker RSI which is represented as the histogram and is the main trend indicator C1 .
2. The second part is the 0 line which is replaced by the Waddah Attar Explosion V2 indicator C2 .
3. The third part is the background color which is borrowed from the Klinger Safety Zones volume indicator Vol .
It is smooth and has almost zero lag.
The signals can be used as per nnfx C1-C2-Vol algorithm.
The DeMarker indicator is relatively unknown to trading beginners but enjoys huge support from the more experienced traders. The indicator measures the strength of a trend and thus can give you a warning when a change in the trend direction might occur. This can not only help you to find new trade entries but also prevent you from entering into losing trades or letting your open trades run and ultimately result in a loss.
The line of the indicator is calculated as follows: First the indicator finds the minimal and the maximal value of the specified period. Afterwards those values are used to calculate the moving average of these values which then is displayed in the chart. Just like most oscillators the DeMarker indicator uses oversold and overbought zones at 0.3 and 0.7 to define good entry opportunities.
The "Curvature of Meniscus" indicator has the DeMarker indicator/RSI modified in three different ways:
1. Smoothed and almost no-lagged;
2. Colored histogram to determine the trend and the divergences;
3. An early signal line for those who like to take counter-trend trades/reversal entries.
Play with the settings and let me know what you think about this new hybrid!

MM ATR Risk CalculatorBased on the NNFX Lot size position calculations MoneyMovesInvestments would like to provide to you the Free MM Atr Risk calculator
Directions are simple
Tells you the Atr value
Stop loss in pips
You can enter your account size
Based on your account size, enter the percent you want to risk
then the calculator will tell you your stop loss in pips based on current market and your lot size based on the account size and percent you want to risk
Check us out for your other trading needs
Link below or PM us for access to our other indicators
Happy Trading

MM PullbackThis Strategy Indicator that detects price reaction zones and give out high probability trades when price pulls back from the zone
with two built in Oscillators the Momentum Oscillator and StochRsi
Art x1.5 SL and Two Tp Levels and Sl alarm to help backtesting
also Built in Channel indicators to help filter trades
Also alerts for all the signals
How to Use
Best time to buy is when you see the Buy badge at the bounce off the Green MA
vis Versa for Sells
for signals that are away from the MA that acts like your major level of S&R
you can use the Bands to help catch the current trend
This is an advanced Market Structure Algo First be able to identify market trend and structure before using this algo
For access please PM
Happy trading
Price Cross Range StrengthPurpose:
This script shows when price is in a range or trending. When the green line rises above the threshold the price is trending. When the green line falls below the threshold it's ranging. You may try adjusting the lookback way far back to find more areas of resistance.
Logic:
It shows how many instances the current price has been crossed in the past measured bars. The logic is that any price area that has been crossed many times is a strong area where ranging occurs.
Ideas:
1. Can be used as a dynamic length to other moving averages.

MM Session Open AlgoThe MM Session Open Algo is a strategy to catch the opening breakout of a security
displays the current session with background color
Entry, Stop Loss Based on Atr, and two Take Profit levels
Kill zone entries for New york and London session
provides valid signal for entry once price crosses entry line
and set "opening session price" to determine what signal you are looking for. based on time frame
shows the Daily,Weekly,Monthly high and low
average daily range
and comes with trend filter.
Directions are Simple
when price crosses and closes above entry line. you get in with the set inputs of Tp and Sl
or you can set buy/sell stops with the price provided for you and ride the wave of the direction it goes with he Tp and Sl provided
Link below or PM us for access to this indicator Happy Trading

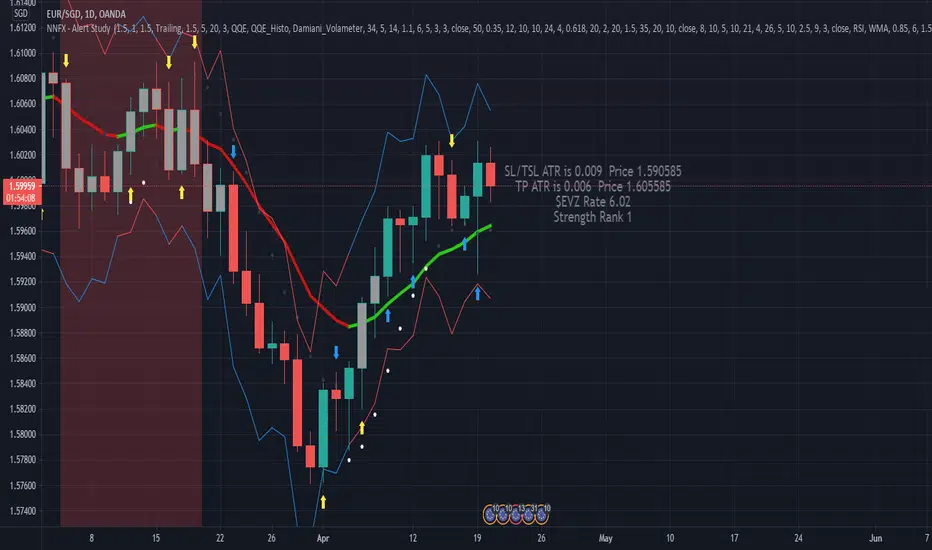
NNFX, Baseline, QQEs Fast C1, Slow C2, ATR, Volume and ExitDesigned Around the NNFX rules
Selectible Baseine
Selectible Exit Indicators
ATR bands, ATR labels for TP and TSL (1x and 1.5x ATR).
Indication (White Diamond) where candle is over 1x ATR in size.
Combined QQE Fast & Slow (C1 & C2) confirmations, Candles Grey before Trend Confirmed, change to Normal Colour when Trend established (QQE MOD used for calcualtions).
Continuations signaled by white dot above/below candle (0.9x ATR from Close Signal).
Exit Long and Exit Short signaled by Red and Blue Arrow under/above candle.
MM DonBased on the nnfx trading style this algorithms has many different calculations to provide the best signal and confirmations
1. The SuperSmooth Forecast Moving Average
2. TrendLine Moving Average
3. Smoothed Heiken Ashi Moving Average
4. Baseline that can change between 15 different moving averages
Buy/Sell Alarms for all the moving averages
Exit buy/sell Alarms
Entry
3 TP
ATR x1.5 Stop Loss auto generated per signal.
Also be able to set tp alarms for both buy/sell entries. so you place your trade and be alerted when your take profits have been hit.
works on all timeframes for scalpers, intraday, or even swing.
effective on binary as well.
Directions are simple
combine simple Market Structure & as long as everything matches (Buy Signal & everything is blue + baseline is white) (Sell Signal & everything is Red + Baseline is Red) you can enter the signal generated, exit the trade when told to exit and Manage your trade.
this was made to make trading easy and create confidence with in the trader.
Link below or PM us for access to this indicator Happy Trading

MM RemixThe MM Remix is comprised of the QQE indictor is calculated as follows: The Fast Trailing Level (TL) and Slow TL are found by calculating the ATR of the smoothed RSI over n-periods. The ATR is then further smoothed using the additional n-periods Wilders smoothing function. This smoothed ATR of RSI is then multiplied by the Fast and Slow ATR Multipliers to calculate the final Fast and Slow Trailing Levels.
A RSI crossover of the fast or slow ATR trailing lines. When the RSI crosses above the fast or slow ATR trailing lines it signals a buy setup. Conversely, when the RSI crosses below the fast or slow ATR trailing lines it signals a short setup.
RSI cross of the 50 level. When the RSI cross above the 50 level, it signals a buy setup. Conversely, when the RSI cross below the 50 level, it signals a short setup.
Fast / slow ATR trailing line crossover. When the fast ATR trailing line cross above the slow ATR trailing line, it signals a long setup. Conversely, when the fast ATR trailing line cross below the slow ATR trailing line, it signals a short setup.
Divergences between the price action and the QQE indicator. There are two types of divergence setups: Regular and hidden. Hidden divergences may signal trend continuation whereas regular divergences can indicate trend reversals.
Regular bullish divergence is when price action is setting new lows and the QQE indicator has higher lows. Regular bearish divergence is when price action is setting new highs and the QQE indicator has lower highs.
Hidden bullish divergence when price action is setting higher lows and the QQE indicator has lower lows. Hidden bullish divergence when price action is setting lower and the QQE indicator has higher highs.
Overbought / oversold. Overbought when the QQE indicator is above the 70 level. Oversold when the QQE is below the 30 level. If any of the QQE components have been moving below the 30 level and cross above, a signals a long setup. Conversely, if any of the QQE indicator components have been moving above the 70 level and then cross below, it signals a short setup.
Also The Aroon indicator is a technical indicator that is used to identify trend changes in the price of an asset, as well as the strength of that trend. In essence, the indicator measures the time between highs and the time between lows over a time period. The idea is that strong uptrends will regularly see new highs, and strong downtrends will regularly see new lows. The indicator signals when this is happening, and when it isn't.
The indicator consists of the "Aroon up" line, which measures the strength of the uptrend, and the "Aroon down" line, which measures the strength of the downtrend.
KEY TAKEAWAYS
The Arron indicator is composed of two lines. An up line which measures the number of periods since a High, and a down line which measures the number of periods since a Low.
The indicator is typically applied to 25 periods of data, so the indicator is showing how many periods it has been since a 25-period high or low.
When the Aroon Up is above the Aroon Down, it indicates bullish price behavior.
When the Aroon Down is above the Aroon Up, it signals bearish price behavior.
Crossovers of the two lines can signal trend changes. For example, when Aroon Up crosses above Aroon Down it may mean a new uptrend is starting.
The indicator moves between zero and 100. A reading above 50 means that a high/low (whichever line is above 50) was seen within the last 12 periods.
A reading below 50 means that the high/low was seen within the 13 periods.
Both have Buy/Sell alarms
Link below or PM us for access you this indicator Happy Trading

MM Legend V2The MM Legend V2 is a two in one oscillator.
The Rsi BB is the Rsi with BB volatility band with Demarker Ma for strong trend analysis.
up/dn signals tell you the trend direction
oversold/over bought levels
candle mode for the rsi band
blue/red back ground color to help identify the trend
How to Use
when the background is red, you have down signal, Demarker and rsi are at red level of BB band =sell
when the background is blue, you have up signal, Demarker and rsi are at blue level of BB band =buy
The second oscillator built in is the Tilson T3 and Demarker cross
The Denmark technical indicator, also known as DeM, measures the demand for an asset by comparing the most recent high and low prices to the previous high and low prices. This will give the general directional bias of the market.
the preferred Demarker setting is to use a parameter value of 18-24 periods. We also like to tweak the overbought and oversold levels and instead of using the classical 0.7 and respectively 0.3.
The classic De Maker comes with line graphs, to improve the price vision we have made this beautiful indicator in a candle version.
We have added a tilson T3 moving average to better target the inputs.
What is the Tilson T3
The Tillson moving average a.k.a. the Tillson T3 indicator is one of the smoothest moving averages and is both composite and adaptive. The average is built using the EMA however, the formula is decomposed in order to improve smoothing.
The demarker indicator indicates to us overbought and oversold of the asset, you will be able to distinguish these signals when the marker is painted green for overbought, red for oversold, you will also see a background with these colors to better identify these areas.
Demarker by default comes inline format, you just have to press demarker in candle mode idem for the moving average of t3 and you can see it as it is seen on the chart.
Recommendation for a better view in candle mode, once you press that you want to see demarker in candle mode, go to the style window and destilde wick and borders of each demarker and T3.
How to use?
BUY: When demarking an oversold signal, and the oscillator is above the moving average, buy, you will also see the aqua background.
Sell: when the demarker is overbought and the oscillator is placed or below the T3 moving average sell, you will also see the orange background.
Link below or PM us for access you this indicator Happy Trading

MM Ultimate Hull CrossThe MM Ultimate Hull Cross Is based on the nnfx trading strategy
with a combination of a ribbon hull moving average, Vma, and Alma baseline for trend direction
the hull ma with generate buy/sell signals
the vma detects volume and will confirm your buy/sell signal buy turning red or green and grey for "hold"
the Alma acts as your baseline and changes from green to red to show up or downtrend .
has built in generated signals with entry, Atr calculated stop loss, and 3tp levels that can be turned off in the settings. every time a signal is generated.
has purple alerts when tp's are hit
Buy/Sell alerts
alma trend change alerts with background color
link below or PM us for access you this indicator Happy Trading

MM Auto Trend ChannelThe Auto Trend Channel is a simple indicator that automatically plot a trend channel based on the length you set from Up to Downtrend. and changes automatically when the trend is broken.
changes from red"downtrend to green "uptrend" and also has auto fib lines.
I use it set at the 50 period and work from there
works on any time frame
and set alerts for broken channel
Use link below or PM us for access you this indicator Happy Trading

NNFX Mr. Monta FT %Kung hindi nyo ako naiintindihan hindi nyo rin maiintindihan ang indicator na ito kaya good luck
God Bless!
Happy Trading :)

MM Matrix OscillatorHere I present MM Matrix Oscillator
What the oscillator and histogram represent are trend candles, when the histogram is painted lime above 0 line it is buy, you will also see the buy signal below with an arrow, when the oscillator is painted red below the 0 line you will see the signal in red sell.
Dynamic Support and resistance to see possible exit points and extra confirmation on zones
You have an additional, exit buy and exit sell to perform scalping.
It has buy and sell signals alarm and also the painting of candles on the chart to see the trend. green=uptrend/red= downtrend
added "color trend and exit" in settings
red=downtrend
white=ranging
green=buy
Use link below or PM us for access you this indicator Happy Trading
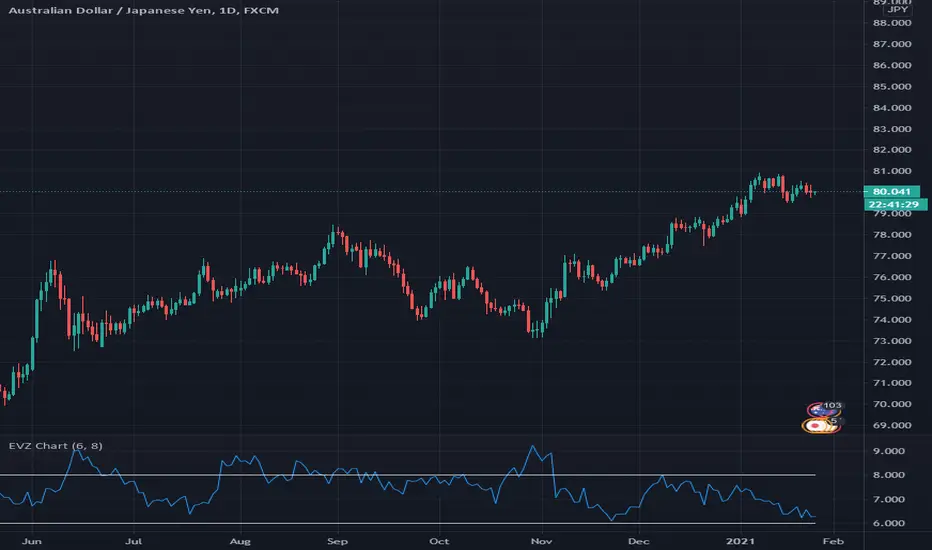
Indicator - EVZ Chart - DGHey Traders, this is the $EVZ chart plotted as an indicator. The $EVZ is the Euro Volatility Index, which can be used to measure volatility in markets.
The use of the $EVZ could be helpful for trend traders of FX. The concept developed by VP of no nonsense forex, we can use the value of the $EVZ to determine when we put on full risk if there is high volatility, half risk when there is medium volatility, or no risk if there is very low volatility.
This indicator has 2 adjustable horizontal lines, so you can put in the conditions or thresholds you need for your trading strategy.
Happy trading,
DG
MoneyMoves Strategy V1 The MoneyMoves Strategy V1 is one piece of the it is Hekin Ashi turned into a smooth Moving average for better visual of price trend.
By taking the average of the open, close, high and low of price this indicator will help with seeing short and long term price trend on any timeframe of your liking.
With added buy and sell alarms you can set so you don't miss a trade, also make for a good exit alarm if already in a trade.
In the settings you can change the type of moving average you want to use between sma, ema, wma, hma, vwma, and rma at different sources for your liking. (open/close/high/low)
You can also change the Length of the MA to better fit your liking both open and close prices to make it more precise
When you get A Buy Signal and the Moving Average IS Green= Buy
When you get A Sell Signal and the Moving Average IS Red =Sell
You can also change the colors of the Moving average in the settings tab
Use link below or PM us for access you this indicator. Happy Trading

Super SSLSuper SSL Indicator.
SSL + SuperTrend signal filtering.
Signals are delivered by SSL, signals are then filtered out by SuperTrend, in the nnfx way of trading (C1 = SSL, C2 = ST).
SSL deliver signals. Supertrend filter them.
Included 1CR rule option : in the nnfx way, we allow C2 to agree 1 candle later.
Some configuration settings of this tool pass the VP's 5 benchmark (can't be used to pass the private group admission though).

Label Display DemoA label function for display an arbitrary value above or below the chart.
There is no convenient way to display the value of a variable in pinescript. This is most convenient way I found.
It will follow the current bar (the position is calculated with highest/lowest and atr value, as such it will never display over the chart)
In this script we display ATR for the example

CCI - SWIFF KNIFECCI indicator swiff knife.
A lot of different usages of CCI ae possible with this script :
- 2 CCI lines crossovers.
- CCI - 0 Line crossovers
- CCI + Moving Average crossovers (many types of MA are available)
Filters can be added.
CCI can be used as a confirmation indicator, a continuation indicator, an exit indicator, a chopiness indicator .... It can even make coffee, who knows.
