Hades [HighRisk/BTCUSDT/2H/Binance only](v1.0)Hi everyone!
This is the " high-risk/Higher reward " version of my BINANCE:BTCUSDT accumulator: Hades .
This indicator has been developed for BINANCE:BTCUSDT /Binance/2H/Candles only.
Hades is looking for specific money/price patterns and compare the results with the "retails sentiment" then, the potential signals are filtered out with an advance/exclusive trend detector. ("Apóllôn" module)
- Very High Profits (~23700% in about 2.5y compounding and fees included)
- High accuracy (~80%)
- Med-Low Drawdown (~26%)
As usual with my scripts:
- No repaint.
- Two Weeks of trial. (Minimum 1 Full trade/nothing to lose!)
Don't hesitate to claim your trial to check on its performance.
More information in my signature.(again don't hesitate to send me a message if you have question)
Have a Good Day!
Norepaint

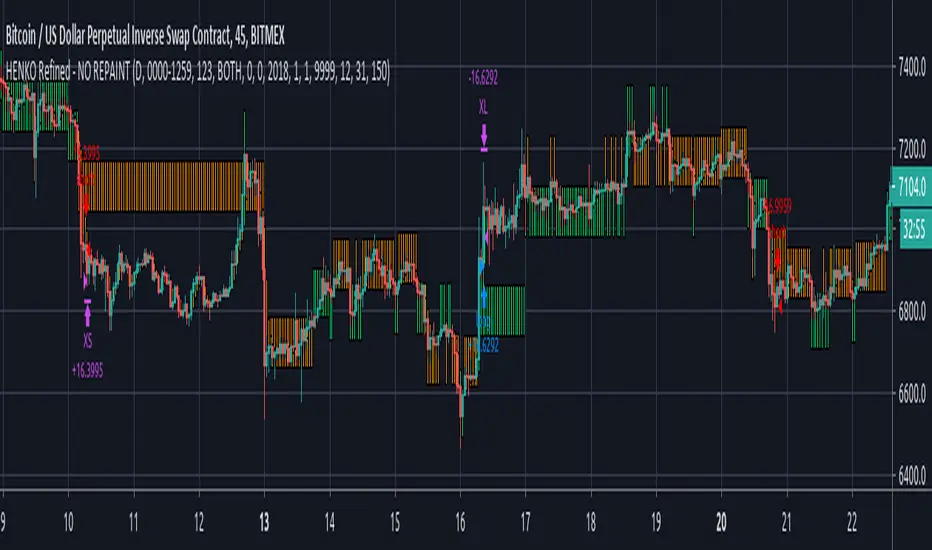
HENKO (Renko + HeikinAshi) -- No RepaintThis particular work is completely mine.
I have not used anyone else's code (not even a fragment).
Parts of the code are used from Open Source library linking to www.investopedia.com and TradingView's example section at www.tradingview.com
The above sources have been used to get Custom Heikin Ashi Candles.
Calculations on Renko bars is completely on me as I have used Daily close and open values to build my own Renko Candles.
Custom Bricksize for Float values has been made available in this public version.
I take no responsibility for the performance of this indicator as I have completely turned off the Repainting in this version of my script.
I am publishing the script for Public use.
I'll be releasing updates for this script in future as the performance is somewhat acceptable.
Profit Factor will decrease with bigger backtest data.
NO REPAINTING issues shall be reported at all costs as the tradingview's default Time based renko has been completely discarded, thus making it rely on its own.
Be advised that as the Renko Bars are calculated at 00:00 UTC, you're not supposed to mess with the timing in the script, unless you're working with Stock markets where it is important that you set your day start and end precisely.
You can play with the Brick Size to see what's more beneficial for you.
No Repaint RENKO
NOTE:= PERFORMANCE OF THIS INDICATOR DEPENDS UPON THE BRICKSIZE OF RENKO BARS.
☠ Hades 2H (v1.0) No Repaint ☠Hello everyone!
Today after almost 2 years I'm releasing one of my Script/Indicator;
My beloved Longterm USDT accumulator: Hadès
This indicator is made for "investors" more than "traders."
This indicator fires low number of trades.
This indicator is For BTCUSDT Binance 2H only.
This indicator Does NOT repaint.
To keep it simple it's trying to detect weird money flow patterns before price and retails react.
Tell me what you think
Have a Good Day!

Long Short Double strategyLong Short Double strategy
Long short strategy with stoploss and take profit.
I use this script for 5min btcusd on Bitmex. (The strategy also works on other exchanges, with some small adjustments in RSI)
Leverage 10x 375% profit in 2 weeks. NO REPAINT.
U can Adjust the RSI for long and shorts entry`s.
Study is Autoview ready. send me a PM for Paid access.
If you like this strategy buy me a Pizza, Dinner, or lambo:)
BITCOIN: 3BMEXTEMinsUUqUwr9GEjNA6ZBsVXB1g6u
LITECOIN: LdG82pyEMMji9Bynw3hvWgUshbMKfiFdJw

Simple 𝔇 Oscillators𝔻𝕚𝕧𝕖𝕣𝕘𝕚𝕟𝕘 𝕆𝕤𝕔𝕚𝕝𝕝𝕒𝕥𝕠𝕣𝕤
No Offset's, No delay
There is 6 Oscillators diverging in release version
For micro tf charting -requires manual tune on input menu

Stochastic + ATRStochastic oscillator with dynamic buy/sell levels. Levels calculate with volatility/averag true range. No repaint

Stochastic + ATRIt is a stochastic with dynamic buy sell levels. Levels are calculate from volatility/average true range. No repaints

Peak/Valley EstimationEarly Signal
Estimating the Peaks and Valleys or extrema of the price is one of the best way to catch up early movements of a trend. Of course there is no perfect way to do so, if we want a perfect estimation of peaks and valleys then we must use a non causal indicator ( repainting ), if we want a causal indicator ( non repainting ) then we will need to tradeoff accuracy for allowing our indicator to be causal, its always a matter of tradeoff at the end when trying to have a desired effect (smoothness/lag for filters) .Our indicator is causal, it wont repaint but the accuracy will depend on various parameters.
In order to detect peaks and valleys in a certain period we must detrend the price, this mean subtracting it by its moving average. We take the absolute value of this result and we filter it with a local linear regression ( LSMA ) in order to eliminate noise, then we make the assumption that the highest of our result is or a peak or a valley of the price, so we divide our detrended calculation by its highest and we get a scaled result. Lets call this final result the peak index .
Parameters
There are 3 parameters in this indicator, a length parameter who control the period of the highest mentioned above, a smooth parameter who smooth our detrended price, and finally a mod parameter who select the trigger method for estimating a peak/valley.
Here are how mods work :
mod = 1 : when the peak index is equal to 1 and the previous value is not equal to 1 then we have a peak/valley. Its the fastest of the 3 mods but the one with less accuracy.
mod = 2 : when the peak index crossunder 0.8 then we have a peak/valley. This method is more robust but slower than the previous one.
mod = 3 : when the peak index is not equal to 1 and the previous peak index is equal to 1 then we have a peak/valley. Its an average of the precedents mod in term of speed and accuracy.
Lower length values tend to estimate the peak/valley of short periods of time but can also lead to the reverse desired effect ( breakouts signals ). Smoothing is important since it reduce the number of noise in our calculation and therefore help to get better results, its a parameter that should be high, sometimes higher than length if this one is low.
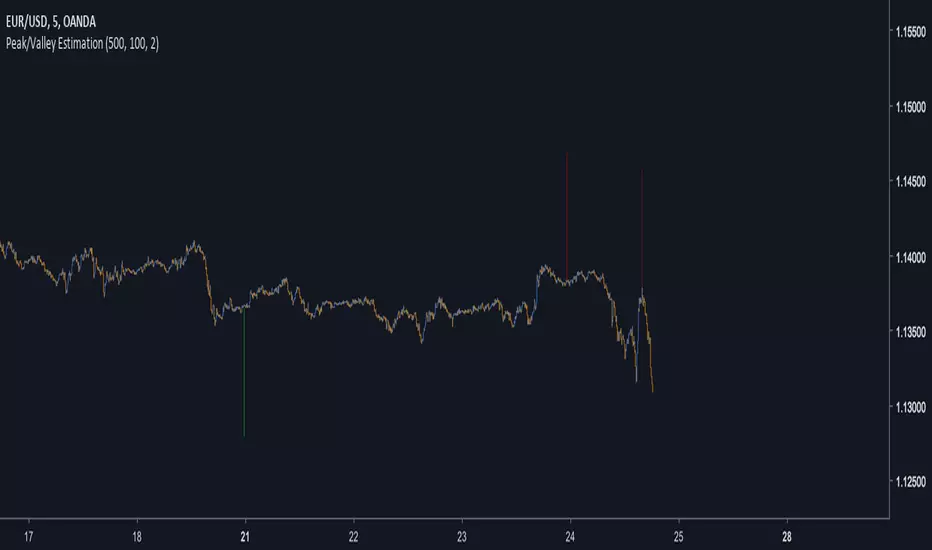
Estimation of medium terms peaks/valleys with length and smooth parameter both period 100 and mod = 3
Estimation peaks in palladium way to early, an example of bad accuracy. Such behaviour can be fixed with a change in the parameters.
Complementarity With Classics Indicators
As i said before its always a matter of tradeoff, here we get faster signals but we loose in accuracy, at the contrary classics indicators often have slower signals but with more accuracy. Mixing both of them can provide additional robustness in a strategy, lets take back our palladium case, using mod 3 could have been better, but its still not optimal, so lets use a classic indicator such as a moving average of period 200, our conditions are :
Long when our peak/valley estimator estimated a valley and the price crossover our moving average.
Short when our peak/valley estimator estimated a peak and the price crossunder our moving average.
here is an exemple of such signal :
We balanced our tradeoff in a way to fix both methods problems, of course its still not a perfect fix but it provide more robustness.
Other Uses
The indicator can also be used only as an order closing indicator, its safer than taking a position based on its estimation. The indicator can also give a use to the peak index used in the calculation as a trend strength indicator.
Values below 0.5 indicate a ranging market while values over 0.5 indicate a trending market.Since its a scaled measure you can use it a smoothing constant in a adaptive filter.
Conclusions
I showed how to estimate peaks and valleys and how to use such information in order to make better decision when using classical indicators, of course at the end nothing is perfect and considering the non stationarity of the markets the parameters efficiency could change drastically.
For any questions/demands feel free to pm me, i would be happy to help you
PGT: Pretty Good TraderLittle bit of background :
I am a broke college student on the East coast, and I have developed a hobby for creating trading algorithms. This is one of the better scripts that I have written. Unfortunately, as a broke college student, I don't have the disposable income to actually trade using real money. If you are interested in donating to my broke college student fund, please message me!
On to the script :
This script was written in pine version 3 and does not calculate_on_tick . This means that it does not repaint . The numbers you see are, to the best of my knowledge, accurate.
Because most scripts tend to overfit data to generate the "best looking data", I decided to create an algorithm that would be generalizable as possible to a diverse number of trading pairs. This script works on both crytpo markets(works best on smaller time frame) and stock markets(works best on larger time frames).
I am publishing this script to both gauge and generate interest in a Python trading bot which I have written which automatically buys and sells on different exchanges by using the predictive signals of this indicator.
