Standardized MACD Heikin-Ashi TransformedThe Standardized MACD Heikin-Ashi Transformed (St. MACD) is an advanced indicator designed to overcome the limitations of the traditional MACD. It offers a more robust and standardized measure of momentum, making it comparable across different timeframes and securities. By incorporating the Heikin-Ashi transformation, the St. MACD provides a smoother visualization of trends and potential reversals, enhancing its utility for traders seeking a clearer view of the underlying market direction.
Methodology:
The calculation of St. MACD begins with the traditional MACD, which computes the difference between two exponential moving averages (EMAs) of the price. To address the issue of non-comparability across assets, the St. MACD normalizes its values using the exponential average of the price's height. This normalization process ensures that the indicator's readings are not influenced by the absolute price levels, allowing for objective and quantitatively defined comparisons of momentum strength.
Furthermore, St. MACD utilizes the Heikin-Ashi transformation, which involves deriving candles from the price data. These Heikin-Ashi candles provide a smoother representation of trends and help filter out noise in the market. A predictive curve of Heikin-Ashi candles within the St. MACD turns blue or red, indicating the prevailing trend direction. This feature enables traders to easily identify trend shifts and make better informed trading decisions.
Advantages:
St. MACD offers several key advantages over the traditional MACD-
Standardization: By normalizing the indicator's values, St. MACD becomes comparable across different assets and timeframes. This makes it a valuable tool for traders analyzing various markets and seeking consistent momentum measurements.
Heikin-Ashi Transformation: The integration of the Heikin-Ashi transformation smoothes out the indicator's fluctuations and enhances trend visibility. Traders can more easily identify trends and potential reversal points, improving their market analysis.
Quantifiable Momentum: St. MACD's key levels represent the strength of momentum, providing traders with a quantifiable framework to gauge the intensity of market movements. This feature helps identify periods of increased or decreased momentum.
Utility:
The St. MACD indicator offers versatile utility for traders-
Trend Identification: Traders can use the color-coded predictive curve of Heikin-Ashi candles to swiftly determine the prevailing trend direction. This aids in identifying potential entry and exit points in the market.
Reversal Signals: Colored extremes within the St. MACD signal potential price reversals, alerting traders to potential turning points in the market. This assists in making timely decisions during market inflection points.
Overbought/Oversold Conditions: The histogram version of St. MACD can be used in conjunction with the bands to detect short-term overbought or oversold market conditions, allowing traders to adjust their strategies accordingly.
In conclusion, this tool addresses the limitations of the traditional MACD by providing a standardized and comparable momentum indicator. Its incorporation of the Heikin-Ashi transformation enhances trend visibility and assists traders in making more informed decisions. With its quantifiable momentum measurements and various utility features, the St. MACD is a valuable tool for traders seeking a clearer and more objective view of market trends and reversals.
Key Features:
Display Modes: MACD, Histogram or Hybrid
Reversion Triangles by adjustable thresholds
Bar Coloring Methods: MidLine, Candles, Signal Cross, Extremities, Reversions
Example Charts:
-Traditional limitations-
-Comparisons across time and securities-
-Showcase-
See Also:
-Other Heikin-Ashi Transforms-
Normalized-macd

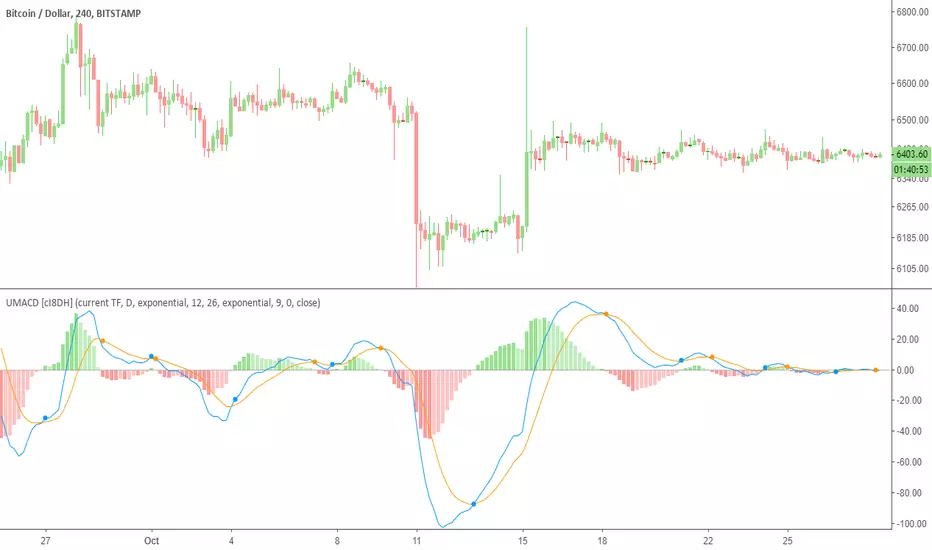
Ultimate MACD (UMACD) [cI8DH]Ultimate MACD ( UMACD ) includes True MACD fix, normalized MACD, multi time frame, bar coloring, and false cross avoidance options. It can also replicate Bill Williams Awesome Oscillator and Accelerator Oscillator. By default, this indicator is configured to work like the built-in MACD indicator. You need to customize it to your liking. Chart below shows example multi time frame setup.
True MACD and normalization
True MACD fix is similar to True RSI fix. The chart below proves that MACD is asymmetrical. This issue is most visible when analyzing charts across wide price ranges. It shows a logical problem in MACD, and most other indicators, as they can give you conflicting signals. For example, it can show long signal for both TRYUSD and its inverse pair USDTRY simultaneously. True MACD fixes this issue as shown in the chart below. Interestingly, this fix also normalizes MACD which is a major improvement upon regular MACD . (FYI, True MACD fix uses a different mechanism than my previous NMACD indicator.)
Avoiding false signals
This feature is very useful to avoid trading during sideways. To use this feature, set the std deviation multiplier option to a number greater than 1. I did some backtests on BTC chart with contract size set to 100% equity. It showed significant improvements for the time frames that I tested. (std deviation multiplier set to 1.5 @1h TF: 4x improvements, @2h: near 2x, 0.7 @4h: 2x, 0.4@12h: 3x, 0.4@daily: 1.5x). I also backtested True MACD fix separately and it showed significant improvement for most time frames.
Bar coloring
Bar coloring works similar to my previous indicators, Ultimate Money Flow and Ultimate RSI , and is subject to change in the future.
Bill Williams Awesome Oscillator and Accelerator Oscillator
Chart below both validates calculations in this indicator and also shows you how you can replicate Bill Williams AO indicators. You can apply all the features added to MACD to these indicators.
Here is a TL;DR list of my indicators to save you some time from looking at my obsolete indicators.
PS: I might publish the asymmetry fix as True MACD or as a general fix to all price-based indicators as an open source script in the future.
Normalized MACD (v420)did i remove the EMA and replace it with HullMA?
yes
:-)
also some other maths added
