Intraday BUY/SELLBUY & SELL Scalp Signals for Crude Oil Future Contracts (Or it can be used with any scrip with good amount of Volume) based on Sma & RSI overbought/oversold alert (!) for possible reversal indication.
Take Buy position only if candle breaks the high of alert candle & for Sell positions, take position if candle breaks low of the alert candle.
Best to perform with 3 min timeframe on Crude Oil Futures
Minyak

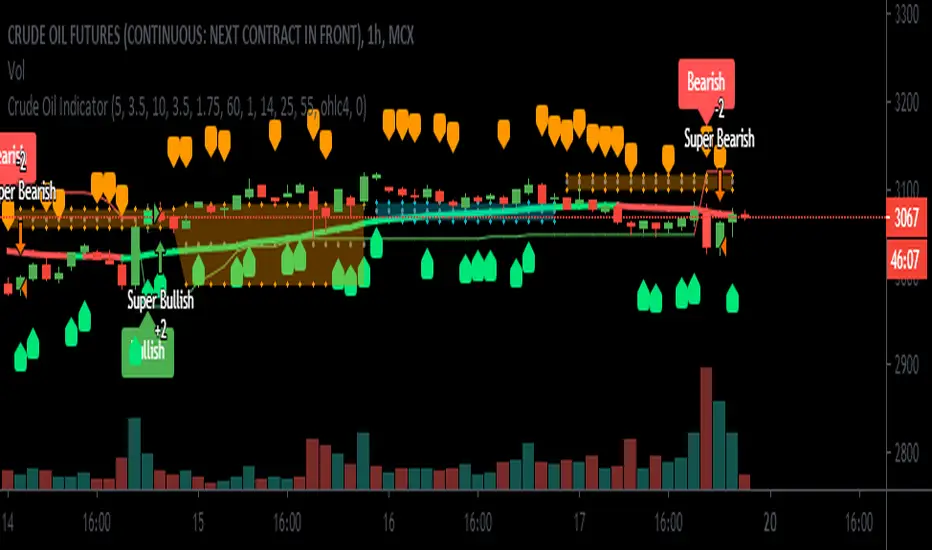
Crude Oil Indicator [SIDD]Crude Oil Indicator is giving two signal Bullish and Bearish . Bullish signal is used to take long trade and Bearish signal is used to close existing long trade and take new short trade and so on.
To get More signal of Bullish and Bearish user must enable More Signals check box that will check crossover and cross down of price close with Gaps.
I am using 2 ATR and one ADX and Gaps and VWMA to make signal profitable with 15 minutes 1 hr ,2hr,3hr,4hr chart time frame.
I have checked last few years data for back testing. Based on past performance it doesn't work well in 30 minute and 1 day chart time frame as results are not good in back testing. I have designed this indicator for Indian crude oil context though it can be used with other market as well.
1st ATR used to find trend with price crossover.
2nd ATR ADX is used to find the trend change details only. I have taken VWMA and ATR both to consider trend change.
Highlight Gap Up and Gap Down is used to know daily market opening gap up and gap down area. Gaps act as support and resistance .
VWMA Plotted as Blue line. Rising VWMA considered as uptrend and falling VWMA considered as downtrend.
Flat VWMA considered as no trend zone. In no trend zone every second third candles cross VWMA .
User must keep the default setting for getting better results as results are back tested. If setting changed then result may vary.
I have added here back tested performance user can see those results. I have added commission and slippage as well. Past year performance not guarantee for future years result so before taking any trade trader must take conscious decision.
This indicator is available on Subscription.
PM/ DM for more information about the script access.
Use the link below to obtain access to this indicator.
Open Close Profit - [Alerts]This script comes with the following indicators and features:
Moving Average trend filter (Hull, ZLEMA, McGinley)
Pin Bar Filter
MACD indicator
Pump and Dump filter
Entry, Take Profit, and Stop Loss Alerts
And a few more indicators in the back-end to increase accuracy, optimize entries and filter out sideways PA
This script works really well as a scalper on lower Time Frames as well as on higher Time Frames. Besides that you can also use it on pretty much any coin or asset.
This script is not repainting. We advise to use alerts on “Once Per Bar Close”.
If you’d like to automate this script you can do that by using AutoView, ProfitView, ProfitTrailer, CryptoHopper etc.
Leave a message if you’d like to try it out.

ZoneBand (@Mido_yuiya)Bollinger band is converted to EMA , and support and resistance bands are made into regions

USOIL to MCX Crude INR - by AnanthThis Indicator convert and display the MCX Crude oil price in INR by calculating the USOIL Multiplied by USDINR plus Slippage Buffer value. The buffer can be set by the user as Input Value.

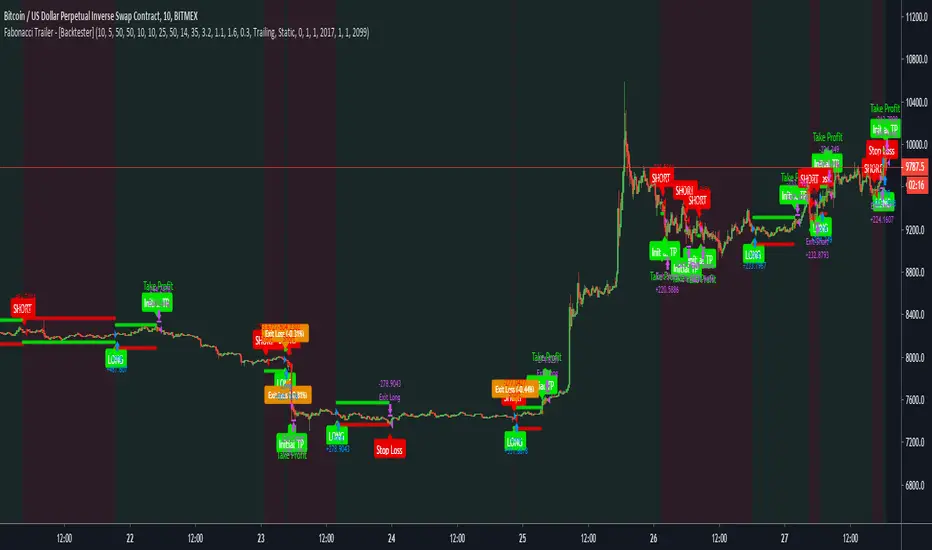
Fabonacci Trailer - [Backtester]This study comes with the following indicators and features:
ADX indicator
Chop indicator
Super Trend indicator
Trailing Take Profit and Stop Loss
Entry, Take Profit, and Stop Loss Alerts
Renko chart support
And a few more indicators in the back-end to increase accuracy and optimize entries
The study version with all alerts can be found in my profile. It is not repainting and we advise to use alerts on “Once Per Bar Close”.
Please note that this script is based on invite only.
Fabonacci Trailer - [Alerts]This script comes with the following indicators and features:
ADX indicator
Chop indicator
Super Trend indicator
Trailing Take Profit and Stop Loss
Entry, Take Profit, and Stop Loss Alerts
Renko chart support
And a few more indicators in the back-end to increase accuracy and optimize entries
This script works really well as a scalper on lower Time Frames as well as on higher Time Frames. Besides that you can also use it on pretty much any coin or asset.
This script is not repainting. We advise to use alerts on “Once Per Bar Close”.
If you’d like to automate this script you can do that by using AutoView, ProfitView, ProfitTrailer, CryptoHopper etc.
Please note that this script is based on invite only.

MA Crossover [Alerts]This is a Moving Average Crossover study .
The study comes with all alerts (Long, Short, Take Profit, and Stop Loss).
A few visuals like Exit Loss and Profit/Loss Boxes have been added as well.
The following Moving Averages are supported:
SMA
EMA
DEMA
TEMA
WMA
VWMA
SMMA
HullMA
LSMA
ALMA
SSMA
TMA
ZLEMA
If you’d like to automate this script you can do that by using AutoView, ProfitView, ProfitTrailer, CryptoHopper etc.
Feel free to leave a comment and share it with your friends. Enjoy!

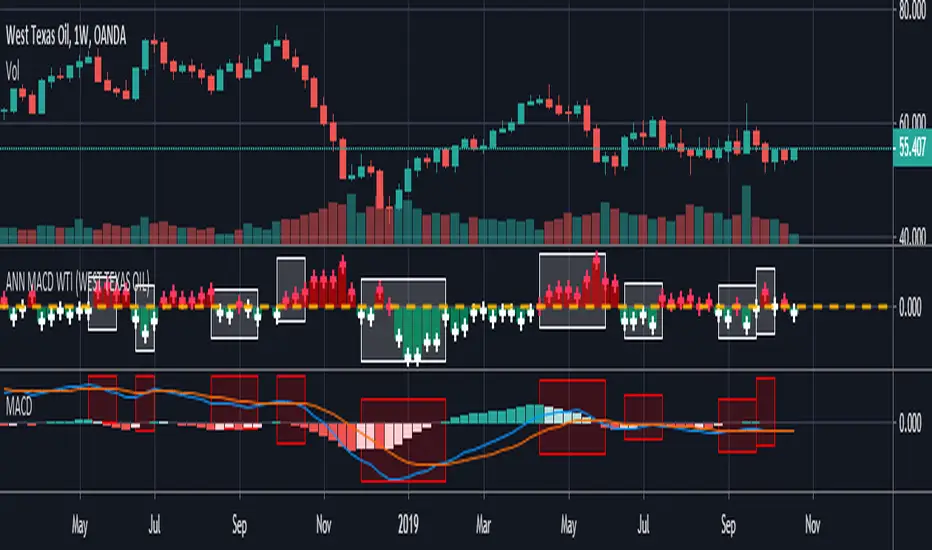
ANN MACD WTI (West Texas Intermediate) This script created by training WTI 4 hour data , 7 indicators and 12 Guppy Exponential Moving Averages.
Details :
Learning cycles: 1
AutoSave cycles: 100
Training error: 0.007593 ( Smaller than average target ! )
Input columns: 19
Output columns: 1
Excluded columns: 0
Training example rows: 300
Validating example rows: 0
Querying example rows: 0
Excluded example rows: 0
Duplicated example rows: 0
Input nodes connected: 19
Hidden layer 1 nodes: 2
Hidden layer 2 nodes: 6
Hidden layer 3 nodes: 0
Output nodes: 1
Learning rate: 0.7000
Momentum: 0.8000
Target error: 0.0100
Special thanks to wroclai for his great effort.
Deep learning series will continue. But I need to rest my eyes a little :)
Stay tuned ! Regards.
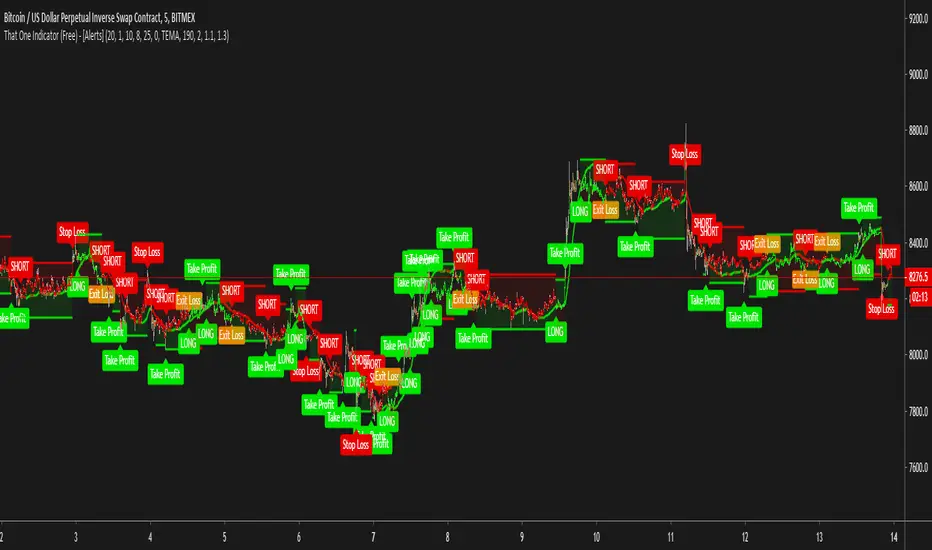
That One Indicator (Free) - [Backtester]This Backtester comes with the following indicators:
Bollinger Bands
ADX
Moving Average Trend Confirmation Filter ( EMA , SMA , DEMA , TEMA , WMA , VWMA , SMMA , HullMA, LSMA , ALMA , SSMA, TMA, ZLEMA )
And a few more indicators in the back-end to increase accuracy
This strategy works really well as a scalper on lower Time Frames as well as on higher Time Frames. Besides that you can also trade it on pretty much any coin or asset.
The alerts script is not repainting. We advise to use alerts on “Once Per Bar Close”.
If you’d like to automate this strategy you can do that by using our alerts script with AutoView, ProfitView, ProfitTrailer, CryptoHopper etc.
Alerts are set very clearly as Long and Short to avoid confusion.
Feel free to leave a comment and share it with your friends.

Oil Pit VWAPOil future traders commonly watch the pit session VWAP (9:00am to 2:30pm). The Oil Pit VWAP indicator overlays the VWAP from 9-2:30 (using hlc3) onto any futures asset, but its probably only useful for oil...

That One Indicator (Free) - [ALERTS]This script comes with the following indicators:
Bollinger Bands
Stochastic
Moving Average Trend Confirmation Filter (EMA, SMA)
Long/Short Alerts
Stop Loss Alerts
And a few more indicators in the back-end to increase accuracy
This script works really well as a scalper on lower Time Frames as well as on higher Time Frames. Besides that you can also trade it on pretty much any coin or asset.
This script is not repainting. We advise to use alerts on “Once Per Bar Close” .
If you’d like to automate this script you can do that by using AutoView, ProfitView, ProfitTrailer, CryptoHopper etc.
Alerts are set very clearly as Long and Short to avoid confusion.
A new script is being published soon with a lot more functionality, which includes noise filtering, all MA Types, RSI and other types of volatility measurements to filter out “less profitable” trades.
Feel free to leave a comment and share it with your friends.
Various Volume RSI (UNLIMITED)RSI displaying multiple currencies together (arbitrary input version)
forex or cryptcurrencies...economic index or metal or energy...and more...
複数の通貨をまとめて表示するRSIです。(任意入力版)
外国為替や暗号通貨...経済指数・金属・エネルギー...その他を表示できます。
同時に多通貨を監視することで見えてくるものがあります。
詳細、購入などはこちらにて
note.mu


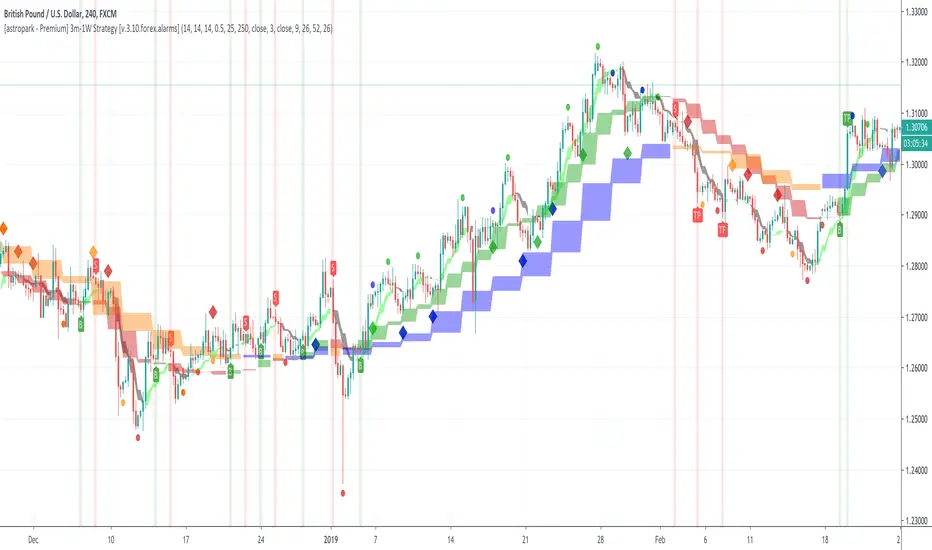
[astropark - Premium] Long-Short Strategy V3-FOREX [Alarms]This indicator is not holy grail , but it is an amazing trend finder and works nicely between 3m and 1W timeframes on FOREX :)))
With this indicator you can enjoy its trading signal and set the alarms you need!
In fact, if you want to set alerts on both buy, sell, take profit and stop-loss signals you must use this not-strategy indicator version!
This indicator is the non-strategy version of this one:
HOW TO USE THIS INDICATOR
Buy/Long when you see a green "B" label on the chart at best price you can, you have time till next candle's open price , trying to buy as low as possible near the green cloud or below it. Green cloud acts like a moving support for price, so use it for more buys/longs. The bigger the cloud, the stronger the bull-trend and so the support.
Sell/Short when you see a red "S" label on the chart at best price you can, you have time till next candle's open price , trying to sell as high as possible near the red cloud or over it. Red cloud acts like a moving resistance for price, so use it for more sells/shorts. The bigger the cloud, the stronger the bear-trend and so the resistance.
This indicator suggests some TP (Take Profit) for both longs (in green color) and shorts (in red color): you can start (at least partially!) closing the current trade (eventually you start new longs/shorts at cloud touch if you are a bold trader!).
Keep in mind that the lower the timeframe you work on, the easier is the trend to change rapidly, so always set a -2% / -5% stop-loss on trades and follow the trend with a nice trailing stop strategy.
Of course, as said at the beginning, this indicator suggests some TPs (Take Profits) for both longs (in green color) and shorts (in red color) operations: when you see a TP, you can start (at least partially!) taking profits over the current trade and move stop-loss higher (at least at break-even).
This is a premium indicator , so send me a private message in order to get access to this script.
Do you like my free scripts? Offer me a coffee, a beer, a pizza or whatever :)
BTC jar: 1K5kuYQPEqoNo6GRmJbHWMPmqwKM5S3oRR
ETH jar: 0x091b541a6dd6fe08c4e7bd909baafb2fce9b975e
LTC jar: LSVoAChsZrVsvbNyUfdpxtFpDAUSaUTUig
XRP jar: (XRP deposit tag) 103997763 (XRP deposit address) rEb8TK3gBgk5auZkwc6sHnwrGVJH8DuaLh
PS: Do you need a customization or do you need a dev who implements your strategy? send me a private message ;-)
[astropark - Premium] Long-Short V3-FOREX [Strategy]This indicator is not holy grail , but it is an amazing trend finder and works nicely between 3m and 1W timeframes on FOREX :)))
With this indicator you can enjoy its trading signal and backtest the strategy.
In order to check how much you could have been profitable with this script if you started trading from a specific timestamp, please use this nice website to get the integer number representing in seconds the date-time you want to start from: www.unixtimestamp.com
If you want to set alerts on both buy, sell, take profit and stop-loss signals you must use the following not-strategy indicator version:
HOW TO USE THIS INDICATOR
Buy/Long when you see a green "B" label on the chart at best price you can, you have time till next candle's open price , trying to buy as low as possible near the green cloud or below it. Green cloud acts like a moving support for price, so use it for more buys/longs. The bigger the cloud, the stronger the bull-trend and so the support.
Sell/Short when you see a red "S" label on the chart at best price you can, you have time till next candle's open price , trying to sell as high as possible near the red cloud or over it. Red cloud acts like a moving resistance for price, so use it for more sells/shorts. The bigger the cloud, the stronger the bear-trend and so the resistance.
This indicator suggests some TP (Take Profit) for both longs (in green color) and shorts (in red color): you can start (at least partially!) closing the current trade (eventually you start new longs/shorts at cloud touch if you are a bold trader!).
Keep in mind that the lower the timeframe you work on, the easier is the trend to change rapidly, so always set a -2% / -5% stop-loss on trades and follow the trend with a nice trailing stop strategy.
Of course, as said at the beginning, this indicator suggests some TPs (Take Profits) for both longs (in green color) and shorts (in red color) operations: when you see a TP, you can start (at least partially!) taking profits over the current trade and move stop-loss higher (at least at break-even).
This is a premium indicator , so send me a private message in order to get access to this script.
Do you like my free scripts? Offer me a coffee, a beer, a pizza or whatever :)
BTC jar: 1K5kuYQPEqoNo6GRmJbHWMPmqwKM5S3oRR
ETH jar: 0x091b541a6dd6fe08c4e7bd909baafb2fce9b975e
LTC jar: LSVoAChsZrVsvbNyUfdpxtFpDAUSaUTUig
XRP jar: (XRP deposit tag) 103997763 (XRP deposit address) rEb8TK3gBgk5auZkwc6sHnwrGVJH8DuaLh
PS: Do you need a customization or do you need a dev who implements your strategy? send me a private message ;-)

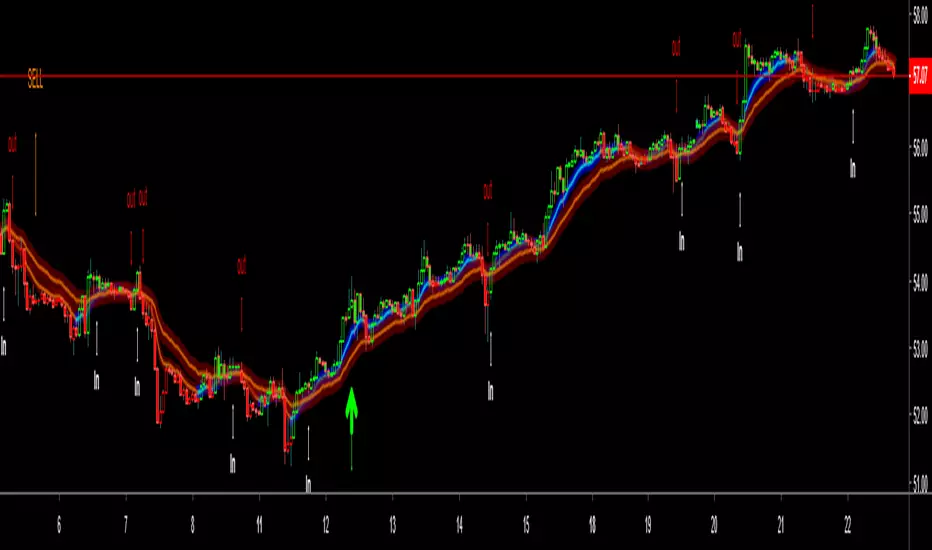
PpSignal PerPro V6 Indicator Version with alarmThis is the of PerPro V6 indicator version with alarm. Remember in trend changes the indicator may repaint the signal. Please use other indicators to accompany the entries.
in small periods, such as 1, 3 and 5 minutes and pairs or high volatility stock we have seen a repaint until confirms the trend.
if you want to use it in 1, 3 or 5 minutes condigurelo in tf 1h or 240 up. in 1h charts we recommend 480, 720 or D in forex, in stock 1h tf W, in 1D graph set in W or M. It may be at the beginning of a new signal repaint.
I'll leave it free for 3 months then I'll change the code and make it private.

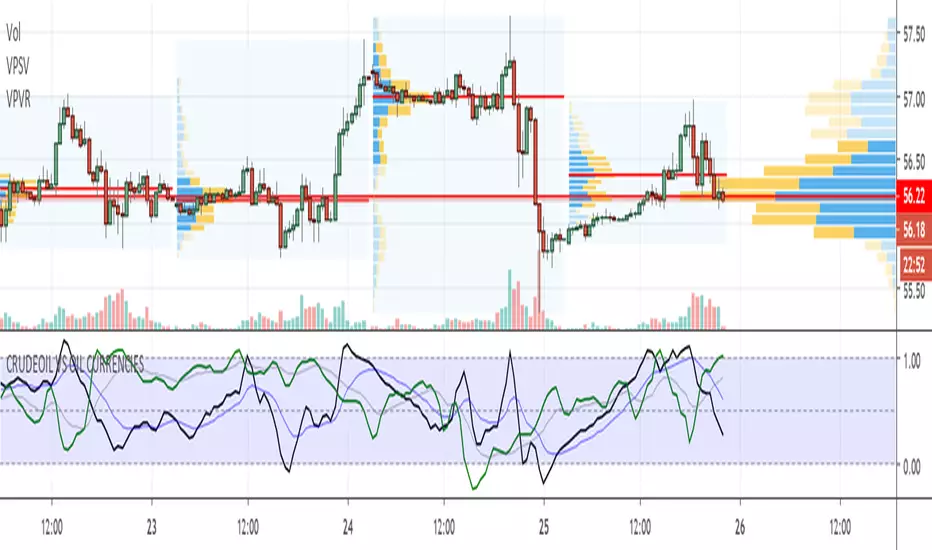
CRUDEOIL VS OIL CURRENCIESThis Script helps the traders to understand the saturation and reversal points for CRUDE based on the CRUDE DEPENDENT Currencies (CANADIAN LOONI, MEXICO, NORWAY and RUSSIA)
All the sweet crude participants including WTI.
It's a must needed indicator for Crude oil trading
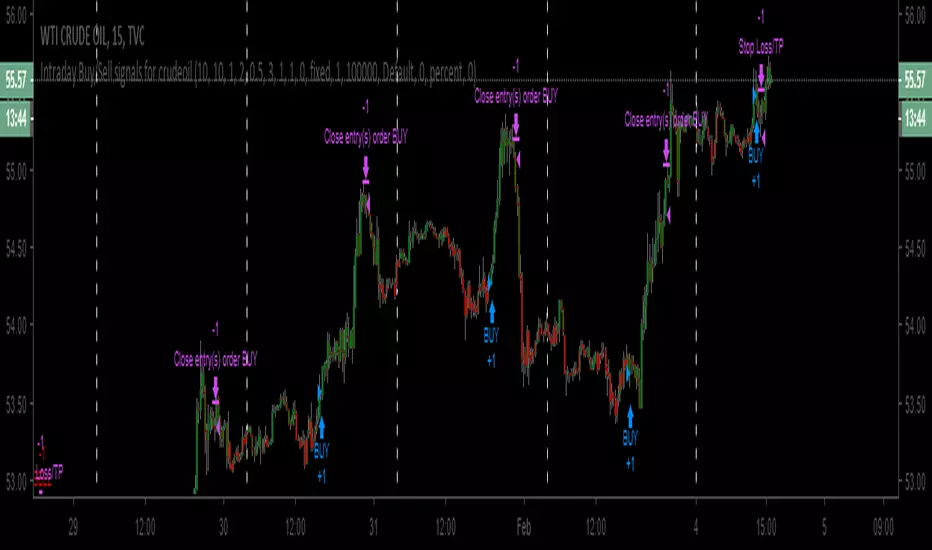
Intraday Buy/Sell signals for CrudeoilHi Everyone,
This is higly tuned intraday Buy/Signal generator for Crudeoil. It works on any time frames below 30 mins. But, the best setting is 15 mins.
How to use:
1. Just, apply this strategy to your crudeoil WTI instrument
2. Set your time frame to 15 mins
3. Buy the instrument whenever buy signal generates / Sell the intrument whenever buy singal generates
4. Strategy itself has 0.5% stop loss generating signals. But, create stop loss of 0.5% after buying/selling the instrument
5. Finally, whenever close signals triggers, just close the trade.
Note: Please try with only one lot at the beginning. If everything goes well after testing, mulitple lot can be used.
Disclaimer:
This strategy is for testing purpose only. Any profit/loss to the user's capitla is subject to market risk. And, the creator of this script is no where responsible.
Powerfull strategy MACD+RSI+STOCH ATR stop best on Crude OilMy strategy uses a combination of three indicators MACD Stochastic RSI .
The Idea is to buy when ( MACD > Signal and RSI > 50 and Stochastic > 50) occures at the same time the BUY STop we place on previous day HIGH
and sell (short) when the opposite condition occurs we place SELL STOP on previous day LOW
We exit on Take profit or Stop loss which is calculated by ATR (10) or on the opposite signal "Volatility breakout"
This strategy works well on stocks, commodities and cryptos especially during market breaking up after consolidation
The best results are on Daily charts , so its NOT a scalping strategy. But it can work also on 1H charts.
The strategy does not have any stops and profit targets, so we can take all the market can give us at the moment.
The exit point only when MACD goes under Signal
Its Preformance is significantly better with "buy stop on High.1 and sell stop on Low.1" idea and exit on "volatility price breakout"
So, use it, trade it.
If it will help you to imprive your trading results, please donate me
BTC: 12kd1F8buWisUBdq27BBwRkUvzW7Ey3og
