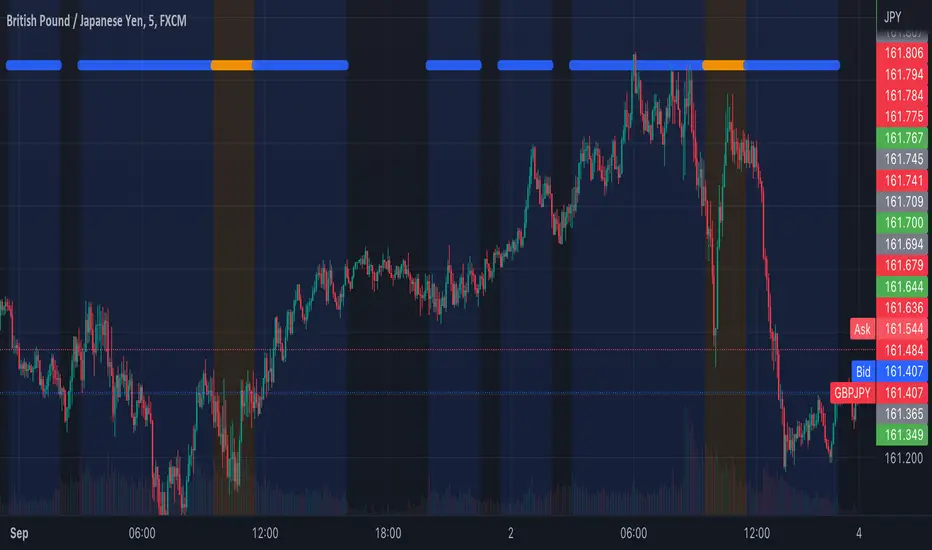
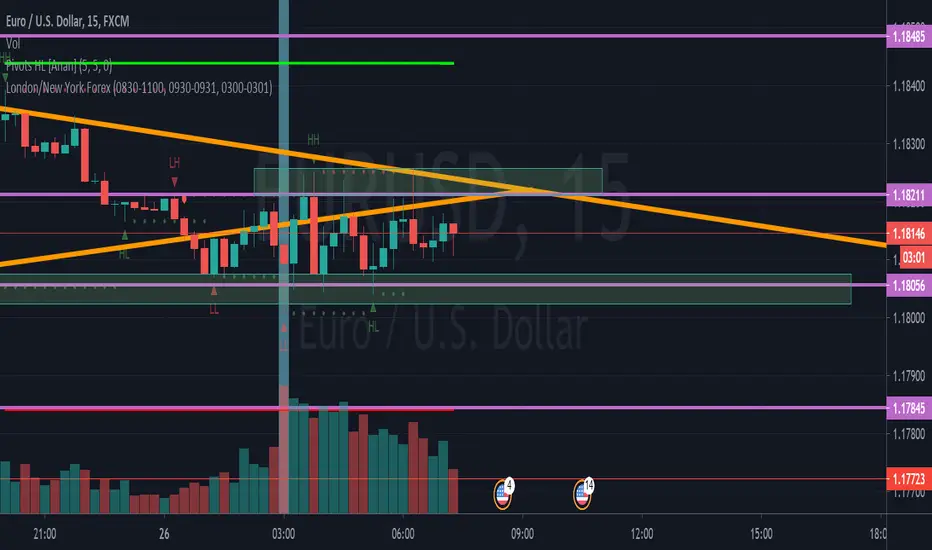
TCI (TimeZonesIndicator)Problem & Trading Relevance
When people and especially investors and traders wake up, they will very likely check the crypto markets if they are invested. Thus higher volatility can be expected during this time. Also during the opening hours of the stock exchanges higher volatility can be expected.
For people who are checking their crypto portfolio on a daily base and be following the charts, this indicator highlights maybe the most important times of the day.
Implementation
Wake up times are considered as 0700-0900. Stock Exchange hours are considered to be 0900-1000. The daylight saving times are automaticly considered.
Personal comment
Thanks to the community for supporting with so many free to use indicators :D I hope some of you will find it also really helpfull and thus very easy to use and understand.
Greets Julian
Opening

Michigandolf's 30min Opening Range (w/Extensions)See previous version for explanation of the 30min Opening Range:
This new version is for users that prefer to see the Opening Range Extensions.
The extensions are based on the distance from the Opening Range High to the Mid Point (or Low to the Mid Point).

Tosch Market Sessions (US/GB/JP)Library "Tosch Market Sessions"
Returns if the NYSE, London SE, Tokyo SE are open
@function Returns if the NYSE (US), London SE (GB), Tokyo SE (JP) are open
@returns
bus, bgb, bjp - bool: true if the corresponding exchange is open
count - int: count of how many exchanges are open at the moment
ccolor - color: color that indicates the number of open exchanges
0 => color.black
1 => color.blue
2 => color.orange
3 => color.white
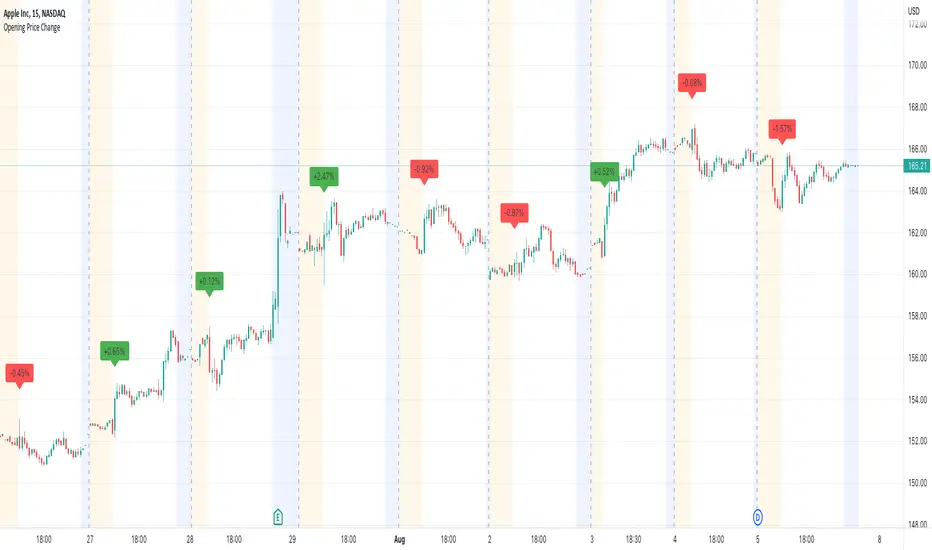
Opening Price ChangeThis script shows the change from the market opening price to the market closing price of the previous day in percent.
With this you can quickly get an overview of historical data for the change of the respective day.
Important: the market closing price is always used for the calculation and not the pre/post market price.
The label with the change value is always placed above the first opens regular market bar. If the change is positive, the label is draw with a green background, is the change is negative you will have a red background.
Session Levels - Ultimate Range IndicatorSession Levels - Ultimate Range Indicator
Primarily developed for trading the E-MINI Futures Markets like NQ or ES from the CME Group,
but also more than suitable for Crypto or other instruments.
This indicator highlights the chosen session, which can be Globex, Asian, London and New York.
It plots the important levels and also renders the Opening Range as it forms (a.k.a. Initial Balance).
After the 1st hour Opening Range is finished, it can plot the Standard Deviations / Projections.
See below for a complete feature list.
All Opening Ranges on chart and for the New York session the Range Projections are turned on:
s3.tradingview.com
How to use (example):
If you are trading the Nasdaq Futures (NQ!)
Enable the Globex Overnight session. Basically in the Futures Market, the Globex session is everything outside of US trading hours of Stocks. This draws the important overnight levels, like the Low, 25%, 50%, 75% and the High.
Enable the New York Session with Levels and Opening Range. Generally, 70% of the time the 1st hour will put a Low or High of the day.
If the price is trading above the Globex Low, most likely the Low of the Day is formed and the price target for the day will be 1.5x Standard Deviation and 2x Standard Deviation.
[*} Deviation of the Initial Balance depends on the volume ad overall market structure.
** This is not financial advice or any guarantee **
Features:
Show each Session Highlighted on Intraday chart in it's own color (each session can be turned off and has customizable times and color)
Show Line Levels of each session: Low, 25%, 50%, 75% and the High (customizable color)
Show the Opening Range (Initial Balance) of the Asian, London and New York session. Note: NY has more options.
Opening Range is displayed as a box with level lines (customizable color)
Levels are drawn to the end of the NY Cash session (customizable time)
Show IB Standard Deviations 0.5 - 3.0. Calculated from the Opening Range (Initial Balance)
Option to display Higher Timeframe levels: Previous Day Open/Close and Previous Week Open/Close
All level lines and OR boxes size dynamically as the session progresses
Built in Alerts for when price hits key levels. e.g. Alert when price crosses the NY Opening Range High. Or an Alert when the first STDEV is hit.
Option to toggle display of drawings for Today's trading session only, or Show all recent session levels. This keeps the chart clean or not.
Extras:
The NY Opening Range also has a 50% level line
The NY Opening Bar can be highlighted separately
The Level Lines can have small labels turned on/off. Values are only shown on mouse over to keep a clean chart
Keep in mind:
1) This indicator works on all instruments, but on instruments with limited market hours, your chart setting
has to be set to "Extended Hours" otherwise. For example TSLA on NASDAQ.
2) The Exchange Time Zone for the CME Group is Chicago UTC-6. So the session times you configure in the settings menu are based on that timezone too.
3) Globex opens at 5pm CST and closes when the US session starts 8:30CST.
4) When enabling the Alerts in the Indicator settings, be sure to also create an alarm for this indicator using the Alarm function of Tradingview.

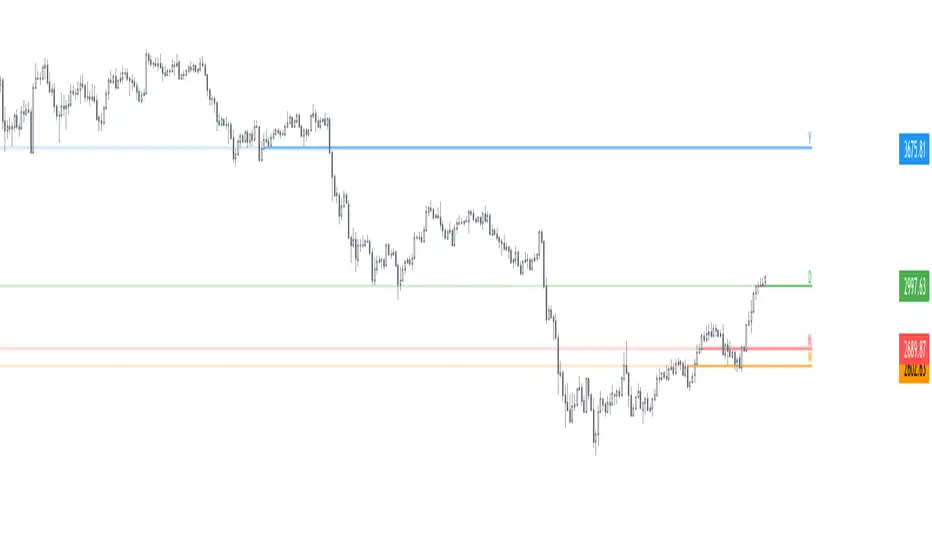
PA Trading v1PA Trading v1 will basically help you find the weekly and monthly strong support resistance points by automatically drawing lines for Daily opening, monday high and low, Weekly opening, Monthly opening, Last week's opening and last month's opening points on the chart.

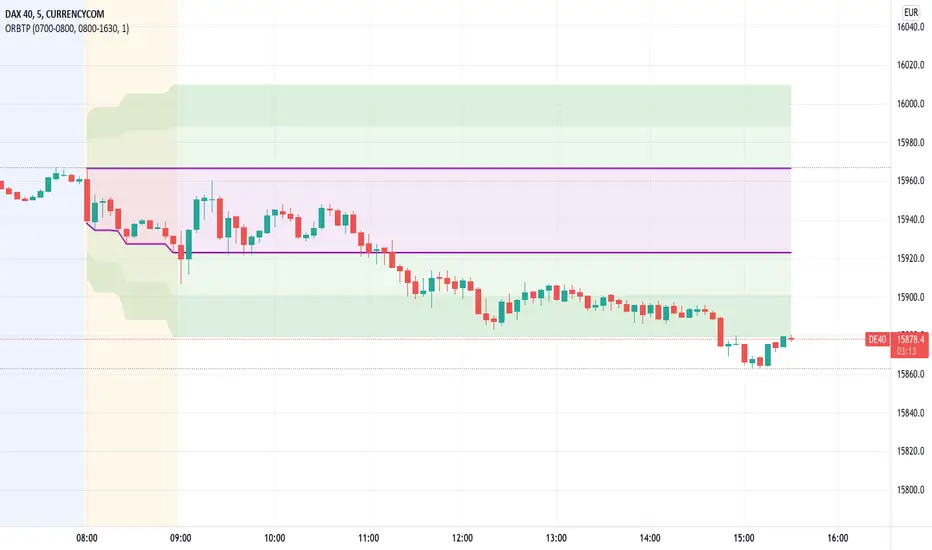
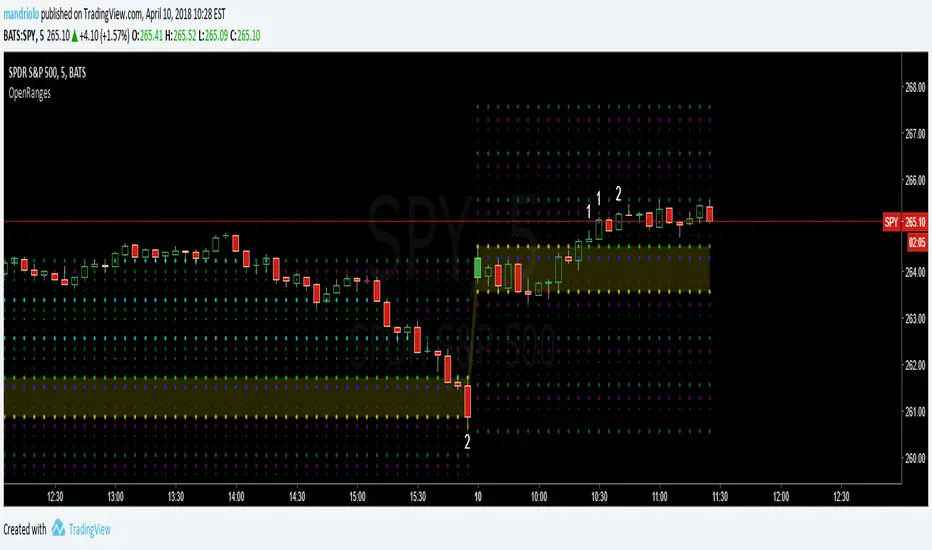
Open Range Breakout With Take Profit Zones
Open Range Breakout With Take Profit Zones prints the open range and profitable zones based on the high and low during the opening hours.
This indicator can be used to prepare breakout trades following the OPR strategy. The time window for the open range as well as for the market hours can be configured. Also custom alerting templates allow to create alerts when a breakout out of the opening range occurs or when 50% take profit level is reached.
The background of pre and post market hours is coloured according to the configured time windows.
This indicator was written to support scalping and day trading. It does not calculate or display results on hourly, daily or weekly charts.
The open range and trading hours must be adjusted to the market time zone of your instrument. Also please take care that these settings are saved on the layout and not per instrument. Eventually create multiple layouts for instruments with different market time zones.
Fibonaci Opening Range Candle
Fibonacci Opening Range it is 50% and 0.61% of 5 min or 30min or 1 hour opening candle
search buying opportunities below 0.61
and selling opportunities above 0.50
Also acts as good support and resistance in intraday
BEST RESULTS IN INDEXES
Thanks & Best Regards
Marella Ganesh

Michigandolf's 30min Opening RangeThis script plots the 30min Opening Range as well as the previous day's high & low.
Description:
Blue Line = Top of the 30min Opening Range for the session
Pink Line = Bottom of the 30min Opening Range for the session
White Line = Mid-Point of the 30min Opening Range for the session
White Transparent Area = The full range of the 30min Opening Range
Green Line = Yesterday's High for the session
Red Line = Yesterday's Low for the session
Use:
The Opening Range will continue to expand until the first 30minutes of trading has passed, at which point the range will lock in place for the remainder of the trading session. Many traders use these important levels to gauge trade entries and exits (e.g. Mark Fisher's ACD strategy).
This script does not work currently work for futures (e.g. ES, NQ, RTY) due to the session start time. Will configure for futures trading in a future update.

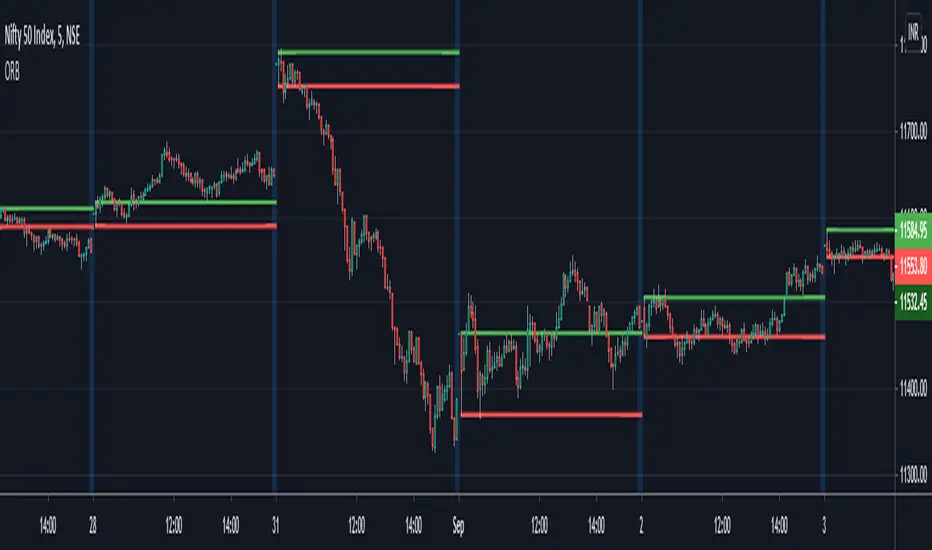
ORB - Opening Range BreakoutThis script plots the high/low of any custom session and extends it until the daily close. It does not show on the timeframe higher than the length of custom opening session by default.
The time period of opening range & the max timeframe to display it on can be adjusted from the settings.
So for eg. if want to use 5m ORB to trade, then set "ORB total time" as 5min & "Session Time" as whatever is the opening 5mins time period of ticker that are trading.
TD Ameritrade regular + extended US trading hours highlightTD Ameritrade regular + extended US trading hours highlight

How to Overlay First LTF Bar of DayExample how to overlay the first lower timeframe bar of the day across the entire day. Set chart to a timeframe that is lower than 1 Day period. Also included option for coloring wick pressure of that bar.
NOTICE: This is an example script and not meant to be used as an actual strategy. By using this script or any portion thereof, you acknowledge that you have read and understood that this is for research purposes only and I am not responsible for any financial losses you may incur by using this script!
Daily Weekly Monthly Yearly OpensThis script plots the current daily, weekly and monthly opens (all enabled by default).
Here are some additional info about the drawing behavior:
Daily open is shown only on intraday timeframes
Weekly open is shown only on timeframes < weekly
Monthly open is shown only on timeframes < monthly
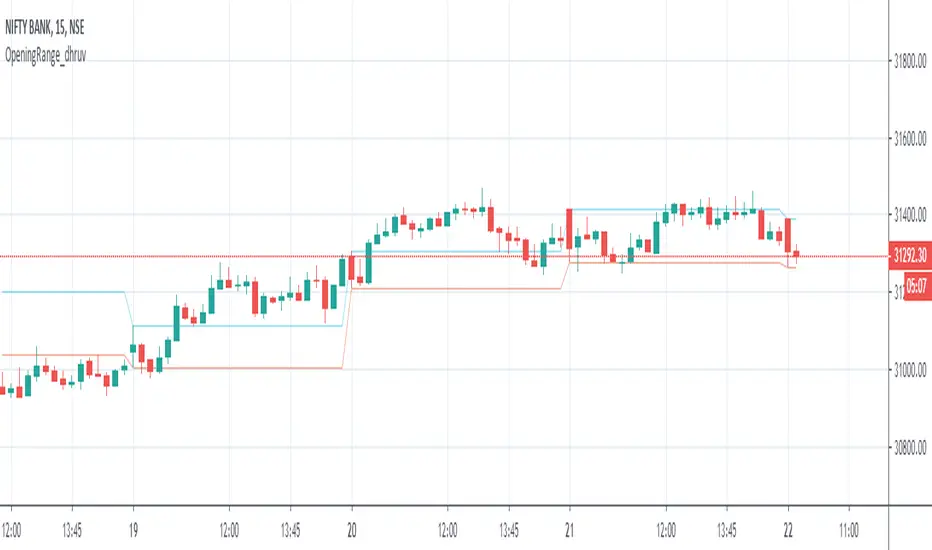
Opening Range_dhruvHello Traders ..
this is the strategy for opening range 15 min high low auto marking tool
Opening Range Breakout - ORBThe opening range is simply the high and low of a given period after the market opens. This period is generally the first 30 minutes or the first hour of trading.
During this period, you want to identify the high and low of the day. In addition, you will also want to account for the pre-market highs and lows, as these levels will often act like a magnet on price action after the bell rings.
Since the opening bell is associated with big trading volumes and volatility, this time of the session provides many trading opportunities. In this manner, traders use the opening range to set entry points on the chart and to forecast the price action for the day.

_SP(viaCM)_Opening-Range-FinalChris Moody's script. I just lessened the line/circle width, got rid of the highlighting overall, and reduced the highlighting between OR high and OR low.
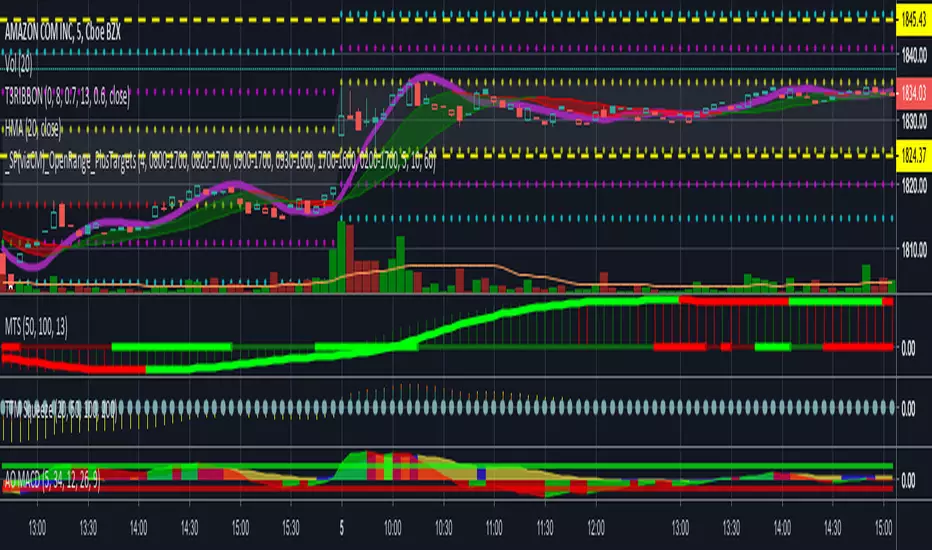
Opening-RangesThis indicator will give you expansion levels of the opening range ( I recommend/use 15 min opening range) to trade futures and stocks. There are two colors used, the Fuchsia(Magenta) colored dots are the opening range added and subtracted from opening price. The Aqua(Cyan) colored dots are the opening range stacked. Like blocks. They are both respected during the day. But not as much as longer time frame fib levels.
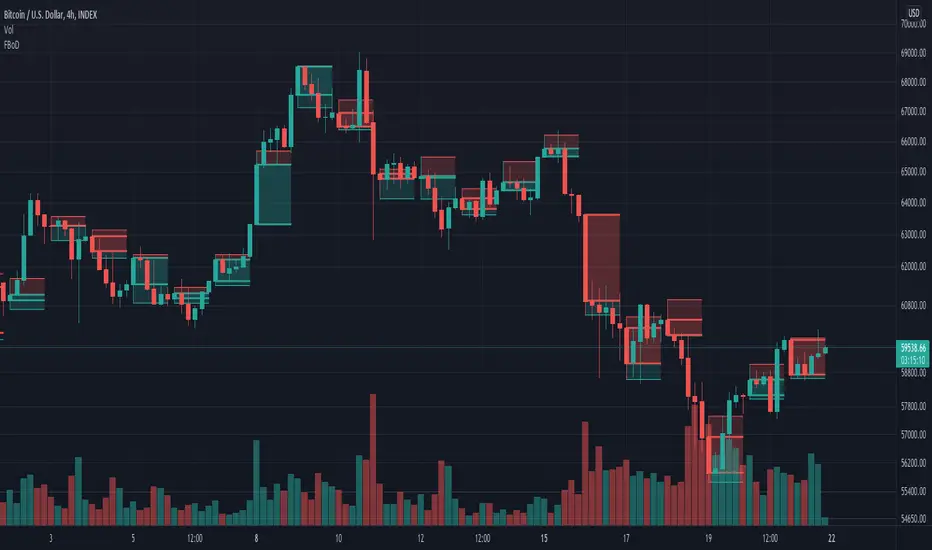
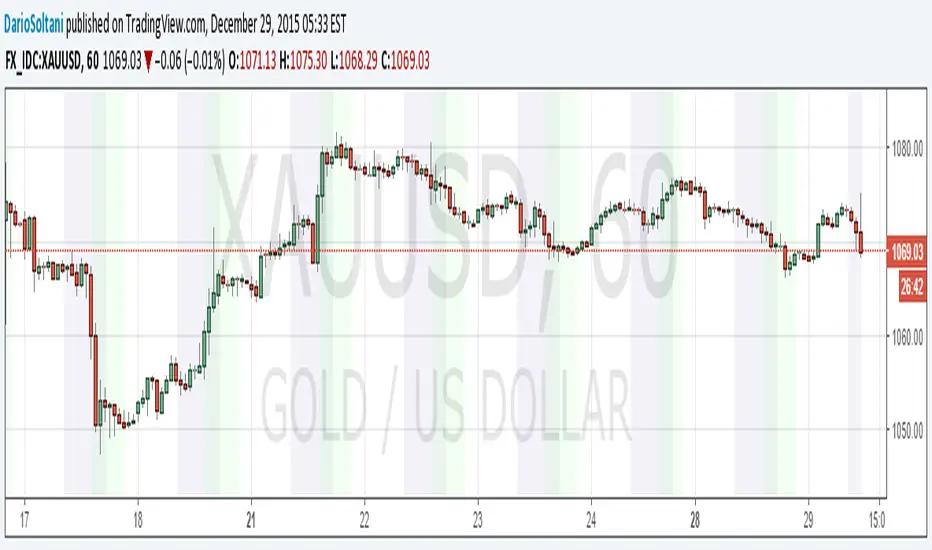
Gappers - Closed gaps analysis
Hey all,
trading the week-end gap on monday is a well known trading technique, praised by most and ignored by others
With my script you can easily see where there have been monday gaps and see where these gaps has been closed on monday
If a gap is present the script shows a WHITE SQUARE
if a gap is present and is filled on monday candle it shows WHITE SQUARE + "GAP CLOSED"
You can also set the threshold for the gap (first parameter)
and set the threshold of how near last candle close your TP is
Defaults are 1.001 for gap and 1.001 for closed TP (for gap 1.0019 takes in account only big gaps)
Enjoy and tell me what you think
Cheers!
Lorenzo

Trading hours background highlight UTC basedHighlights trading opening hours in the background based on UTC times.
Settings for US and EU markets available now, let me know if you want other markets.
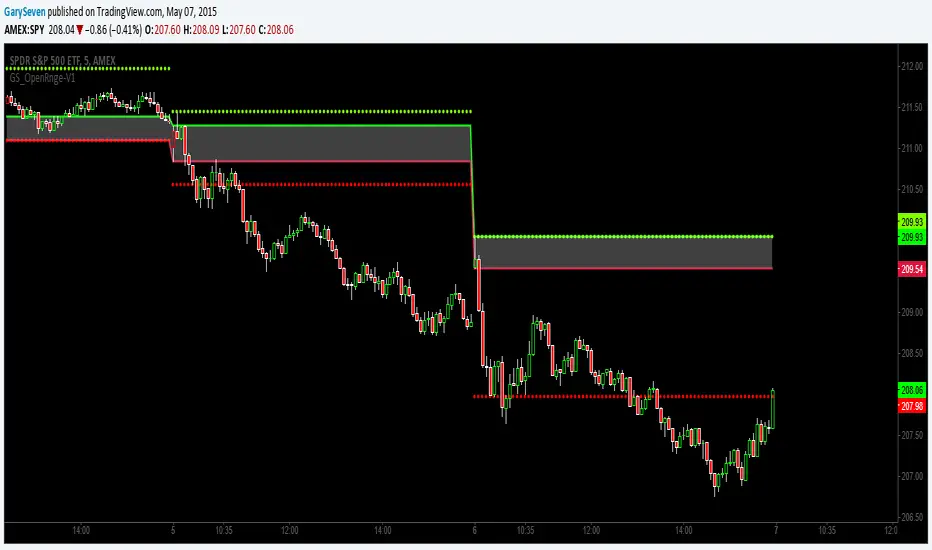
GS_Opening-Range-V1ORB Opening Range Breakout 5 and 3O Minute Indicator
Kudos to Chris Moody for the inspiration to create my first indicator.
The 5 and 30 run together at times but the scalp would be when the equity breaks the 5 go long or short for the scalp and when it breaks the 30 go for the swing trade.
Open Close Daily LineThis will place circles on your chart for the opening daily price. If price is above, the circles are green. If price is below, the circles are red. I wanted to be able to see the opening price a bit easier while in smaller time frames.
I decided to add the previous daily closing line to the original script. Basically looking for good support / resistance
