Larry Williams POIV A/D [tradeviZion]Larry Williams' POIV A/D - Release Notes v1.0
=================================================
Release Date: 01 April 2025
OVERVIEW
--------
The Larry Williams POIV A/D (Price, Open Interest, Volume Accumulation/Distribution) indicator implements Williams' original formula while adding advanced divergence detection capabilities. This powerful tool combines price movement, open interest, and volume data to identify potential trend reversals and continuations.
FEATURES
--------
- Implements Larry Williams' original POIV A/D formula
- Divergence detection system:
* Regular divergences for trend reversal signals
* Hidden divergences for trend continuation signals
- Fast Mode option for earlier pivot detection
- Customizable sensitivity for divergence filtering
- Dynamic color visualization based on indicator direction
- Adjustable smoothing to reduce noise
- Automatic fallback to OBV when Open Interest is unavailable
FORMULA
-------
POIV A/D = CumulativeSum(Open Interest * (Close - Close ) / (True High - True Low)) + OBV
Where:
- Open Interest: Current period's open interest
- Close - Close : Price change from previous period
- True High - True Low: True Range
- OBV: On Balance Volume
DIVERGENCE TYPES
---------------
1. Regular Divergences (Reversal Signals):
- Bullish: Price makes lower lows while indicator makes higher lows
- Bearish: Price makes higher highs while indicator makes lower highs
2. Hidden Divergences (Continuation Signals):
- Bullish: Price makes higher lows while indicator makes lower lows
- Bearish: Price makes lower highs while indicator makes higher highs
REQUIREMENTS
-----------
- Works best with futures and other instruments that provide Open Interest data
- Automatically adapts to work with any instrument by using OBV when OI is unavailable
USAGE GUIDE
-----------
1. Apply the indicator to any chart
2. Configure settings:
- Adjust sensitivity for divergence detection
- Enable/disable Fast Mode for earlier signals
- Customize visual settings as needed
3. Look for divergence signals:
- Regular divergences for potential trend reversals
- Hidden divergences for trend continuation opportunities
4. Use the alerts system for automated divergence detection
KNOWN LIMITATIONS
----------------
- Requires Open Interest data for full functionality
- Fast Mode may generate more signals but with lower reliability
ACKNOWLEDGEMENTS
---------------
This indicator is based on Larry Williams' work on Open Interest analysis. The implementation includes additional features for divergence detection while maintaining the integrity of the original formula.
Open Interest

mrD Open InterestIntroduction
"mrD Open Interest" is a technical analysis reference tool that can help investors monitor and analyze Open Interest data from various cryptocurrency exchanges. This indicator provides insights into Open Interest data through patterns, bursts, and money flow based on proprietary algorithms.
Important Note
Trading always involves risk and can lead to capital loss. This indicator should only be used as a supplementary tool in technical analysis and should not be considered as an accurate forecasting tool or the sole basis for trading decisions. Past results do not guarantee future results.
Proprietary Features of the Indicator
"mrD Open Interest" has been developed with several proprietary features, qualifying it for source code protection when published:
- Unique Multi-Source Integration Algorithm: The indicator uses a smart aggregation method to combine OI data from multiple exchanges, creating a holistic view of market pressure that is not dependent on a single exchange. This method employs special weighting and noise filtering to ensure the aggregated data accurately reflects market conditions.
- Proprietary OI-Price Correlation Analysis Algorithm: Unlike traditional OI indicators that simply display OI values, this indicator uses a complex algorithm to analyze the correlation between price movements and OI changes. This algorithm automatically identifies four money flow patterns (Buy Inflow, Sell Inflow, Buy Outflow, Sell Outflow) and ranks them by potential market impact.
- Advanced Burst Detection Technology: The proprietary algorithm identifies "bursts" - sudden changes in OI that can lead to significant market volatility. This system relies not only on absolute change but also analyzes the rate of change, amplitude, and correlation with historical peaks/troughs to determine the significance of a burst.
- Integrated Smart Alert System: The indicator features a smart alert algorithm, only sending notifications when patterns with high statistical significance are detected, reducing "alert noise" and helping users focus on the most potential opportunities.
- Visual Representation Technology: The user interface design uses proprietary visual representation technology, allowing users to easily identify important patterns and signals through a special system of colors, icons, and display formats.
Features That May Assist
1. Reference Data from Multiple Exchanges: The indicator can collect Open Interest information from various exchanges (Binance, BitMEX, Kraken) and different currency pairs (USDT, USD, BUSD), potentially providing investors with more information about the market.
2.Money Flow Pattern Analysis: The indicator suggests 4 patterns that may help identify market conditions:
Buy Inflow: Potential opening of new long positions (price up, OI up)
Buy Outflow: Potential closing of long positions (price down, OI down)
Sell Inflow: Potential opening of new short positions (price down, OI up)
Sell Outflow: Potential closing of short positions (price up, OI down)
Burst Identification: The indicator attempts to detect "bursts" - notable changes in Open Interest that may signal changes in money flow. Bursts are divided into two types: Up Burst and Down Burst.
3. Price-OI Correlation Reference: The tool provides information about the relationship between price movement and OI changes, potentially helping to assess whether current price momentum is supported by new money flow.
4. Diverse Display Modes: The indicator offers 3 display modes (Columns, Candles, Columns, and Price Line) that may suit different analytical approaches.
Setup and Usage Guide
1. Basic Setup
Select Data Sources (Exchange Settings):
By default, the indicator uses data from Binance USDT Perpetual.
Depending on the coin pair and exchange you're interested in, you can enable/disable different data sources (Binance USD, BUSD, BitMEX USD, USDT, or Kraken).
Recommendation: For popular coins like BTC or ETH, consider combining data from 2-3 major exchanges for a more comprehensive view.
2. Display Customization (Visuals Settings):
OI Display Type: Choose a display type that suits your analysis style:
"Columns": Column format, making it easy to identify OI changes.
"Candles": Candle format, similar to price charts, helps identify candlestick patterns in OI.
"Columns and Price Line": Combines OI columns and price line, helping directly compare OI with price movements.
Show background: Enable to highlight burst periods with a colored background (recommended when using candle mode).
Show signals: Enable to display of burst indicators on the chart (recommended to keep enabled).
Text Color: Customize text color to match your chart background.
3. Alert Settings:
hoose alert types that suit your trading strategy:
"Inflows Only": Only alerts when new money flows into the market.
"Outflows Only": Only alerts when money flows out of the market.
"Bursts Only": Only alerts when there's a strong burst in OI.
"All": Alerts for all the above events.
Effective Usage
Trend Analysis Based on Money Flow Patterns:
Buy Inflow (Green): When the price increases along with OI, it may indicate new buying pressure. Can be considered as a supportive signal for an uptrend.
Sell Inflow (Red): When price decreases along with increasing OI, it may indicate new selling pressure. Can be considered as a supportive signal for a downtrend.
Buy Outflow (Teal): When price decreases but OI also decreases, it may indicate taking profit/cutting loss from long positions. Usually not strong selling pressure and may be ending soon.
Sell Outflow (Dark Red): When the price increases but OI decreases, it may indicate closing of short positions. Usually not strong buying pressure and may be ending soon.
Burst Analysis:
Up Burst: Strong and positive change in OI, most notable when occurring in a Buy Inflow pattern, may signal strong buying money flow into the market.
Down Burst: Strong and negative change in OI, most notable when occurring in a Sell Inflow pattern, may signal strong selling money flow into the market.
Bursts are often signals that deserve special attention and may indicate strong changes in market sentiment.
Using the Information Table:
Monitor "Aggregated OI" to capture the total amount of open contracts.
Pay attention to "OI Change (%)" to assess the degree of change compared to the previous candle.
"Relative OI" provides information about the relative level of OI compared to the average.
"Flow Type" indicates the current money flow pattern.
"Burst Status" displays the burst status if any.
Combining with Other Indicators:
Use in combination with trend indicators (MA, MACD) to confirm trends.
Combine with volume indicators for a more comprehensive view of market activity.
Reference additional momentum indicators to assess trend strength.
Customizing According to Timeframe:
Short timeframes (1m-15m): May show more noise signals.
Medium timeframes (30m-4h): Often provide a good balance between sensitivity and noise filtering.
Long timeframes (D-W): Suitable for monitoring long-term OI trends.

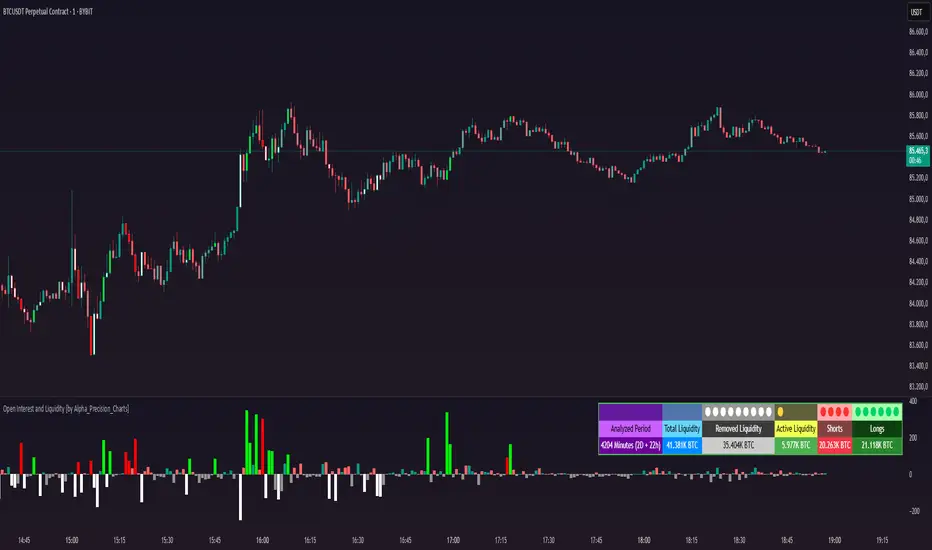
Open Interest and Liquidity [by Alpha_Precision_Charts]Indicator Description: Open Interest and Liquidity
Introduction:
The "Open Interest and Liquidity" indicator is an advanced tool designed for traders seeking to analyze aggregated Open Interest (OI) flow and liquidity in the cryptocurrency market, with a special focus on Bitcoin. It combines high-quality Open Interest data, a detailed liquidity table, and a visual longs vs shorts gauge, providing a comprehensive real-time view of market dynamics. Ideal for scalpers, swing traders, and volume analysts, this indicator is highly customizable and optimized for 1-minute charts, though it works across other timeframes as well.
Key Features:
Aggregated Open Interest and Delta: Leverages Binance data for accuracy, allowing traders to switch between displaying absolute OI or OI Delta, with value conversion to base currency or USD.
Liquidity Table: Displays the analyzed period, active liquidity, shorts, and longs with visual proportion bars, functioning for various cryptocurrencies as long as Open Interest data is available.
Longs vs Shorts Gauge: A semicircle visual that shows real-time market sentiment, adjustable for chart positioning, helping identify imbalances, optimized and exclusive for Bitcoin on 1-minute charts.
Utilities:
Sentiment Analysis: Quickly detect whether the market is accumulating positions (longs/shorts) or liquidating (OI exits).
Pivot Identification: Highlight key moments of high buying or selling pressure, ideal for trade entries or exits.
Liquidity Monitoring: The table and gauge provide a clear view of active liquidity, helping assess a move’s strength.
Scalping and Day Trading: Perfect for short-term traders operating on 1-minute charts, offering fast and precise visual insights.
How to Use:
Initial Setup: Choose between "Open Interest" (candles) or "Open Interest Delta" (columns) in the "Display" field. The indicator defaults to Binance data for enhanced accuracy.
Customization: Enable/disable the table and gauge as needed and position them on the chart.
Interpretation: Combine OI Delta and gauge data with price movement to anticipate breakouts or reversals.
Technical Notes
The indicator uses a 500-period VWMA to calculate significant OI Delta thresholds and is optimized for Bitcoin (BTCUSDT.P) on high-liquidity charts.
Disclaimer
This indicator relies on the availability of Open Interest data on TradingView. For best results, use on Bitcoin charts with high liquidity, such as BTCUSDT.P. Accuracy may vary with lower-volume assets or exchanges.
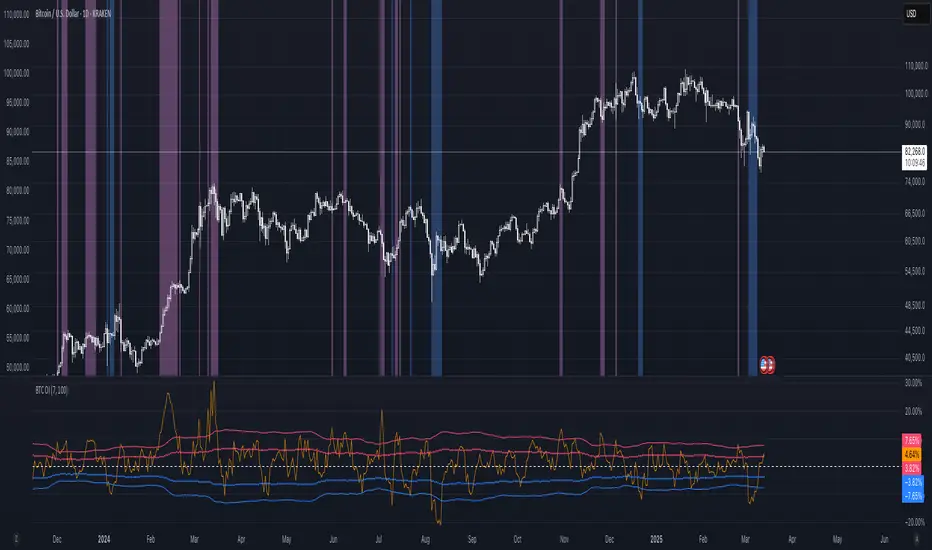
BTC: Open InterestThis indicator tracks the 7-day (default) percentage change in open interest (OI), providing insights into market participation trends. It includes customizable periods and colors, allowing traders to adjust settings for better visualization.
Open interest (OI) is the total number of active contracts (futures or options) that haven’t been closed or settled. It represents the total open positions in the market.
Thus when OI increases, more traders are entering new positions, signaling growing market interest. Conversely, when OI decreases, positions are being closed, suggesting lower trader participation or liquidation.
Attributes & Features:
Open Interest Percentage Change – Measures the 7-day % change in open interest to track market participation.
Customizable Calculation Period – Users can adjust the period (default: 7 days) for more flexible analysis.
Adjustable Colors – Allows modification of colors for better visualization.
Trend Identification – Highlights rising vs. falling open interest trends.
Works Across Assets – Can be used for cryptos, stocks, and futures with open interest data.
Overlay or Separate Panel – Can be plotted on price chart or as a separate indicator.
How It Works:
Fetches Open Interest Data – Retrieves open interest values for each day for USD, USDT, and USDC Bitcoin Perpetual Derivitives.
Calculates Percentage Change – Compares current open interest to its value X days ago (Default = 7 days).
Standard Deviation – Applies standard deviation ranging from -2 to +2 deviations to identify large shifts in OI.
Visual Alerts – Can highlight extreme increases or decreases signaling potential market shifts.
NOTE: THE INDICATOR DATA ONLY GOES BACK TO START OF 2022
Open Interest (Multiple Exchanges for Crypto)On some cryptocurrencies and exchanges the OI data is nonexistent or deplorable. With this indicator you can see OI data from multiple exchanges (or just the best one) from USD,USDT, or USD+USDT pairs whether you are using a perpetuals chart or not.
Hope you all like it!
ZenAlgo - Advanced Open InterestZenAlgo - Advanced Open Interest combines open interest, price changes, and volume dynamics into a single, powerful TradingView indicator. By integrating these key market metrics and enhancing them with proprietary algorithms, it provides traders with actionable insights that streamline decision-making and enhance market analysis.
Features
Open Interest Change (%): Tracks changes in open interest, a key indicator of market participation and sentiment.
Price Change (%): Monitors price momentum, providing clarity on trend directions.
Volume Analysis: Aggregates upward and downward volume for detailed sentiment analysis.
Delta Calculation: Highlights the net difference between upward and downward volume, offering instant insights into buying or selling dominance.
Proprietary Trend Detection: Suggests "Long Enter," "Short Enter," "Long Close," or "Short Close" signals based on a synergy of open interest, price, and volume.
Market Sentiment Insights: Indicates whether new long or short positions dominate.
Customizable Display: Features themes, sizes, and positions for a tailored interface.
Added Value: Why Is This Indicator Original/Why Shall You Pay for This Indicator?
Integrated Synergy: Combining open interest, price, and volume into a single indicator reduces complexity and offers enhanced clarity. Instead of toggling between multiple charts, users receive actionable insights from a unified view.
Proprietary Rules-Based Algorithm: The algorithm synthesizes data from sub-indicators, creating trends and signals not available in free tools. For instance, the "Long Enter" or "Short Close" signals are generated by evaluating relationships between metrics, offering a predictive edge.
Enhanced Trend Confirmation: By correlating open interest changes with price movements and volume imbalances, the indicator provides a more robust confirmation of market trends compared to individual metrics.
Time-Saving and Simplicity: Freely available sub-indicators require manual setup, interpretation, and customization. ZenAlgo - Advanced Open Interest offers pre-configured analysis, reducing the learning curve and decision time.
Unique Customization: With themes, positions, and table sizes, users can adapt the interface to their preferences, enhancing usability.
How It Works
1. Open Interest and Price Change
Retrieves historical open interest and price data for the selected timeframe.
Calculates percentage changes between bars to indicate market participation (open interest) and directional momentum (price).
Combines these metrics to assess whether price movements are supported by increasing or decreasing participation.
2. Volume Aggregation
Splits the selected timeframe into smaller sub-timeframes to analyze granular volume data.
Aggregates upward (price closes above open) and downward (price closes below open) volumes, calculating their totals and percentage contributions to overall volume.
3. Delta Calculation
Computes Delta as the difference between upward and downward volume.
Highlights buyer or seller dominance using color-coded visuals for quick interpretation.
4. Trend Analysis
Uses a proprietary algorithm to classify market states:
"Long Enter": Rising price, increasing open interest, and dominant upward volume.
"Short Enter": Falling price, increasing open interest, and dominant downward volume.
Neutral States: Generated when no strong alignment is found among metrics.
5. Market Sentiment
Correlates open interest and price to indicate if new long or short positions dominate.
Outputs simplified insights like "More longs opened" or "Shorts closing."
6. Customizable Table
Displays real-time updates with user-controlled themes, sizes, and positions for a tailored experience.
Usage Examples
Detecting Bullish Trends: Identify "Long Enter" signals when open interest and price rise, supported by strong upward volume.
Spotting Bearish Reversals: Use "Short Enter" signals when price declines, open interest rises, and downward volume dominates.
Analyzing Volume Shifts: Leverage Delta to uncover significant shifts in buying or selling pressure.
Validating Trends: Use the combination of open interest and volume trends to confirm price movements.
Exiting Profitable Trades: Look for "Long Close" or "Short Close" signals to time exits during profit-taking phases.
Avoiding Choppy Markets: Use "Neutral" signals to stay out of indecisive markets and avoid unnecessary risks.
Identifying Sentiment Swings: Follow "Positions" insights to detect a transition in market dominance from longs to shorts or vice versa.
High-Volume Trend Confirmation: Confirm strong trends during high trading volumes.
Short-Term Scalping: Use sub-timeframes to spot rapid entry and exit points.
Event-Based Trading: Correlate indicator signals with major market events for timely trades.
Settings
ZenAlgo Theme: Toggle a branded theme for better visual integration.
Table Size: Adjust display size (Tiny, Small, Normal, Large) based on preference.
Table Position: Choose between four positions (e.g., Bottom Right, Top Left).
Table Mode: Switch between Dark and Light themes for optimal readability.
Important Notes
This indicator is a technical analysis tool and does not guarantee trading success. Use it with other indicators and fundamental analysis for a comprehensive strategy.
Always validate signals in conjunction with other market factors to ensure informed trading decisions.
Scenarios of Potential Underperformance:
Low-Volume Markets: Signals may lack reliability due to insufficient data granularity.
Extreme Volatility: Rapid price movements can distort short-term insights.
Exchange Variations: Data discrepancies between exchanges may affect calculations.
Choppy Markets: During indecisive phases, the indicator may generate more neutral signals.

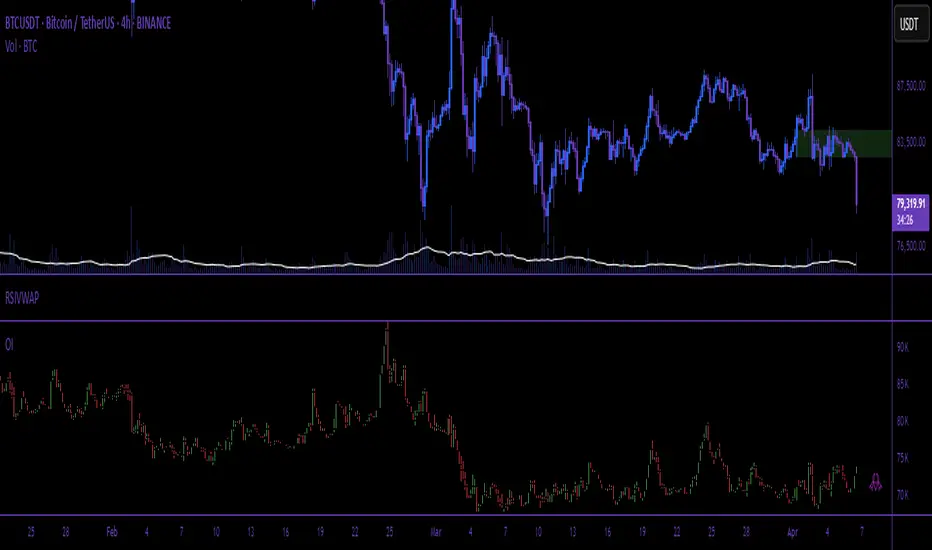
Relative Open Interest - TradingriotRelative Open Interest
This indicator presents a normalized visualization of Open Interest, employing methodology similar to oscillators like RSI.
It transforms raw Open Interest data into an intuitive format that helps identify significant shifts in market positioning within perpetual futures markets.
Overbought Territory (>70)
When the indicator enters overbought territory, it signals substantial new directional perpetuals futures increase in the market.
This surge in positioning can signal two potential scenarios:
Momentum Continuation: The influx of new participants reinforces the existing trend
Mean Reversion: The rapid accumulation of positions creates conditions for a potential reversal
Oversold Territory (<30)
Oversold readings indicate a significant reduction in open positions, typically through a combination of:
Voluntary position closures
Stop-loss triggers
Forced liquidations
These conditions often present compelling mean reversion opportunities as the market digests this rapid position reduction.
Implementation Framework
While this indicator provides valuable insights into market positioning dynamics, it should be integrated within a comprehensive analytical framework rather than used in isolation.
The signals it generates are most effective when confirmed by complementary technical and fundamental analysis tools.
The indicator's strength lies in its ability to quantify and visualize significant changes in market participation, offering traders a sophisticated metric for understanding potential market inflection points and positioning dynamics.
Can be used on any timeframe with any lookback, make sure to backtest the settings that work best for you.
Do not forget that indicator only works when used on Binance perpetual futures charts.
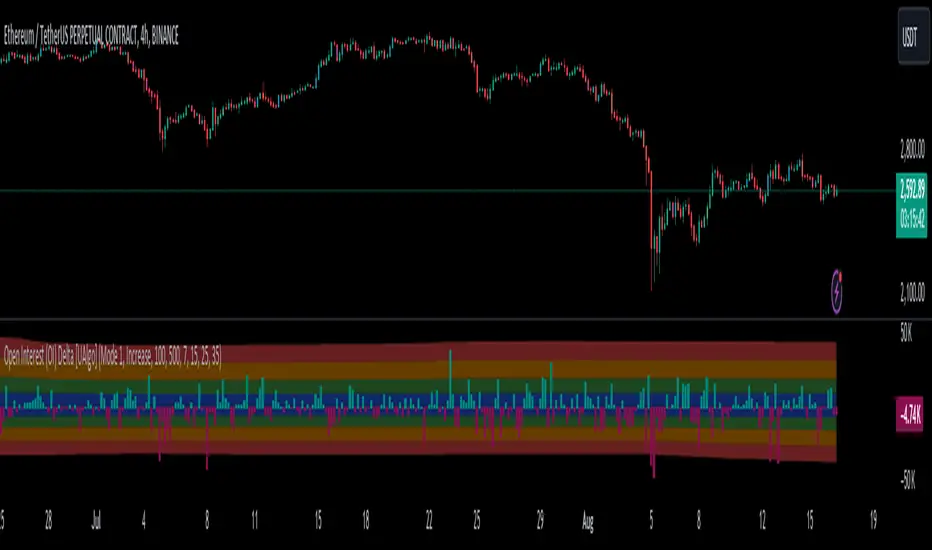
Open Interest (OI) Delta [UAlgo]The Open Interest (OI) Delta indicator is a tool designed to provide insights into the dynamics of Open Interest changes within the futures market. Open Interest (OI) refers to the total number of outstanding derivative contracts, such as options or futures, that have not been settled. The OI Delta measures the change in Open Interest over a specified period, allowing traders to assess whether new money is entering the market or existing positions are being closed.
This indicator offers two distinct display modes to visualize OI Delta, along with customizable levels that help in categorizing the magnitude of OI changes. Additionally, it provides the option to color-code the bars on the price chart based on the intensity and direction of OI Delta, making it easier for traders to interpret market sentiment and potential future price movements.
🔶 Key Features
Two Display Modes: Choose between two different modes for visualizing OI Delta, depending on your analysis preferences:
Mode 1: Displays the OI Delta directly as positive or negative values.
Mode 2: Separates positive and negative OI Delta values, displaying them as absolute values for easier comparison.
Customizable Levels: Set up to four levels of OI Delta magnitude, each with customizable thresholds and colors. These levels help categorize the OI changes into Normal, Medium, Large, and Extreme ranges, allowing for a more nuanced interpretation of market activity.
MA Length and Standard Deviation Period: Adjust the moving average length and standard deviation period for OI Delta, which smooths out the data and helps in identifying significant deviations from the norm.
Color-Coded Bar Chart: Optionally color the price bars on your chart based on the OI Delta levels, helping to visually correlate price action with changes in Open Interest.
Heatmap Display: Toggle the display of OI Delta levels on the chart, with the option to fill the areas between these levels for a more visually intuitive understanding of the data.
🔶 Interpreting Indicator
Positive vs. Negative OI Delta:
A positive OI Delta indicates that the Open Interest is increasing, suggesting that new contracts are being created, which could imply fresh capital entering the market.
A negative OI Delta suggests that Open Interest is decreasing, indicating that contracts are being closed out or settled, which might reflect profit-taking or a reduction in market interest.
Magnitude Levels:
Level 1 (Normal OI Δ): Represents typical, less significant changes in OI. If the OI Delta stays within this range, it may indicate routine market activity without any substantial shift in sentiment.
Level 2 (Medium OI Δ): Reflects a more significant change in OI, suggesting increased market interest and possibly the beginning of a new trend or phase of market participation.
Level 3 (Large OI Δ): Indicates a strong change in OI, often associated with a decisive move in the market. This could signify strong conviction among market participants, either bullish or bearish.
Level 4 (Extreme OI Δ): The highest level of OI change, often preceding major market moves. Extreme OI Δ can be a signal of potential market reversals or the final phase of a strong trend.
Color-Coded Bars:
When enabled, the color of the price bars will reflect the magnitude and direction of the OI Delta. This visual aid helps in quickly assessing the correlation between price movements and changes in market sentiment as indicated by OI.
This indicator is particularly useful for futures traders looking to gauge the strength and direction of market sentiment by analyzing changes in Open Interest. By combining this with price action, traders can gain a deeper understanding of market dynamics and make more informed trading decisions
🔶 Disclaimer
Use with Caution: This indicator is provided for educational and informational purposes only and should not be considered as financial advice. Users should exercise caution and perform their own analysis before making trading decisions based on the indicator's signals.
Not Financial Advice: The information provided by this indicator does not constitute financial advice, and the creator (UAlgo) shall not be held responsible for any trading losses incurred as a result of using this indicator.
Backtesting Recommended: Traders are encouraged to backtest the indicator thoroughly on historical data before using it in live trading to assess its performance and suitability for their trading strategies.
Risk Management: Trading involves inherent risks, and users should implement proper risk management strategies, including but not limited to stop-loss orders and position sizing, to mitigate potential losses.
No Guarantees: The accuracy and reliability of the indicator's signals cannot be guaranteed, as they are based on historical price data and past performance may not be indicative of future results.
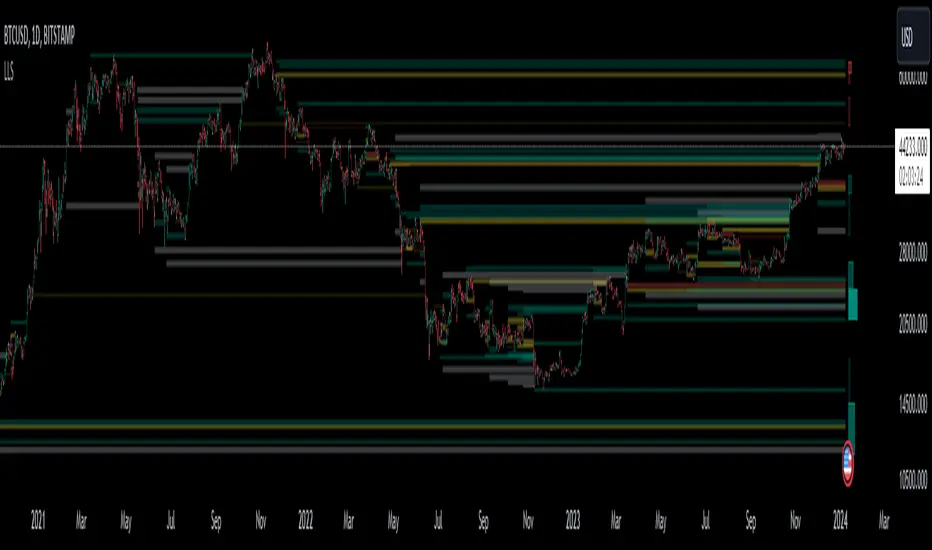
Open Interest liquidation map [Ox_kali]This script is inspired by @LeviathanCapital work on aggregating Open Interest , as presented in the Open Interest Suite Aggregated script. This script aims to provide a liquidation map of Open Interest by identifying significant anomalies across multiple trading platforms. By integrating data from Binance, BitMEX, and Kraken, this script tries to offer a comprehensive and detailed view of Open Interest movements and attempts to define zones of interest.
Key Points
1. Multiple Data Sources : The script retrieves Open Interest data from several trading platforms, including Binance (USDT, USD, BUSD), BitMEX (USD, USDT), and Kraken (USD).
2. Anomaly Detection : Utilizes a simple moving average (SMA) to calculate the average size of Open Interest candles and identify anomalies based on a user-specified size factor.
3. Background Coloring : Offers an option to color the background of the charts based on detected anomalies, allowing for clear visualization of significant movements.
4. Dynamic Support and Resistance Zones : Defines and dynamically updates support and resistance zones based on Open Interest anomalies.
5. Alerts : Configures alerts to notify the user when an Open Interest anomaly is detected.
Trading Utility
This script can be useful for monitoring significant changes in Open Interest and potential liquidation zones across multiple platforms. The main trading applications include:
1. Identifying Liquidation Points : By detecting Open Interest anomalies, it is possible to identify potential liquidation points where significant price movements might occur.
2. Multi-Platform Analysis : By aggregating Open Interest data from multiple platforms, a more comprehensive market overview is obtained.
3. Detecting Support and Resistance Zones : Dynamic support and resistance zones help identify key price levels where trend reversals might occur.
4. Customized Alerts: Anomaly alerts allow for automated responses to market changes.
Conclusion
The “Open Interest liquidation map ” script is an experimental tool for analyzing Open Interest across multiple trading platforms. Inspired by Leviathan’s work, this script attempts to identify liquidation and interest zones. This is an experimental version, and I welcome any comments and feedback for improvement.
Please note that the Open Interest liquidation map is not a guarantee of future market performance and should be used in conjunction with proper risk management. Always ensure that you have a thorough understanding of the indicator’s methodology and its limitations before making any investment decisions. Additionally, past performance is not indicative of future results.
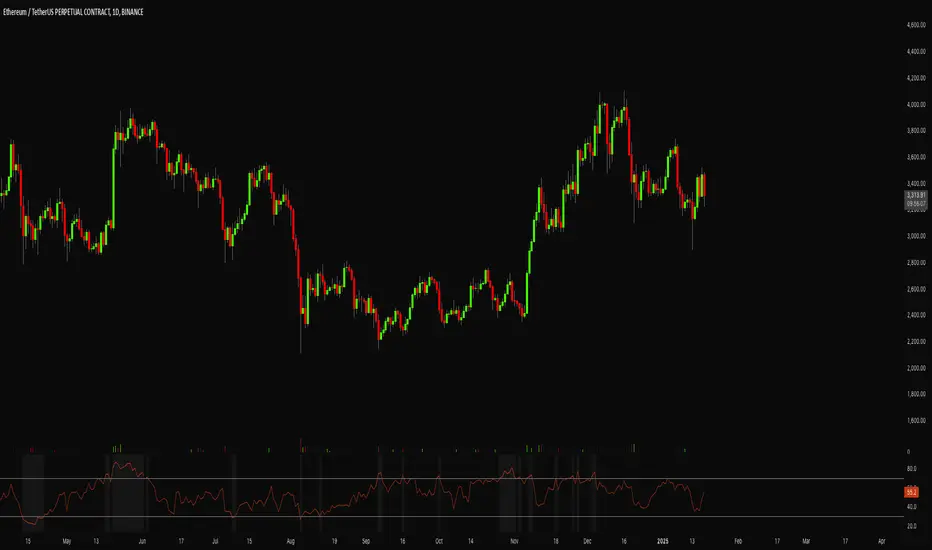
RSI Screener / Heatmap - By LeviathanThis script allows you to quickly scan the market by displaying the RSI values of up to 280 tickers at once and visualizing them in an easy-to-understand format using labels with heatmap coloring.
📊 Source
The script can display the RSI from a custom timeframe (MTF) and custom length for the following data:
- Price
- OBV (On Balance Volume)
- Open Interest (for crypto tickers)
📋 Ticker Selection
This script uses a different approach for selecting tickers. Instead of inputting them one by one via input.symbol(), you can now copy-paste or edit a list of tickers in the text area window. This approach allows users to easily exchange ticker lists between each other and, for example, create multiple lists of tickers by sector, market cap, etc., and easily input them into the script. Full credit to @allanster for his functions for extracting tickers from the text. Users can switch between 7 groups of 40 tickers each, totaling 280 tickers.
🖥️ Display Types
- Screener with Labels: Each ticker has its own color-coded label located at its RSI value.
- Group Average RSI: A standard RSI plot that displays the average RSI of all tickers in the group.
- RSI Heatmap (coming soon): Color-coded rows displaying current and historical values of tickers.
- RSI Divergence Heatmap (coming soon): Color-coded rows displaying current and historical regular/hidden bullish/bearish divergences for tickers.
🎨 Appearance
Appearance is fully customizable via user inputs, allowing you to change heatmap/gradient colors, zone coloring, and more.

Open Interest Inflows & Outflows [LuxAlgo]The Open Interest Inflows & Outflows indicator focuses on highlighting alterations in the overall count of active contracts associated with a specific financial instrument.
The indicator also includes an oscillator highlighting the price sentiment to use in conjunction with the open interest flow sentiment and also includes a rolling correlation of the open interest flow sentiment with a user-selected source.
🔶 USAGE
Open Interest (OI) indicates the total number of active contracts, encompassing both long and short positions, for a specific financial instrument at any given moment. This key indicator helps traders and analysts assess market activity and sentiment.
An increase in open interest generally indicates new money flowing into the market, suggesting increased activity and the potential for a trending market. Conversely, a decrease in open interest indicates that traders are closing their positions, suggesting less interest in that particular contract.
Open Interest Flow Sentiment assesses the correlation between the initiation of new positions (inflows) and the closure of existing positions (outflows) for a particular instrument. Positive values suggest a prevalence of inflows, while negative values signify a prevalence of outflows.
The magnitude of the deviation from zero reflects the extent of dominance, either in inflows or outflows.
Price Sentiment estimates the relationship between the strength of bulls (buyers) and bears (sellers) on an instrument. Positive values indicate higher bull power and negative values indicate higher bear power.
The correlation feature is a key component of the indicator and helps analyze the relationship between trading volume and Open Interest changes. If volume increases along with rising Open Interest, it supports the validity of the price trend.
A divergence between price movement, volume, and Open Interest may signal potential reversals.
🔶 DETAILS
This indicator, based on Dr. Alexander Elder's acclaimed Elder-Ray concept, aids traders in evaluating the strength of both bulls and bears by delving beneath the surface of the markets. It uncovers data not immediately apparent from a superficial glance at prices. The indicator comprises two components: Bull Power and Bear Power.
Considering that the high price of any candle signifies the maximum power of buyers and the low price represents the maximum power of sellers, Elder employs the 13-period Exponential Moving Average (EMA) to depict the average consensus of price value. Bull Power assesses whether buyers can drive prices above the average consensus of value, while Bear Power assesses whether sellers can push prices below this average.
Here are the formulas for Bull Power and Bear Power:
bull_power = high - ema(close, 13)
bear_power = low - ema(close, 13)
This concept is utilized to calculate Open Interest Flow Sentiment and Price Sentiment. The Open Interest Flow Sentiment estimates the relationship between new positions (inflows) and positions being closed (outflows), providing insights into market dynamics. The Price Sentiment, on the other hand, gauges the correlation between price movements and the Elder-Ray components, aiding traders in identifying potential shifts in market sentiment and momentum.
🔶 SETTINGS
🔹Open Interest Inflows & Outflows
OI Sentiment Correlation: toggles the visibility of Open Interest correlation with a variety of sources.
Money Flow Estimates: toggles the visibility of Money Flow Estimates calculated for the last bar.
🔹Style
OI Flow Sentiment: toggles the visibility of Open Interest Flow Sentiment, along with color customization options.
Price Sentiment: toggles the visibility of Price Sentiment, along with color customization options.
Correlation Colors: color customization option for the Correlation Area.
🔹Others
Smoothing: smoothing length applicable for Open Interest Flow Sentiment and Price Sentiment.
🔶 RELATED SCRIPTS
Open-Interest-Chart
Liquidation-Estimates
Thanks to our community for recommending this script. For more conceptual scripts and related content, we welcome you to explore by visiting >>> LuxAlgo-Scripts .

Open Interest SThis script shows Open Interest. You can choose measure, view and highlight large OI changes based on Z-Score.
Features
Measure USD or COIN
View OI Candles or OI Change columns with wicks
Z-Score Highlight Z Length is the period for calculations, Z Threshold is the standard
deviation from the average change in OI for the selected period
Color You can change the colors for OI
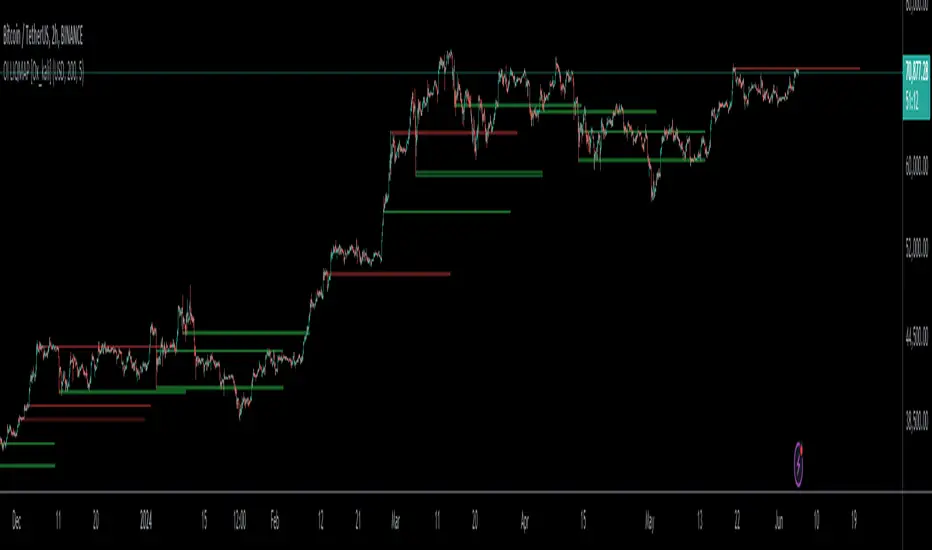
Liquidation Level ScreenerThe Liquidation Level Screener is an analytical tool designed for traders who seek a comprehensive view of potential liquidation zones in the market. This script, adaptable to almost any timeframe from 1 minute to 3 days, offers a unique perspective by mapping out key liquidation levels where significant market actions could occur.
Key Features:
Multi-Exchange Data Aggregation: Unlike many other indicators, the Liquidation Levels Indicator compiles data from multiple leading exchanges including Binance, Bitmex, Kraken, and Bitfinex. This approach ensures a more holistic and accurate representation of market sentiment, providing insights into potential liquidation points across various platforms.
Customizable Timeframes and Modes: The script is versatile, working effectively across various timeframes. It operates in two distinct modes:
Actual Levels Display: Visually represents potential liquidation levels.
Settings Mode: Showcases an open interest (OI) oscillator. When OI is exceptionally high, indicating a surge in opened positions at a specific candle, it signals traders to be vigilant about upcoming liquidation levels.
Three-Tier Liquidation System: The indicator categorizes liquidation levels into three distinct tiers based on open interest levels—1, 2, and 3—with Level 3 representing the highest concentration of open positions. This tiered approach allows traders to gauge the significance of each level and adjust their strategies accordingly.
Histogram Visualization: A novel feature of this script is the histogram on the chart's right side, representing the concentration of liquidation levels in specific market zones. This visual aid helps traders identify crucial areas that warrant close attention, enhancing decision-making.
Customizable Options:
Moving Averages: Choose from a wide range of moving average types, including VWMA, SMA, EMA, and more, to tailor the indicator to your analysis style.
Histogram Settings: Adjust the number of histograms, lookback bars, and their proximity to the latest candle, allowing for a personalized density and range of visualization.
Liquidation Level Sensitivity: Set thresholds for different liquidation levels, fine-tuning the indicator to detect varying degrees of market leverage.
Color Coding: Customize the color scheme for different leverage levels, enhancing visual clarity and ease of interpretation.
The Liquidation Level Screener offers a unique edge by highlighting potential zones where significant market movements can occur due to liquidations. By consolidating data from multiple exchanges, it provides a more rounded view of market behavior, which is essential in today’s interconnected trading environment. The tiered liquidation system and histogram feature equip traders with the ability to identify and focus on key market segments where high activity is expected. This tool is particularly valuable for traders who base their strategies on market liquidity and leverage dynamics.
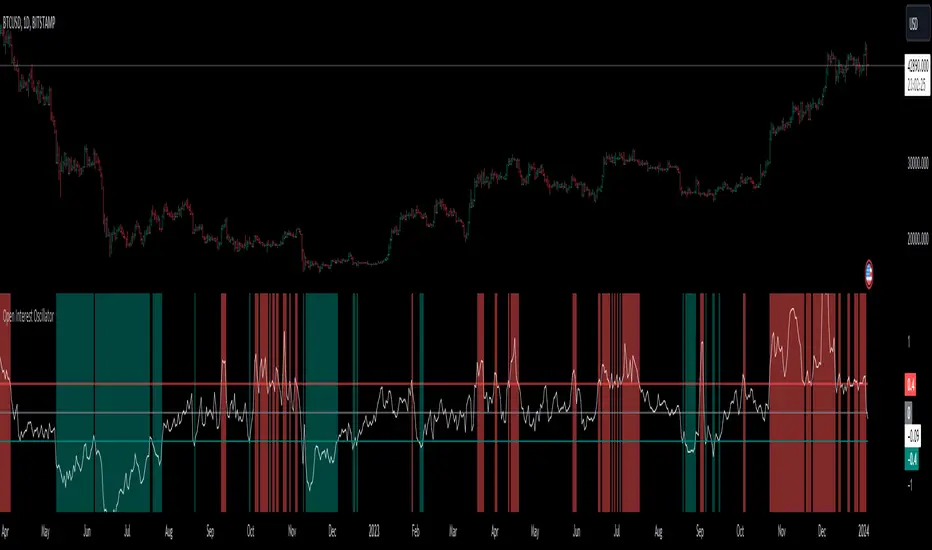
Open Interest OscillatorIn the middle of a bustling cryptocurrency market, with Bitcoin navigating a critical phase and the community hype over potential ETF approvals, current funding rates, and market leverage, the timing is optimal to harness the capabilities of sophisticated trading tools.
Meet the Open Interest Oscillator – special indicator tailored for the volatile arena of cryptocurrency trading. This powerful instrument is adept at consolidating open interest data from a multitude of exchanges, delivering an in-depth snapshot of market sentiment across all timeframes, be it a 1-minute sprint or a weekly timeframe.
This versatile indicator is compatible with nearly all cryptocurrency pairs, offering an expansive lens through which traders can gauge the market's pulse.
Key Features:
-- Multi-exchange Data Aggregation: This feature taps into the heart of the crypto market by aggregating open interest data from premier exchanges such as BINANCE, BITMEX, BITFINEX, and KRAKEN. It goes a step further by integrating data from various pairs and stablecoins, thus providing traders with a rich, multi-dimensional view of market activities.
-- Open Interest Bars: Witness the flow of market dynamics through bars that depict the volume of positions being opened or closed, offering a clear visual cue of trading behavior. In this mode, If bars are going into negative zone, then traders are closing their positions. If they go into positive territory - leveraged positions are being opened.
-- Bollinger Band Integration: Incorporate a layer of statistical analysis with standard deviation calculations, which frame the open interest changes, giving traders a quantified edge to evaluate the market's volatility and momentum.
-- Oscillator with Customizable Thresholds: Personalize your trading signals by setting thresholds that resonate with your unique trading tactics. This customization brings the power of tailored analytics to your strategic arsenal.
-- Max OI Ceiling Setting: In the fast-paced crypto environment where data can surge to overwhelming levels, the Max OI Ceiling ensures you maintain a clear view by capping the open interest data, thus preserving the readability and interpretability of information, even when market activity reaches feverish heights.
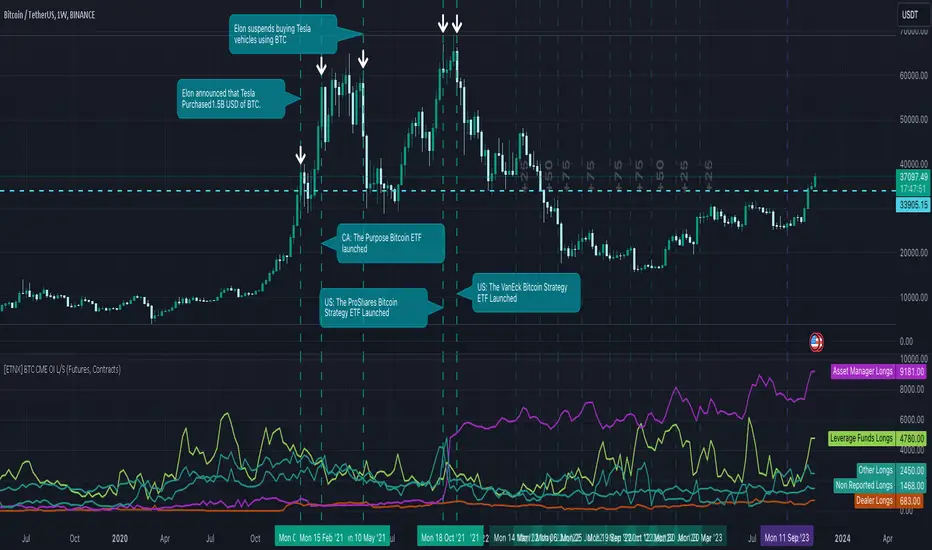
[ETNX] BTC CME OI L/SOVERVIEW
This indicator displays how many traders have Long and Short positions opened on CME Bitcoin Futures and Options. The data is provided from the CFTC Commitments of Traders Reports. These reports are given weekly. Therefore, this indicator works better on weekly timeframes.
The COT reports are separated into 5 categories:
Dealer/Intermediary - These participants are typically described as the “sell side” of the market. Though they may not predominately sell futures, they design and sell various financial assets to clients. They tend to have matched books or offset their risk across markets and clients. Futures contracts are part of the pricing and balancing of risk associated with the products they sell and their activities. These include large banks (U.S. and non-U.S.) and dealers in securities, swaps, and other derivatives.
Asset Manager/Institutional - These are institutional investors, including pension funds, endowments, insurance companies, mutual funds, and portfolio/investment managers whose clients are predominantly institutional.
Leveraged Funds - These are typically hedge funds and various types of money managers, including registered commodity trading advisors (CTAs); registered commodity pool operators (CPOs), or unregistered funds identified by CFTC. The strategies may involve taking outright positions or arbitrage within and across markets. The traders may be engaged in managing and conducting proprietary futures trading and trading on behalf of speculative clients.
Other Reportables - Reportable traders not placed into one of the first three categories are placed into the “other reportables” category. The traders in this category mostly use markets to hedge business risk, whether that risk is related to foreign exchange, equities, or interest rates. This category includes corporate treasuries, central banks, smaller banks, mortgage originators, credit unions and any other reportable traders not assigned to the other three categories.
Non Reportable
INPUT DISPLAY
The Open Interest can be displayed in three ways:
Contracts - How many contracts are opened on CME
BTC - How many BTC the contracts worth
Billions USD - How much is worth in USD based on the CME BTC Price
The Open Interest is calculated for:
Futures - The Futures Short and Long Positions Opened
Futures & Options - The Futures & Options Short and Long Positions Opened
OI Visible Range Ladder [Kioseff Trading]Hello!
This Script “OI Visible Range Ladder” calculates open interest profiles for the visible range alongside an OI ladder for the visible period!
Features
OI Profile Anchored to Visible Range
OI Ladder Anchored to Visible Range
Standard POC and Value Area Lines, in Addition to Separated POCs and Value Area Lines for each category of OI x Price
Configurable Value Area Targets
Curved Profiles
Up to 9999 Profile Rows per Visible Range
Stylistic Options for Profiles
Up to 9999 volume profile levels (Price levels) can be calculated for each profile, thanks to the new polyline feature, allowing for less aggregation / more precision of open interest at price.
The image above shows primary functionality!
Green profiles = Up OI / Up Price
Yellow profiles = Down OI / Up Price
Purple profiles = Up OI / Down Price
Red profiles = Down OI / Down Price
The image above shows POCs for each OI x Price category!
Profiles can be anchored on the left side for a more traditional look.
The indicator is robust enough to calculate on “small price periods”, or for a price period spanning your entire chart fully zoomed out!
That’s about it :D
This indicator is Part of a series titled “Bull vs. Bear” - a suite of profile-like indicators.
Thanks for checking this out!
If you have any suggestions please feel free to share!

Zig-Zag Open Interest Footprint [Kioseff Trading]Hello!
This script "Zig Zag Open Interest Footprint" calculates open interest x price values for zig zag trends!
Features
Open interest footprints anchored to zig zag trends
Summed OI x price level footprints
Total OI (for each category) for the entire trend shown
Standard POC lines, in addition to separated POC lines for each category of open interest x price possibility
Up to 9999 profile rows per zigzag trend
Stylistic options for profiles
Configurable zig zag - footprints generated for small to large trends
The zigzag indicator is configurable as normal; minor and major trend volume footprints are calculable. This indicator can be thought of as "Open Interest Footprint for Trends''.
Up to 9999 open interest levels (price levels) can be calculated for each profile, thanks to the new polyline feature, allowing for less aggregation / more precision of open interest at price.
Zig Zag OI Footprints
The image above shows primary functionality!
Green = Higher OI + Higher Price
Yellow = Lower OI + Higher Price
Purple = Higher OI + Lower Price
Red = Lower OI + Lower Price
Profiles are generated for each trend identified by the zigzag indicator.
The image above shows the indicator calculating open interest x price for specific price blocks on the footprint. Aggregate open interest for the identified trend is displayed over the profile!
Neon highlighted values correspond to the highest open interest change for the category. This is a configurable option :D
The image above shows POC lines for each category of open interest x price!
Additionally, you can select to show a single POV for footprint - the single level the greatest amount of OI change occurred.
The indicator is robust enough to calculate on "long zig zags" and "short zig zags"; curved profiles can also be used!
The image above shows key levels, each OI footprint, and summed OI values for the current trend!
That's about it :D
This indicator is part of a series titled "Bull vs. Bear" - a suite of profile-like indicators I will be releasing over the coming days. Thanks for checking this out!
If you have any suggestions please feel free to share!

TASC 2023.10 COT Commercials Indicator█ OVERVIEW
This script implements the COT Commercials Indicator introduced by Alfred François Tagher in an article featured in TASC's October 2023 edition of Traders' Tips . The indicator is designed for use in futures markets and represents a fast stochastic (%K) calculated based on the commercial open interest values of an asset derived from the weekly Commitments Of Traders (COT) report .
█ CONCEPTS
The COT report, issued by the Commodity Futures Trading Commission (CFTC) , presents a breakdown of reportable open interest positions held by various trader groups—commercial, noncommercial, and nonreportable (small traders). Open interest reflects the total number of derivative contracts entered by market participants but not yet settled. Consequently, it can serve as a measure of market activity and liquidity.
The indicator showcased here aims to analyze changes in the reported net values of open interest for commercial traders/hedgers (often referred to as 'smart money', as they deal directly in underlying commodities). The net values are positive when the commercial traders have more long positions than short ones and negative when they hold more short positions than long ones. Positive net values indicate that commercial traders hold more long positions than short ones, while negative values indicate the opposite. Thus, overbought and oversold conditions of the COT Commercials Indicator potentially suggest collective bullish and bearish sentiments, respectively.
█ CALCULATIONS
The calculations involve these steps:
1. Net open interest values are extracted from COT data using the LibraryCOT library provided by TradingView.
2. A fast stochastic indicator (%K) is then applied to normalize these net values.
The script also provides an option of calculating and plotting the indicator curve for noncommercial (speculators) open interest.

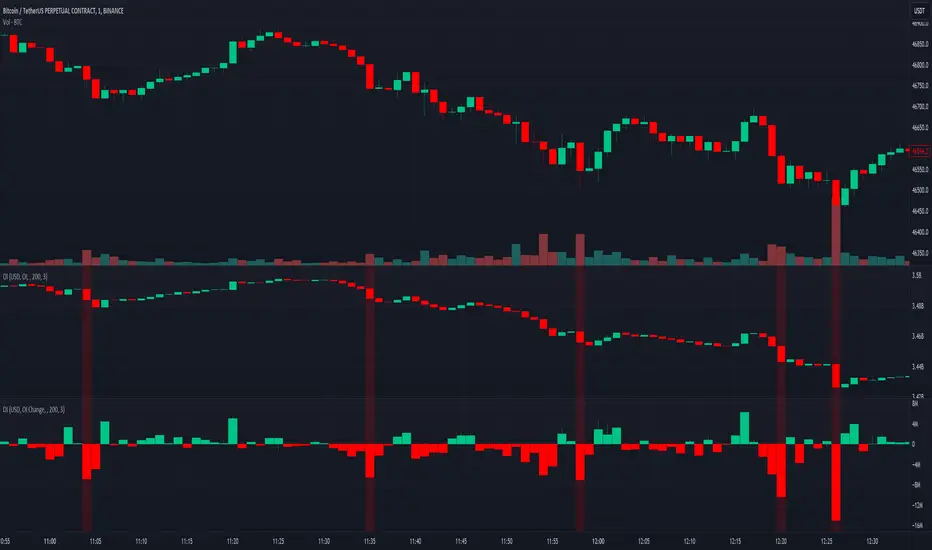
Crypto Open InterestPlots a crypto's open interest on Binance.
You can choose to see OI as asset-denominated (e.g. 1000 BTC), USD-denominated, or both.
How I usually interpret OI:
Price up, OI up = longs opened = bullish
Price up, OI down = shorts closed = bullish on HTF, or counter-trade on LTF
Price down, OI up = shorted opened = bearish
Price down, OI down = longs closed = bearish on HTF, or counter-trade on LTF
I find the indicator useful on 1-minute charts to identify liquidations and compare perp v.s. spot patterns.

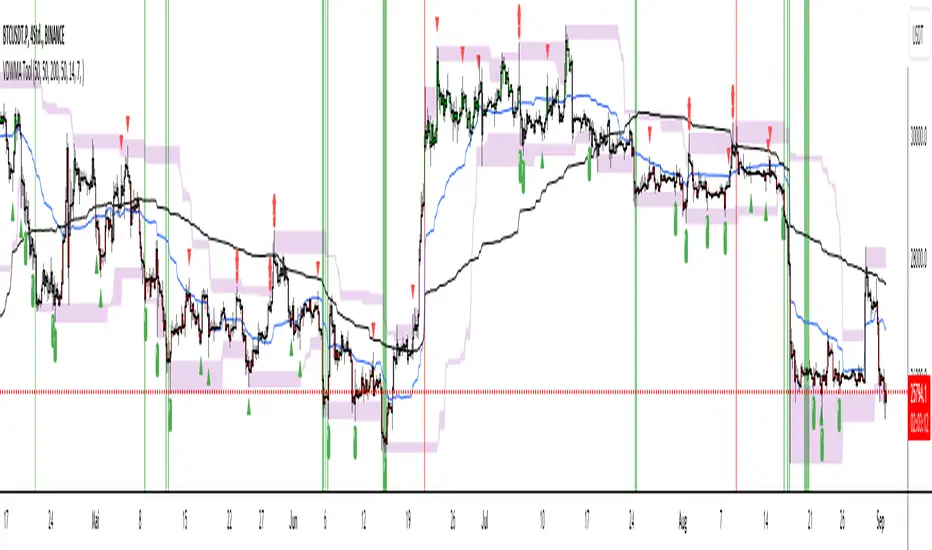
Trade Tool VDWMA + OI RSI BasedThis indicator works only for symbols where open interest data is available.
The idea was to create a combination of Volume Delta, Open Interest, RSI, Moving Average and Support / Resistance as a unified tool.
I created a Weighted Moving Average based on the Volume Delta (VDWMA). The idea behind this was to reflect the moving average on the difference between buy and sell volume.
There are two VDWMA to determine a trend. Fast and Slow. The principle is the same as with conventional moving averages. For visualization, the candles are colored based on the following logic:
up trend = Fast VDWMA is above the Slow VDWMA and the price is above the Fast VWDWMA.
down Trend = Fast VDWMA is below the Slow VDWMA and the Short is below the Fast VDWMA
Further, support and resistance zones were defined based on the close and high prices as well as close and low prices.
A simple logic looks for divergences between RSI and price to generate first signals for possible price reversals.
Another RSI was created based on the open interest.
In combination with the conventional RSI, oversold and overbought zones were defined based on the following logic, which are marked by vertical zones on the chart.
Oversold zone = RSI is below 30 and OI RSI is above 70 or below 30 and OI opening is not greater than OI closing price
Overbought zone = RSI is above 70 and OI RSI is above 70 or below 30 and OI opening is not smaller than OI closing price
Based on this, buy and sell signals were defined.
First, the support or resistance zone must remain the same for two candles, which signals that the zone has not been breached. In addition, a divergence must occur in the RSI and the price must bounce.
newsell = resistance == resistance and high >= resistance and close < resistance and bearishDiv
newbull = support == support and low <= support and close > support and bullishDiv
The OI signaling was deliberately not included as well as the trend function. The tool should be suitable for scalping as well as for swinging. Thus, depending on the tradestyle itself to decide which points you want to trade.
Have fun with it
Multi-Asset Performance [Spaghetti] - By LeviathanThis indicator visualizes the cumulative percentage changes or returns of 30 symbols over a given period and offers a unique set of tools and data analytics for deeper insight into the performance of different assets.
Multi Asset Performance indicator (also called “Spaghetti”) makes it easy to monitor the changes in Price, Open Interest, and On Balance Volume across multiple assets simultaneously, distinguish assets that are overperforming or underperforming, observe the relative strength of different assets or currencies, use it as a tool for identifying mean reversion opportunities and even for constructing pairs trading strategies, detect "risk-on" or "risk-off" periods, evaluate statistical relationships between assets through metrics like correlation and beta, construct hedging strategies, trade rotations and much more.
Start by selecting a time period (e.g., 1 DAY) to set the interval for when data is reset. This will provide insight into how price, open interest, and on-balance volume change over your chosen period. In the settings, asset selection is fully customizable, allowing you to create three groups of up to 30 tickers each. These tickers can be displayed in a variety of styles and colors. Additional script settings offer a range of options, including smoothing values with a Simple Moving Average (SMA), highlighting the top or bottom performers, plotting the group mean, applying heatmap/gradient coloring, generating a table with calculations like beta, correlation, and RSI, creating a profile to show asset distribution around the mean, and much more.
One of the most important script tools is the screener table, which can display:
🔸 Percentage Change (Represents the return or the percentage increase or decrease in Price/OI/OBV over the current selected period)
🔸 Beta (Represents the sensitivity or responsiveness of asset's returns to the returns of a benchmark/mean. A beta of 1 means the asset moves in tandem with the market. A beta greater than 1 indicates the asset is more volatile than the market, while a beta less than 1 indicates the asset is less volatile. For example, a beta of 1.5 means the asset typically moves 150% as much as the benchmark. If the benchmark goes up 1%, the asset is expected to go up 1.5%, and vice versa.)
🔸 Correlation (Describes the strength and direction of a linear relationship between the asset and the mean. Correlation coefficients range from -1 to +1. A correlation of +1 means that two variables are perfectly positively correlated; as one goes up, the other will go up in exact proportion. A correlation of -1 means they are perfectly negatively correlated; as one goes up, the other will go down in exact proportion. A correlation of 0 means that there is no linear relationship between the variables. For example, a correlation of 0.5 between Asset A and Asset B would suggest that when Asset A moves, Asset B tends to move in the same direction, but not perfectly in tandem.)
🔸 RSI (Measures the speed and change of price movements and is used to identify overbought or oversold conditions of each asset. The RSI ranges from 0 to 100 and is typically used with a time period of 14. Generally, an RSI above 70 indicates that an asset may be overbought, while RSI below 30 signals that an asset may be oversold.)
⚙️ Settings Overview:
◽️ Period
Periodic inputs (e.g. daily, monthly, etc.) determine when the values are reset to zero and begin accumulating again until the period is over. This visualizes the net change in the data over each period. The input "Visible Range" is auto-adjustable as it starts the accumulation at the leftmost bar on your chart, displaying the net change in your chart's visible range. There's also the "Timestamp" option, which allows you to select a specific point in time from where the values are accumulated. The timestamp anchor can be dragged to a desired bar via Tradingview's interactive option. Timestamp is particularly useful when looking for outperformers/underperformers after a market-wide move. The input positioned next to the period selection determines the timeframe on which the data is based. It's best to leave it at default (Chart Timeframe) unless you want to check the higher timeframe structure of the data.
◽️ Data
The first input in this section determines the data that will be displayed. You can choose between Price, OI, and OBV. The second input lets you select which one out of the three asset groups should be displayed. The symbols in the asset group can be modified in the bottom section of the indicator settings.
◽️ Appearance
You can choose to plot the data in the form of lines, circles, areas, and columns. The colors can be selected by choosing one of the six pre-prepared color palettes.
◽️ Labeling
This input allows you to show/hide the labels and select their appearance and size. You can choose between Label (colored pointed label), Label and Line (colored pointed label with a line that connects it to the plot), or Text Label (colored text).
◽️ Smoothing
If selected, this option will smooth the values using a Simple Moving Average (SMA) with a custom length. This is used to reduce noise and improve the visibility of plotted data.
◽️ Highlight
If selected, this option will highlight the top and bottom N (custom number) plots, while shading the others. This makes the symbols with extreme values stand out from the rest.
◽️ Group Mean
This input allows you to select the data that will be considered as the group mean. You can choose between Group Average (the average value of all assets in the group) or First Ticker (the value of the ticker that is positioned first on the group's list). The mean is then used in calculations such as correlation (as the second variable) and beta (as a benchmark). You can also choose to plot the mean by clicking on the checkbox.
◽️ Profile
If selected, the script will generate a vertical volume profile-like display with 10 zones/nodes, visualizing the distribution of assets below and above the mean. This makes it easy to see how many or what percentage of assets are outperforming or underperforming the mean.
◽️ Gradient
If selected, this option will color the plots with a gradient based on the proximity of the value to the upper extreme, zero, and lower extreme.
◽️ Table
This section includes several settings for the table's appearance and the data displayed in it. The "Reference Length" input determines the number of bars back that are used for calculating correlation and beta, while "RSI Length" determines the length used for calculating the Relative Strength Index. You can choose the data that should be displayed in the table by using the checkboxes.
◽️ Asset Groups
This section allows you to modify the symbols that have been selected to be a part of the 3 asset groups. If you want to change a symbol, you can simply click on the field and type the ticker of another one. You can also show/hide a specific asset by using the checkbox next to the field.

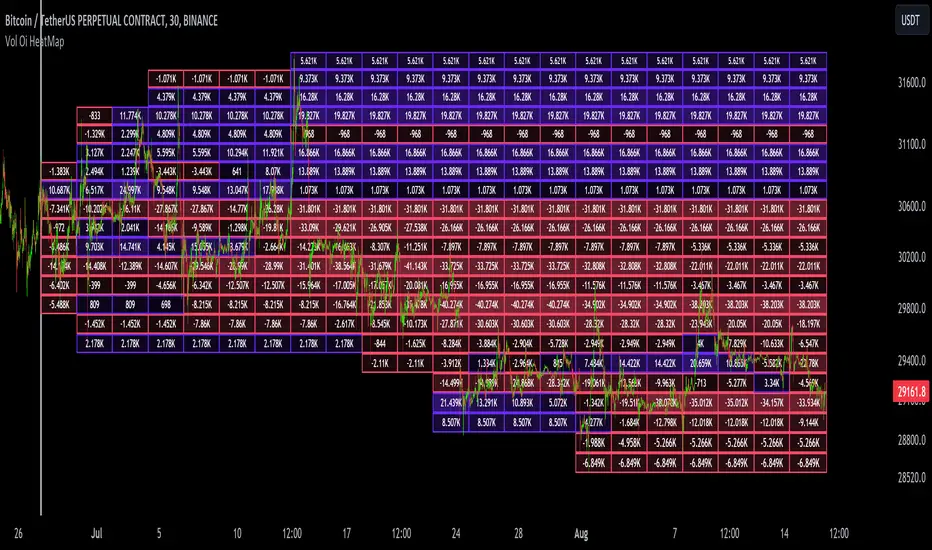
Dynamic Liquidity Map [Kioseff Trading]Hello!
Just a quick/fun project here: "Dynamic Heatmap".
This script draws a volume delta or open interest delta heatmap for the asset on your chart.
The adjective "Dynamic" is used for two reasons (:
1: Self-Adjusting Lower Timeframe Data
The script requests ~10 lower timeframe volume and open interest data sets.
When using the fixed range feature the script will, beginning at the start time, check the ~10 requested lower timeframes to see which of the lower timeframes has available data.
The script will always use the lowest timeframe available during the calculation period. As time continues, the script will continue to check if new lower timeframe data (lower than the currently used lowest timeframe) is available. This process repeats until bar time is close enough to the current time that 1-minute data can be retrieved.
The image above exemplifies the process.
Incrementally lower timeframe data will be used as it becomes available.
1: Fixed range capabilities
The script features a "fixed range" tool, where you can manually set a start time (or drag & drop a bar on the chart) to determine the interval the heatmap covers.
From the start date, the script will calculate the calculate the sub-intervals necessary to draw a rows x columns heatmap. Consequently, setting the start time further back will draw a heat map with larger rows x columns, whereas, a start time closer to the current bar time will draw a more "precise" heatmap with smaller rows x columns.
Additionally, the heatmap can be calculated using open interest data.
The image above shows the heatmap displaying open interest delta.
The image above shows alternative settings for the heatmap.
Delta values have been hidden alongside grid border colors. These settings can be replicated to achieve a more "traditional" feel for the heatmap.
Thanks for checking this out!
Market Sessions and TPO (+Forecast)This indicator "Market Sessions and TPO (+Forecast)" shows various market sessions alongside a TPO profile (presented as the traditional lettering system or as bars) and price forecast for the duration of the session.
Additionally, numerous statistics for the session are shown.
Features
Session open and close times presented in boxes
Session pre market and post market shown
TPO profile generated for each session (normal market hours only)
A forecast for the remained of the session is projected forward
Forecast can be augmented by ATR
Naked POCs remain on the chart until violated
Volume delta for the session shown
OI Change for the session shown (Binance sourced)
Total volume for the session shown
Price range for the session shown
The image above shows processes of the indicator.
Volume delta, OI change, total volume and session range are calculated and presented for each session.
Additionally, a TPO profile for the most recent session is shown, and a forecast for the remainder of the active session is shown.
The image above shows an alternative display method for the session forecast and TPO profile!
Additionally, the pre-market and post-market times are denoted by dashed boxes.
The image above exemplifies additional capabilities.
That's all for now; further updates to come and thank you for checking this out!
And a special thank you to @TradingView of course, for making all of this possible!
