Options Oscillator [Lite] IVRank, IVx, Call/Put Volatility Skew The first TradingView indicator that provides REAL IVRank, IVx, and CALL/PUT skew data based on REAL option chain for 5 U.S. market symbols.
🔃 Auto-Updating Option Metrics without refresh!
🍒 Developed and maintained by option traders for option traders.
📈 Specifically designed for TradingView users who trade options.
🔶 Ticker Information:
This 'Lite' indicator is currently only available for 5 liquid U.S. market smbols : NASDAQ:TSLA AMEX:DIA NASDAQ:AAPL NASDAQ:AMZN and NYSE:ORCL
🔶 How does the indicator work and why is it unique?
This Pine Script indicator is a complex tool designed to provide various option metrics and visualization tools for options market traders. The indicator extracts raw options data from an external data provider (ORATS), processes and refines the delayed data package using pineseed, and sends it to TradingView, visualizing the data using specific formulas (see detailed below) or interpolated values (e.g., delta distances). This method of incorporating options data into a visualization framework is unique and entirely innovative on TradingView.
The indicator aims to offer a comprehensive view of the current state of options for the implemented instruments, including implied volatility (IV), IV rank (IVR), options skew, and expected market movements, which are objectively measured as detailed below.
The options metrics we display may be familiar to options traders from various major brokerage platforms such as TastyTrade, IBKR, TOS, Tradier, TD Ameritrade, Schwab, etc.
🟨 The following data is displayed in the oscillator 🟨
We use Tastytrade formulas, so our numbers mostly align with theirs!
🔶 𝗜𝗩𝗥𝗮𝗻𝗸
The Implied Volatility Rank (IVR) helps options traders assess the current level of implied volatility (IV) in comparison to the past 52 weeks. IVR is a useful metric to determine whether options are relatively cheap or expensive. This can guide traders on whether to buy or sell options.
IV Rank formula = (current IV - 52 week IV low) / (52 week IV high - 52 week IV low)
IVRank is default blue and you can adjust their settings:
🔶 𝗜𝗩𝘅 𝗮𝘃𝗴
The implied volatility (IVx) shown in the option chain is calculated like the VIX. The Cboe uses standard and weekly SPX options to measure expected S&P 500 volatility. A similar method is used for calculating IVx for each expiration cycle.
We aggregate the IVx values for the 35-70 day monthly expiration cycle, and use that value in the oscillator and info panel.
We always display which expiration the IVx values are averaged for when you hover over the IVx cell.
IVx main color is purple, but you can change the settings:
🔹IVx 5 days change %
We are also displaying the five-day change of the IV Index (IVx value). The IV Index 5-Day Change column provides quick insight into recent expansions or decreases in implied volatility over the last five trading days.
Traders who expect the value of options to decrease might view a decrease in IVX as a positive signal. Strategies such as Strangle and Ratio Spread can benefit from this decrease.
On the other hand, traders anticipating further increases in IVX will focus on the rising IVX values. Strategies like Calendar Spread or Diagonal Spread can take advantage of increasing implied volatility.
This indicator helps traders quickly assess changes in implied volatility, enabling them to make informed decisions based on their trading strategies and market expectations.
Important Note:
The IVx value alone does not provide sufficient context. There are stocks that inherently exhibit high IVx values. Therefore, it is crucial to consider IVx in conjunction with the Implied Volatility Rank (IVR), which measures the IVx relative to its own historical values. This combined view helps in accurately assessing the significance of the IVx in relation to the specific stock's typical volatility behavior.
This indicator offers traders a comprehensive view of implied volatility, assisting them in making informed decisions by highlighting both the absolute and relative volatility measures.
🔶 𝗖𝗔𝗟𝗟/𝗣𝗨𝗧 𝗣𝗿𝗶𝗰𝗶𝗻𝗴 𝗦𝗸𝗲𝘄 𝗵𝗶𝘀𝘁𝗼𝗴𝗿𝗮𝗺
At TanukiTrade, Vertical Pricing Skew refers to the difference in pricing between put and call options with the same expiration date at the same distance (at tastytrade binary expected move). We analyze this skew to understand market sentiment. This is the same formula used by TastyTrade for calculations.
We calculate the interpolated strike price based on the expected move, taking into account the neighboring option prices and their distances. This allows us to accurately determine whether the CALL or PUT options are more expensive.
🔹 What Causes Pricing Skew? The Theory Behind It
The asymmetric pricing of PUT and CALL options is driven by the natural dynamics of the market. The theory is that when CALL options are more expensive than PUT options at the same distance from the current spot price, market participants are buying CALLs and selling PUTs, expecting a faster upward movement compared to a downward one .
In the case of PUT skew, it's the opposite: participants are buying PUTs and selling CALLs , as they expect a potential downward move to happen more quickly than an upward one.
An options trader can take advantage of this phenomenon by leveraging PUT pricing skew. For example, if they have a bullish outlook and both IVR and IVx are high and IV started decreasing, they can capitalize on this PUT skew with strategies like a jade lizard, broken wing butterfly, or short put.
🔴 PUT Skew 🔴
Put options are more expensive than call options, indicating the market expects a faster downward move (▽). This alone doesn't indicate which way the market will move (because nobody knows that), but the options chain pricing suggests that if the market moves downward, it could do so faster in velocity compared to a potential upward movement.
🔹 SPY PUT SKEW example:
If AMEX:SPY PUT option prices are 46% higher than CALLs at the same distance for the optimal next monthly expiry (DTE). This alone doesn't indicate which way the market will move (because nobody knows that), but the options chain pricing suggests that if the market moves downward, it could do so 46% faster in velocity compared to a potential upward movement
🟢 CALL Skew 🟢
Call options are more expensive than put options, indicating the market expects a faster upward move (△). This alone doesn't indicate which way the market will move (because nobody knows that), but the options chain pricing suggests that if the market moves upward, it could do so faster in velocity compared to a potential downward movement.
🔹 INTC CALL SKEW example:
If NASDAQ:INTC CALL option prices are 49% higher than PUTs at the same distance for the optimal next monthly expiry (DTE). This alone doesn't indicate which way the market will move (because nobody knows that), but the options chain pricing suggests that if the market moves upward, it could do so 49% faster in velocity compared to a potential downward movement .
🔶 USAGE example:
The script is compatible with our other options indicators.
For example: Since the main metrics are already available in this Options Oscillator, you can hide the main IVR panel of our Options Overlay indicator, freeing up more space on the chart. The following image shows this:
🔶 ADDITIONAL IMPORTANT COMMENTS
🔹 Historical Data:
Yes, we only using historical internal metrics dating back to 2024-07-01, when the TanukiTrade options brand launched. For now, we're using these, but we may expand the historical data in the future.
🔹 What distance does the indicator use to measure the call/put pricing skew?:
It is important to highlight that this oscillator displays the call/put pricing skew changes for the next optimal monthly expiration on a histogram.
The Binary Expected Move distance is calculated using the TastyTrade method for the next optimal monthly expiration: Formula = (ATM straddle price x 0.6) + (1st OTM strangle price x 0.3) + (2nd OTM strangle price x 0.1)
We interpolate the exact difference based on the neighboring strikes at the binary expected move distance using the TastyTrade method, and compare the interpolated call and put prices at this specific point.
🔹 - Why is there a slight difference between the displayed data and my live brokerage data?
There are two reasons for this, and one is beyond our control.
◎ Option-data update frequency:
According to TradingView's regulations and guidelines, we can update external data a maximum of 5 times per day. We strive to use these updates in the most optimal way:
(1st update) 15 minutes after U.S. market open
(2nd, 3rd, 4th updates) 1.5–3 hours during U.S. market open hours
(5th update) 10 minutes before U.S. market close.
You don’t need to refresh your window, our last refreshed data-pack is always automatically applied to your indicator, and you can see the time elapsed since the last update at the bottom of the corner on daily TF.
◎ Brokerage Calculation Differences:
Every brokerage has slight differences in how they calculate metrics like IV and IVx. If you open three windows for TOS, TastyTrade, and IBKR side by side, you will notice that the values are minimally different. We had to choose a standard, so we use the formulas and mathematical models described by TastyTrade when analyzing the options chain and drawing conclusions.
🔹 - EOD data:
The indicator always displays end-of-day (EOD) data for IVR, IV, and CALL/PUT pricing skew. During trading hours, it shows the current values for the ongoing day with each update, and at market close, these values become final. From that point on, the data is considered EOD, provided the day confirms as a closed daily candle.
🔹 - U.S. market only:
Since we only deal with liquid option chains: this option indicator only works for the USA options market and do not include future contracts; we have implemented each selected symbol individually.
Disclaimer:
Our option indicator uses approximately 15min-3 hour delayed option market snapshot data to calculate the main option metrics. Exact realtime option contract prices are never displayed; only derived metrics and interpolated delta are shown to ensure accurate and consistent visualization. Due to the above, this indicator can only be used for decision support; exclusive decisions cannot be made based on this indicator. We reserve the right to make errors.This indicator is designed for options traders who understand what they are doing. It assumes that they are familiar with options and can make well-informed, independent decisions. We work with public data and are not a data provider; therefore, we do not bear any financial or other liability.
Optionstrading
Options Oscillator [PRO] IVRank, IVx, Call/Put Volatility Skew𝗧𝗵𝗲 𝗳𝗶𝗿𝘀𝘁 𝗧𝗿𝗮𝗱𝗶𝗻𝗴𝗩𝗶𝗲𝘄 𝗶𝗻𝗱𝗶𝗰𝗮𝘁𝗼𝗿 𝘁𝗵𝗮𝘁 𝗽𝗿𝗼𝘃𝗶𝗱𝗲𝘀 𝗥𝗘𝗔𝗟 𝗜𝗩𝗥𝗮𝗻𝗸, 𝗜𝗩𝘅, 𝗮𝗻𝗱 𝗖𝗔𝗟𝗟/𝗣𝗨𝗧 𝘀𝗸𝗲𝘄 𝗱𝗮𝘁𝗮 𝗯𝗮𝘀𝗲𝗱 𝗼𝗻 𝗥𝗘𝗔𝗟 𝗼𝗽𝘁𝗶𝗼𝗻 𝗰𝗵𝗮𝗶𝗻 𝗳𝗼𝗿 𝗼𝘃𝗲𝗿 𝟭𝟲𝟱+ 𝗺𝗼𝘀𝘁 𝗹𝗶𝗾𝘂𝗶𝗱 𝗨.𝗦. 𝗺𝗮𝗿𝗸𝗲𝘁 𝘀𝘆𝗺𝗯𝗼𝗹𝘀
🔃 Auto-Updating Option Metrics without refresh!
🍒 Developed and maintained by option traders for option traders.
📈 Specifically designed for TradingView users who trade options.
🔶 Ticker Information:
This indicator is currently only available for over 165+ most liquid U.S. market symbols (eg. SP:SPX AMEX:SPY NASDAQ:QQQ NASDAQ:TLT NASDAQ:NVDA , etc.. ), and we are continuously expanding the compatible watchlist here: www.tradingview.com
🔶 How does the indicator work and why is it unique?
This Pine Script indicator is a complex tool designed to provide various option metrics and visualization tools for options market traders. The indicator extracts raw options data from an external data provider (ORATS), processes and refines the delayed data package using pineseed, and sends it to TradingView, visualizing the data using specific formulas (see detailed below) or interpolated values (e.g., delta distances). This method of incorporating options data into a visualization framework is unique and entirely innovative on TradingView.
The indicator aims to offer a comprehensive view of the current state of options for the implemented instruments, including implied volatility (IV), IV rank (IVR), options skew, and expected market movements, which are objectively measured as detailed below.
The options metrics we display may be familiar to options traders from various major brokerage platforms such as TastyTrade, IBKR, TOS, Tradier, TD Ameritrade, Schwab, etc.
🟨 The following data is displayed in the oscillator 🟨
We use Tastytrade formulas, so our numbers mostly align with theirs!
🔶 𝗜𝗩𝗥𝗮𝗻𝗸
The Implied Volatility Rank (IVR) helps options traders assess the current level of implied volatility (IV) in comparison to the past 52 weeks. IVR is a useful metric to determine whether options are relatively cheap or expensive. This can guide traders on whether to buy or sell options.
IV Rank formula = (current IV - 52 week IV low) / (52 week IV high - 52 week IV low)
IVRank is default blue and you can adjust their settings:
🔶 𝗜𝗩𝘅 𝗮𝘃𝗴
The implied volatility (IVx) shown in the option chain is calculated like the VIX. The Cboe uses standard and weekly SPX options to measure expected S&P 500 volatility. A similar method is used for calculating IVx for each expiration cycle.
We aggregate the IVx values for the 35-70 day monthly expiration cycle, and use that value in the oscillator and info panel.
We always display which expiration the IVx values are averaged for when you hover over the IVx cell.
IVx main color is purple, but you can change the settings:
🔹 IVx 5 days change %
We are also displaying the five-day change of the IV Index (IVx value). The IV Index 5-Day Change column provides quick insight into recent expansions or decreases in implied volatility over the last five trading days.
Traders who expect the value of options to decrease might view a decrease in IVX as a positive signal. Strategies such as Strangle and Ratio Spread can benefit from this decrease.
On the other hand, traders anticipating further increases in IVX will focus on the rising IVX values. Strategies like Calendar Spread or Diagonal Spread can take advantage of increasing implied volatility.
This indicator helps traders quickly assess changes in implied volatility, enabling them to make informed decisions based on their trading strategies and market expectations.
Important Note:
The IVx value alone does not provide sufficient context. There are stocks that inherently exhibit high IVx values. Therefore, it is crucial to consider IVx in conjunction with the Implied Volatility Rank (IVR), which measures the IVx relative to its own historical values. This combined view helps in accurately assessing the significance of the IVx in relation to the specific stock's typical volatility behavior.
This indicator offers traders a comprehensive view of implied volatility, assisting them in making informed decisions by highlighting both the absolute and relative volatility measures.
🔶 𝗖𝗔𝗟𝗟/𝗣𝗨𝗧 𝗣𝗿𝗶𝗰𝗶𝗻𝗴 𝗦𝗸𝗲𝘄 𝗵𝗶𝘀𝘁𝗼𝗴𝗿𝗮𝗺
At TanukiTrade, Vertical Pricing Skew refers to the difference in pricing between put and call options with the same expiration date at the same distance (at tastytrade binary expected move). We analyze this skew to understand market sentiment. This is the same formula used by TastyTrade for calculations.
We calculate the interpolated strike price based on the expected move, taking into account the neighboring option prices and their distances. This allows us to accurately determine whether the CALL or PUT options are more expensive.
🔹 What Causes Pricing Skew? The Theory Behind It
The asymmetric pricing of PUT and CALL options is driven by the natural dynamics of the market. The theory is that when CALL options are more expensive than PUT options at the same distance from the current spot price, market participants are buying CALLs and selling PUTs, expecting a faster upward movement compared to a downward one .
In the case of PUT skew, it's the opposite: participants are buying PUTs and selling CALLs , as they expect a potential downward move to happen more quickly than an upward one.
An options trader can take advantage of this phenomenon by leveraging PUT pricing skew. For example, if they have a bullish outlook and both IVR and IVx are high and IV started decreasing, they can capitalize on this PUT skew with strategies like a jade lizard, broken wing butterfly, or short put.
🔴 PUT Skew 🔴
Put options are more expensive than call options, indicating the market expects a faster downward move (▽). This alone doesn't indicate which way the market will move (because nobody knows that), but the options chain pricing suggests that if the market moves downward, it could do so faster in velocity compared to a potential upward movement.
🔹 SPY PUT SKEW example:
If AMEX:SPY PUT option prices are 46% higher than CALLs at the same distance for the optimal next monthly expiry (DTE). This alone doesn't indicate which way the market will move (because nobody knows that), but the options chain pricing suggests that if the market moves downward, it could do so 46% faster in velocity compared to a potential upward movement
🟢 CALL Skew 🟢
Call options are more expensive than put options, indicating the market expects a faster upward move (△). This alone doesn't indicate which way the market will move (because nobody knows that), but the options chain pricing suggests that if the market moves upward, it could do so faster in velocity compared to a potential downward movement.
🔹 INTC CALL SKEW example:
If NASDAQ:INTC CALL option prices are 49% higher than PUTs at the same distance for the optimal next monthly expiry (DTE). This alone doesn't indicate which way the market will move (because nobody knows that), but the options chain pricing suggests that if the market moves upward, it could do so 49% faster in velocity compared to a potential downward movement .
🔶 USAGE example:
The script is compatible with our other options indicators.
For example: Since the main metrics are already available in this Options Oscillator, you can hide the main IVR panel of our Options Overlay indicator, freeing up more space on the chart. The following image shows this:
🔶 ADDITIONAL IMPORTANT COMMENTS
🔹 Historical Data:
Yes, we only using historical internal metrics dating back to 2024-07-01, when the TanukiTrade options brand launched. For now, we're using these, but we may expand the historical data in the future.
🔹 What distance does the indicator use to measure the call/put pricing skew?:
It is important to highlight that this oscillator displays the call/put pricing skew changes for the next optimal monthly expiration on a histogram.
The Binary Expected Move distance is calculated using the TastyTrade method for the next optimal monthly expiration: Formula = (ATM straddle price x 0.6) + (1st OTM strangle price x 0.3) + (2nd OTM strangle price x 0.1)
We interpolate the exact difference based on the neighboring strikes at the binary expected move distance using the TastyTrade method, and compare the interpolated call and put prices at this specific point.
🔹 - Why is there a slight difference between the displayed data and my live brokerage data?
There are two reasons for this, and one is beyond our control.
◎ Option-data update frequency:
According to TradingView's regulations and guidelines, we can update external data a maximum of 5 times per day. We strive to use these updates in the most optimal way:
(1st update) 15 minutes after U.S. market open
(2nd, 3rd, 4th updates) 1.5–3 hours during U.S. market open hours
(5th update) 10 minutes before U.S. market close.
You don’t need to refresh your window, our last refreshed data-pack is always automatically applied to your indicator, and you can see the time elapsed since the last update at the bottom of the corner on daily TF.
◎ Brokerage Calculation Differences:
Every brokerage has slight differences in how they calculate metrics like IV and IVx. If you open three windows for TOS, TastyTrade, and IBKR side by side, you will notice that the values are minimally different. We had to choose a standard, so we use the formulas and mathematical models described by TastyTrade when analyzing the options chain and drawing conclusions.
🔹 - EOD data:
The indicator always displays end-of-day (EOD) data for IVR, IV, and CALL/PUT pricing skew. During trading hours, it shows the current values for the ongoing day with each update, and at market close, these values become final. From that point on, the data is considered EOD, provided the day confirms as a closed daily candle.
🔹 - U.S. market only:
Since we only deal with liquid option chains: this option indicator only works for the USA options market and do not include future contracts; we have implemented each selected symbol individually.
Disclaimer:
Our option indicator uses approximately 15min-3 hour delayed option market snapshot data to calculate the main option metrics. Exact realtime option contract prices are never displayed; only derived metrics and interpolated delta are shown to ensure accurate and consistent visualization. Due to the above, this indicator can only be used for decision support; exclusive decisions cannot be made based on this indicator. We reserve the right to make errors.This indicator is designed for options traders who understand what they are doing. It assumes that they are familiar with options and can make well-informed, independent decisions. We work with public data and are not a data provider; therefore, we do not bear any financial or other liability.

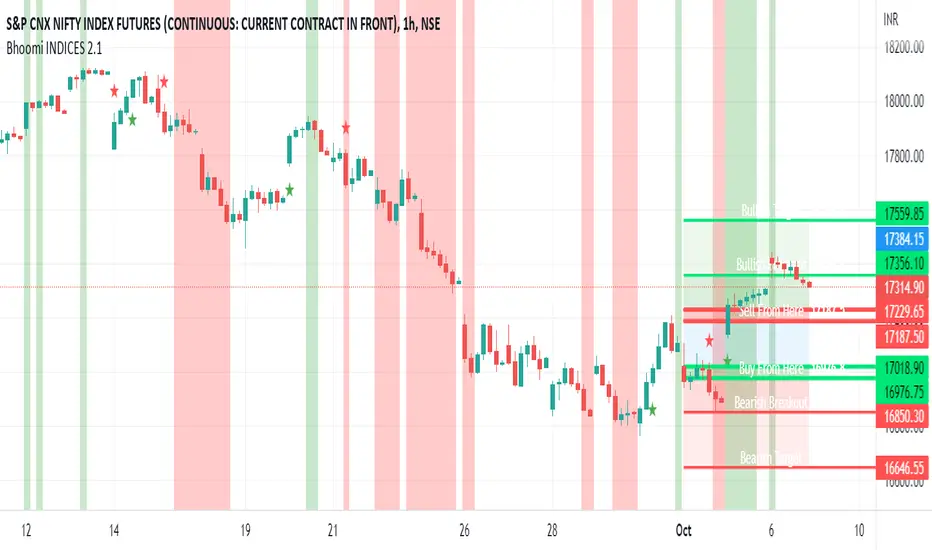
Rolling Straddle PremiumScript is Basically intended to provide insight's on the Rolling Straddle premium for the selected index based on the input settings.
Important thing to consider for the script to work seamlessly:
Specify the LTP in the input field (need not be very accurate)
Specify the Expiry Date for the Option Strike.
Ensure Profile matches to the chart script (Index Script)
Note: Zones marked in Blue, is the max level that indicator can track the option prices. beyond which it may fail to track, during such time consider reloading the indicator with Latest LTP .
Labels on the chart indicate that If i had shorted the Straddle, what would be my current position of that Straddle. however the rational behind shorting is only the pivot high points (not sure if this is right or wrong! )
Note On Labels: Labels are delayed basis the pivot point candles specified in the indicator settings.
EN: Entry Price (Straddle Premium) of the Strike Specified.
Cur: Current Price ( Current Straddle Premium ) of the Strike Specified.
SH: Max Straddle Premium ( Increase in Premium ) since position is active.
SL: Min Straddle Premium ( Premium Erosion ) since position is active.
Sniper Entry Indicator, Crypto, Forex, Indices, I ndicator Description:
Momentum & Sideways Market Detector is a powerful TradingView indicator that combines the strengths of RSI (Relative Strength Index) and Moving Averages to identify market momentum and detect sideways movements. This versatile tool is designed to work effectively across various asset classes, including Cryptocurrencies, Forex pairs, Gold, and major stock indices like Nifty, BankNifty, Finifty, and Midcap.
Key Features:
Momentum Detection: The indicator uses RSI to gauge market momentum, highlighting overbought and oversold conditions to signal potential reversals by Displaying strength on the chart, above 90 it will be overbought and check for reversal trade, below 10 it will be oversold and check for the long opportunity.
Sideways Market Identification: It utilizes a combination of Moving Averages to detect low-volatility periods and sideways market conditions, helping traders avoid choppy markets. Area or label highlighted by blue means it is sideways, you can ignore entries in this zone.
Multi-Asset Compatibility: The indicator is optimized to perform well on diverse asset classes, including Crypto, Forex, Commodities, and Equity Indices, making it a versatile tool for traders of all types. It is compatible with Indian indices as well giving trader opportunity to see live trade with strike price entry and sl. It also trails the SL when reached the first target.
Customizable Parameters: Users can adjust RSI and Moving Average settings to suit their trading style and timeframe preferences.
Settings:
Stock/Option (Whether you want to trade Sport or it's option, if unchecked it will look for expiry of the stock option, month, and year, user also needs to provide the call and put option)
Spot Symbol (I have provided some of the spot symbols for the selection which will help him to configure it's F&O )
Backtest Day (User can backtest the data by changing the day to previous lookback, it is a very good feature to test the results.)
Remove lines from the table (If table is too long, i have provided the option to remove some of the lines from the table, provide number to remove the lines)
This indicator is a must-have for traders looking to enhance their strategy by accurately identifying market conditions and adapting their trades accordingly.

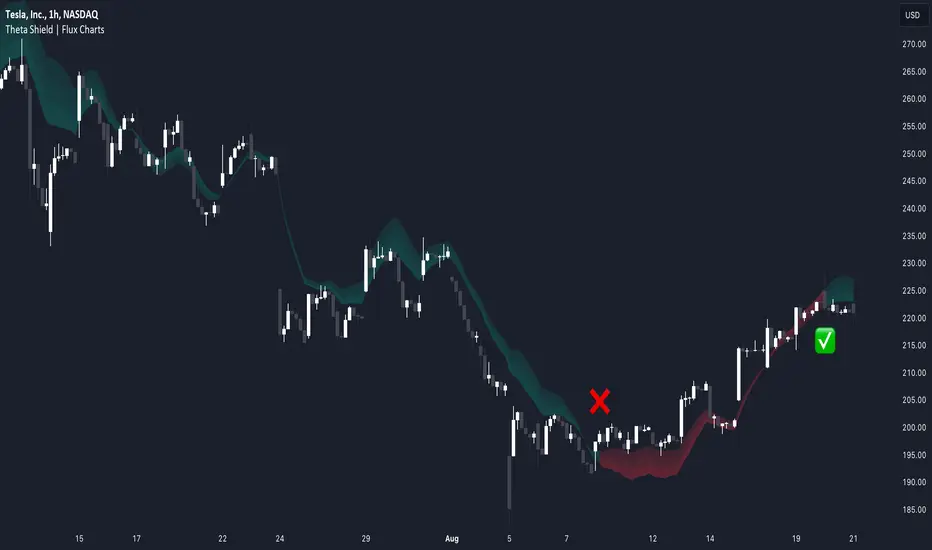
Theta Shield | Flux Charts💎 GENERAL OVERVIEW
Introducing our new Theta Shield indicator! Theta is the options risk factor concerning how fast there is a decline in the value of an option over time. This indicator aims to help the trader avoid sideways market phases in the current ticker, to minimize the risk of theta decay. For more information, please check the "How Does It Work" section.
Features of the new Theta Shield Indicator :
Foresight Of Accumulation Zones
Decrease Risk Of Theta Decay
Clear "Valid" & "Non-Valid" Signals
Validness Trail
Alerts
📌 HOW DOES IT WORK ?
In options trading, theta is defined as the rate of decline in the value of an option due to the passage of time. Traders want to avoid this kind of decay in the value of an option. One of the best ways to avoid it is not holding an option contract when the market is going sideways. This indicator uses a stochastic oscillator to try to get a foresight of sideways markets, warning the trader to not hold an option contract while the price is in a range.
The indicator starts by calculating the stochastic value using close, high & low prices of the candlesticks. Then a stoch threshold & a theta length are determined depending on the option contract type defined by the user in the settings of the indicator. Each candlestick that falls above or below the stoch threshold value is counted, and a "theta valid strength" is calculated using the counted candlesticks, which has a value between -100 & 100. Here is the formula of the "theta valid strength" value :
f_lin_interpolate(float x0, float x1, float y0, float y1, float x) =>
y0 + (x - x0) * (y1 - y0) / (x1 - x0)
thetaValid = Total Candlesticks That Fall Above & Below The Threshold In Last "Theta Length" bars.
thetaValidStrength = f_lin_interpolate(0, thetaLength, -100, 100, thetaValid)
Then a trail is rendered, and "Valid" & "Non-Valid" signals are given using this freshly calculated strength value. Valid means that the indicator currently thinks that no accumulation will happen in the near future, so the option positions in the current ticker are protected from the theta decay. Non-Valid means that the indicator thinks the ticker has entered the accumulation phase, so holding any option position is not recommended, as they may be affected by the theta decay.
🚩 UNIQUENESS
This indicator offers a unique way to avoid theta decay in options trading. It uses a stochastic oscillator and thresholds to calculate a "theta strength" value, which is used for rendering validness signals and a trail. Traders can follow the valid & non-valid signals when deciding to hold their options position or not. The indicator also has an alerts feature, so you can get notified when a ticker is about to enter a range, or when it's about to get out of it.
⚙️ SETTINGS
1. General Configuration
Contract Type -> You can set the option contract type here. The indicator will adjust itself to get a better foresight depending on the contract length.
2. Style
Fill Validness -> Will render a trail based on "theta strength" value.
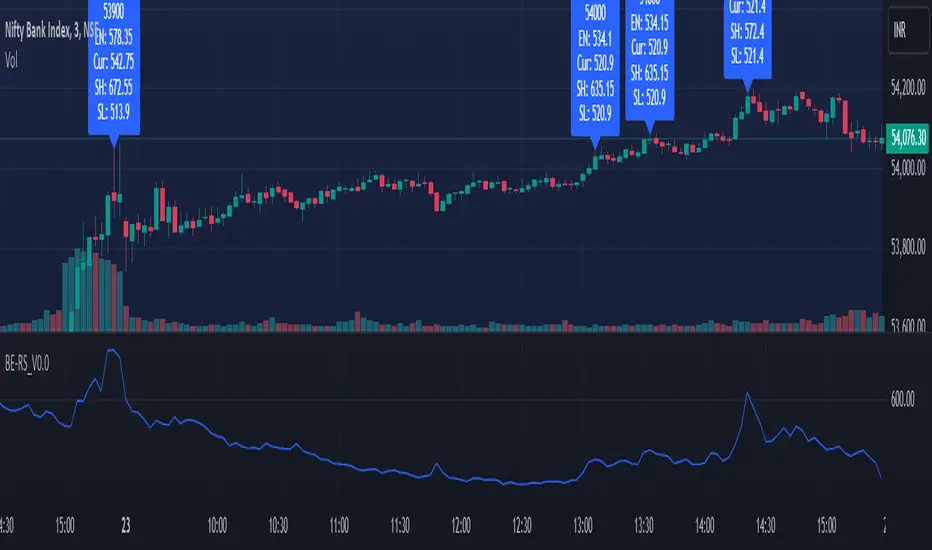
BE-NSE-Distributed Straddle Intraday Trading StrategyHerewith publishing the script (not the Indicator!) for the benift of Option Traders. I call this a script as this doesn't perform any kind of analysis of candle data and provide general BUY | SELL information. This Script is based on the TRUE VALUES concept which is nothing but LTP.
Idea Behind this Script:
As an option seller i need the lower risk option premium to trade. so that, time can work in our favor. basic question which we get at the first is which option to choose out of many available.
If traders feel the question is apt then this script is for them.
Logic Behind this script:
Upon Market Open, script in the BACKEND ( Under the hood ) deployes 60 possible combinations of STRADDLES for sampling, and continue to monitor the LTP movements and compares it against opposite pairs. lets say out of 30 Straddle options one of the Straddle it picked is ATM CE VS ATM PE. for 1 rs move in underlying how much impact is happening in CE VS PE.
This simple anlysis is done at every 30 seconds. once the Analysis is complete it picks 4 options 2 on the CALL side and 2 on the PUT side, which script feels the movement of prices are smooth. SMOOTH refers that time decay that can work in our favor..
Calculations behid the script:
lets say BNF LTP is 52000 at 9:20 AM, and one of the pair script took for sampling was ATM CE vs PE which are having the LTP of 100 each.
At 9:35 AM, BNF is trading at 52075, and ATM CE is reading the LTP of 122 and ATM PUT is reading the LTP of 70. ideally LTP of Call should be around 135 and Put should be around 65 considering the usual delta of 0.48 . Net Money Index for this Pair Sample is 8
Call Side => 100 - 122 = -22
Put Side => 100 - 70 = 30
Money Index => 30 - 22 = 8 for 15 Min
This Money index is calculated across choosen samples and the Option strikes is provided as an output which has mere possiblity of working in Options Seller's favor.
How to Read the Output:
For the choosen strikes from the time of Entry (Suggested Entry time by script) till the current time, the bottom pane plots the Money index as columns. Green Columns indicate that how much option premium eroded due to time decay. Red Columns indicate that how much Option premium increased during the time.
Note: Script dynamically calculate the strikes and suggests in realtime.
WARNING or a Humble Request:
For those who don't understand the word "Repaint" how it works in Pine Script. plz don't consider using this script. For those who wish to understand I have kept the Observer mode in the settings which shall guide you on why the Money Index shown on the chart when the MARKET IS CLOSED is different than when the MARKET IS OPEN (Realtime).
Disclaimer:
I have tested the script only in BNF and not sure if this works on Nifty, FinNifty or others. you may still try and plz do provide the feedback for improvising the script.
----- BreathEasy --------
The information contained in my scripts/indicators/ideas does not constitute financial advice or a solicitation to buy or sell any securities of any type. I will not accept liability for any loss or damage, including without limitation any loss of profit, which may arise directly or indirectly from the use of or reliance on such information.
All investments involve risk, and the past performance of a security, industry, sector, market, financial product, trading strategy, or individual’s trading does not guarantee future results or returns. Investors are fully responsible for any investment decisions they make. Such decisions should be based solely on an evaluation of their financial circumstances, investment objectives, risk tolerance, and liquidity needs.
My scripts/indicators/ideas are only for educational purposes!
Options Overlay [Pro] IVR IV Skew Delta Exp.mv MurreyMath Expiry
𝗧𝗵𝗲 𝗳𝗶𝗿𝘀𝘁 𝗿𝗲𝗮𝗹 𝗼𝗽𝘁𝗶𝗼𝗻𝘀 𝗱𝗮𝘁𝗮 𝗶𝗻𝗱𝗶𝗰𝗮𝘁𝗼𝗿 𝗼𝗻 𝗧𝗿𝗮𝗱𝗶𝗻𝗴𝗩𝗶𝗲𝘄, 𝗮𝘃𝗮𝗶𝗹𝗮𝗯𝗹𝗲 𝗳𝗼𝗿 𝗼𝘃𝗲𝗿 𝟭𝟱𝟬+ 𝗹𝗶𝗾𝘂𝗶𝗱 𝗨𝗦 𝗺𝗮𝗿𝗸𝗲𝘁 𝘀𝘆𝗺𝗯𝗼𝗹𝘀.
🔃 Auto-Updating Option Metrics without refresh!
🍒 Developed and maintained by option traders for option traders.
📈 Specifically designed for TradingView users who trade options.
Our indicator provides essential key metrics such as:
✅ IVRank
✅ IVx
✅ 5-Day IVx Change
✅ Delta curves and interpolated distances
✅ Expected move curve
✅ Standard deviation (STD1) curve
✅ Vertical Pricing Skew
✅ Horizontal IVx Skew
✅ Delta Skew
like TastyTrade, TOS, IBKR etc, but in a much more visually intuitive way. See detailed descriptions below.
If this isn't enough, we also include a unique grid system designed specifically for options traders. This package features our innovative dynamic grid system:
✅ Enhanced Murrey Math levels (horizontal scale)
✅ Options expirations (vertical scale)
Designed to help you assess market conditions and make well-informed trading decisions, this tool is an essential addition for every serious options trader!
Ticker Information:
This indicator is currently implemented for more than 150 liquid US market tickers and we are continuously expanding the list:
SP:SPX AMEX:SPY NASDAQ:QQQ NASDAQ:TLT AMEX:GLD
NYSE:AA NASDAQ:AAL NASDAQ:AAPL NYSE:ABBV NASDAQ:ABNB NASDAQ:AMD NASDAQ:AMZN AMEX:ARKK NASDAQ:AVGO NYSE:AXP NYSE:BA NYSE:BABA NYSE:BAC NASDAQ:BIDU AMEX:BITO NYSE:BMY NYSE:BP NASDAQ:BYND NYSE:C NYSE:CAT NYSE:CCJ NYSE:CCL NASDAQ:COIN NYSE:COP NASDAQ:COST NYSE:CRM NASDAQ:CRWD NASDAQ:CSCO NYSE:CVNA NYSE:CVS NYSE:CVX NYSE:DAL NASDAQ:DBX AMEX:DIA NYSE:DIS NASDAQ:DKNG NASDAQ:EBAY NASDAQ:ETSY NASDAQ:EXPE NYSE:F NYSE:FCX NYSE:FDX AMEX:FXI AMEX:GDX AMEX:GDXJ NYSE:GE NYSE:GM NYSE:GME NYSE:GOLD NASDAQ:GOOG NASDAQ:GOOGL NYSE:GPS NYSE:GS NASDAQ:HOOD NYSE:IBM NASDAQ:IEF NASDAQ:INTC AMEX:IWM NASDAQ:JD NYSE:JNJ NYSE:JPM NYSE:JWN NYSE:KO NYSE:LLY NYSE:LOW NYSE:LVS NYSE:MA NASDAQ:MARA NYSE:MCD NYSE:MET NASDAQ:META NYSE:MGM NYSE:MMM NYSE:MPC NYSE:MRK NASDAQ:MRNA NYSE:MRO NASDAQ:MRVL NYSE:MS NASDAQ:MSFT AMEX:MSOS NYSE:NCLH NASDAQ:NDX NYSE:NET NASDAQ:NFLX NYSE:NIO NYSE:NKE NASDAQ:NVDA NASDAQ:ON NYSE:ORCL NYSE:OXY NASDAQ:PEP NYSE:PFE NYSE:PINS NYSE:PLTR NASDAQ:PTON NASDAQ:PYPL NASDAQ:QCOM NYSE:RBLX NYSE:RCL NASDAQ:RIOT NASDAQ:RIVN NASDAQ:ROKU NASDAQ:SBUX NYSE:SHOP AMEX:SLV NASDAQ:SMCI NASDAQ:SMH NYSE:SNAP NYSE:SQ NYSE:T NYSE:TGT NASDAQ:TQQQ NASDAQ:TSLA NYSE:TSM NASDAQ:TTD NASDAQ:TXN NYSE:U NASDAQ:UAL NYSE:UBER AMEX:UNG NYSE:UPS NASDAQ:UPST AMEX:USO NYSE:V AMEX:VXX NYSE:VZ NASDAQ:WBA NYSE:WFC NYSE:WMT NASDAQ:WYNN NYSE:X AMEX:XHB AMEX:XLE AMEX:XLF AMEX:XLI AMEX:XLK AMEX:XLP AMEX:XLU AMEX:XLV AMEX:XLY NYSE:XOM NYSE:XPEV CBOE:XSP NASDAQ:ZM
How does the indicator work and why is it unique?
This Pine Script indicator is a complex tool designed to provide various option metrics and visualization tools for options market traders. The indicator extracts raw options data from an external data provider (ORATS), processes and refines the delayed data package using pineseed, and sends it to TradingView, visualizing the data using specific formulas (see detailed below) or interpolated values (e.g., delta distances). This method of incorporating options data into a visualization framework is unique and entirely innovative on TradingView.
The indicator aims to offer a comprehensive view of the current state of options for the implemented instruments, including implied volatility (IV), IV rank (IVR), options skew, and expected market movements, which are objectively measured as detailed below.
The options metrics we display may be familiar to options traders from various major brokerage platforms such as TastyTrade, IBKR, TOS, Tradier, TD Ameritrade, Schwab, etc.
🟨 𝗗𝗘𝗧𝗔𝗜𝗟𝗘𝗗 𝗗𝗢𝗖𝗨𝗠𝗘𝗡𝗧𝗔𝗧𝗜𝗢𝗡 🟨
🔶 Auto-Updating Option Metrics and Curved Lines
🔹 Interpolated DELTA Curves (16,20,25,30,40)
In our indicator, the curve layer settings allow you to choose the delta value for displaying the delta curve: 16, 20, 25, 30, or even 40. The color of the curve can be customized, and you can also hide the delta curve by selecting the "-" option.
It's important to mention that we display interpolated deltas from the actual option chain of the underlying asset using the Black-Scholes model. This ensures that the 16 delta truly reflects the theoretical, but accurate, 16 delta distance. (For example, deltas shown by brokerages for individual strikes are rounded; a 0.16 delta might actually be 0.1625.)
🔹 Expected Move Curve (Exp.mv)
The expected move is the predicted dollar change in the underlying stock's price by a given option's expiration date, with 68% certainty. It is calculated using the expiration's pricing and implied volatility levels. We chose the TastyTrade method for calculating expected move, as we found it to be the most expressive.
Expected Move Calculation
Expected Move = (ATM straddle price x 0.6) + (1st OTM strangle price x 0.3) + (2nd OTM strangle price x 0.1)
For example , if stock XYZ is trading at 121 and the ATM straddle is 4.40, the 120/122 strangle is 3.46, and the 119/123 strangle is 2.66, the expected move is calculated as follows: 4.40 x 0.60 = 2.64; 3.46 x 0.30 = 1.04; 2.66 x 0.10 = 0.27; Expected move = 2.64 + 1.04 + 0.27 = ±3.9
In this example below, the TastyTrade platform indicates the expected move on the option chain with a brown color, and the exact value is displayed behind the ± symbol for each expiration. By default, we also use brown for this indication, but this can be changed or the curve display can be turned off.
🔹 Standard Deviation Curve (1 STD)
One standard deviation of a stock encompasses approximately 68.2% of outcomes in a distribution of occurrences based on current implied volatility.
We use the expected move formula to calculate the one standard deviation range of a stock. This calculation is based on the days-to-expiration (DTE) of our option contract, the stock price, and the implied volatility of a stock:
Calculation:
Standard Deviation = Closing Price * Implied Volatility * sqrt(Days to Expiration / 365)
According to options literature, there is a 68% probability that the underlying asset will fall within this one standard deviation range at expiration.
If the 1 STD and Exp.mv displays are both enabled, the indicator fills the area between them with a light gray color. This is because both represent probability distributions that appear as a "bell curve" when graphed, making it visually appealing.
Tip and Note:
The 1 STD line might appear jagged at times , which does not indicate a problem with the indicator. This is normal immediately after market open (e.g., during the first data refresh of the day) or if the expirations are illiquid (e.g., weekly expirations). The 1 STD value is calculated based on the aggregated IVx for the expirations, and the aggregated IVx value for weekly expirations updates less frequently due to lower trading volume. In such cases, we recommend enabling the "Only Monthly Expirations" option to smooth out the bell curve.
∑ Quant Observation:
The values of the expected move and the 1st standard deviation (1STD) will not match because they use different calculation methods, even though both are referred to as representing 68% of the underlying asset's movement in options literature. The expected move is based on direct market pricing of ATM options. The 1STD, on the other hand, uses the averaged implied volatility (IVX) for the given expiration to determine its value. Based on our experience, it is better to consider the area between the expected move and the 1STD as the true representation of the original 68% rule.
🔶 IVR Dashboard Panel Rows
🔹 IVR (IV Rank)
The Implied Volatility Rank (IVR) indicator helps options traders assess the current level of implied volatility (IV) in comparison to the past 52 weeks. IVR is a useful metric to determine whether options are relatively cheap or expensive. This can guide traders on whether to buy or sell options. We calculate IVrank, like TastyTrade does.
IVR Calculation:
IV Rank = (current IV - 52 week IV low) / (52 week IV high - 52 week IV low)
IVR Levels and Interpretations:
IVR 0-10 (Green): Very low implied volatility rank. Options might be "cheap," potentially a good time to buy options.
IVR 10-35 (White): Normal implied volatility rank. Options pricing is relatively standard.
IVR 35-50 (Orange): Almost high implied volatility rank.
IVR 50-75 (Red): Definitely high implied volatility rank. Options might be "expensive," potentially a good time to sell options for higher premiums.
IVR above 75 (Highlighted Red): Ultra high implied volatility rank. Indicates very high levels, suggesting a favorable time for selling options.
The panel refreshes automatically if the symbol is implemented. You can hide the panel or change the position and size.
🔹IVx (Implied Volatility Index)
The Implied Volatility Index (IVx) displayed in the option chain is calculated similarly to the VIX. The Cboe uses standard and weekly SPX options to measure the expected volatility of the S&P 500. A similar method is utilized to calculate IVx for each option expiration cycle.
For our purposes on the IVR Panel, we aggregate the IVx values specifically for the 35-70 day monthly expiration cycle . This aggregated value is then presented in the screener and info panel, providing a clear and concise measure of implied volatility over this period.
IVx Color coding:
IVx above 30 is displayed in orange.
IVx above 60 is displayed in red
IVx on curve:
The IVx values for each expiration can be viewed by hovering the mouse over the colored tooltip labels above the Curve.
IVx avg on IVR panel :
If the option is checked in the IVR panel settings, the IVR panel will display the average IVx values up to the optimal expiration.
Important Note:
The IVx value alone does not provide sufficient context. There are stocks that inherently exhibit high IVx values. Therefore, it is crucial to consider IVx in conjunction with the Implied Volatility Rank (IVR), which measures the IVx relative to its own historical values. This combined view helps in accurately assessing the significance of the IVx in relation to the specific stock's typical volatility behavior.
This indicator offers traders a comprehensive view of implied volatility, assisting them in making informed decisions by highlighting both the absolute and relative volatility measures.
🔹IVx 5 days change %
We are displaying the five-day change of the IV Index (IVx value). The IV Index 5-Day Change column provides quick insight into recent expansions or decreases in implied volatility over the last five trading days.
Traders who expect the value of options to decrease might view a decrease in IVX as a positive signal. Strategies such as Strangle and Ratio Spread can benefit from this decrease.
On the other hand, traders anticipating further increases in IVX will focus on the rising IVX values. Strategies like Calendar Spread or Diagonal Spread can take advantage of increasing implied volatility.
This indicator helps traders quickly assess changes in implied volatility, enabling them to make informed decisions based on their trading strategies and market expectations.
🔹 Vertical Pricing Skew
At TanukiTrade, Vertical Pricing Skew refers to the difference in pricing between put and call options with the same expiration date at the same distance (at expected move). We analyze this skew to understand market sentiment. This is the same formula used by TastyTrade for calculations.
We calculate the interpolated strike price based on the expected move , taking into account the neighboring option prices and their distances. This allows us to accurately determine whether the CALL or PUT options are more expensive.
PUT Skew (red): Put options are more expensive than call options, indicating the market expects a downward move (▽). If put options are more expensive by more than 20% at the same expected move distance, we color it lighter red.
CALL Skew (green): Call options are more expensive than put options, indicating the market expects an upward move (△). If call options are priced more than 30% higher at the examined expiration, we color it lighter green.
Vertical Skew on Curve:
The degree of vertical pricing skew for each expiration can be viewed by hovering over the points above the curve. Hover with mouse for more information.
Vertical Skew on IVR panel:
We focus on options with 35-70 days to expiration (DTE) for optimal analysis in case of vertical skew. Hover with mouse for more information.
This approach helps us gauge market expectations accurately, providing insights into potential price movements. Remember, we always evaluate the skew at the expected move using linear interpolation to determine the theoretical pricing of options.
🔹 Delta Skew 🌪️ (Twist)
We have a new metric that examines which monthly expiration indicates a "Delta Skew Twist" where the 16 delta deviates from the monthly STD. This is important because, under normal circumstances, the 16 delta is positioned between the expected move and the standard deviation (STD1) line (see Exp.mv & 1STD exact definitions above). However, if the interpolated 16 delta line exceeds the STD1 line either upwards or downwards, it represents a special case of vertical skew on the option chain.
Normal case : exp.move < delta16 < std1
Delta Skew Twist: exp.move < std1 < delta16
We indicate this with direction-specific colors (red/green) on the delta line. We also color the section of the delta curve affected by the delta skew in this case, even if you choose to display a lower delta, such as 30, instead of 16.
If "Colored Labels with Tooltips" is enabled, we also display a 🌪️ symbol in the tooltip for the expirations affected by Delta Skew.
If you have enabled the display of 'Vertical Pricing Skew' on the IVR Panel, a 🌪️ symbol will also appear next to the value of the vertical skew, and the tooltip will indicate from which expiration Delta Skew is observed.
🔹 Horizontal IVx Skew
In options pricing, it is typically expected that the implied volatility (IVx) increases for options with later expiration dates. This means that options further out in time are generally more expensive. At TanukiTrade, we refer to the phenomenon where this expectation is reversed—when the IVx decreases between two consecutive expirations—as Horizontal Skew or IVx Skew.
Horizontal IVx Skew occurs when: Front Expiry IVx < Back Expiry IVx
This scenario can create opportunities for traders who prefer diagonal or calendar strategies . Based on our experience, we categorize Horizontal Skew into two types:
Weekly Horizontal Skew:
When IVx skew is observed between two consecutive non-monthly expirations, the displayed value is the rounded-up percentage difference. On hover, the approximate location of this skew is also displayed. The precise location can be seen on this indicator.
Monthly Horizontal Skew:
When IVx skew is observed between two consecutive monthly expirations , the displayed value is the rounded-up percentage difference. On hover, the approximate location of this skew is also displayed. The precise location can be seen on our Overlay indicator.
The Monthly Vertical IVx skew is consistently more liquid than the weekly vertical IVx skew. Weekly Horizontal IVx Skew may not carry relevant information for symbols not included in the 'Weeklies & Volume Masters' preset in our Options Screener indicator.
If the options chain follows the normal IVx pattern, no skew value is displayed.
Color codes or tooltip labels above curve:
Gray - No horizontal skew;
Purple - Weekly horizontal skew;
BigBlue - Monthly horizontal skew
The display of monthly and weekly IVx skew can be toggled on or off on the IVR panel. However, if you want to disable the colored tooltips above the curve, this can only be done using the "Colored labels with tooltips" switch.
We indicate this range with colorful information bubbles above the upper STD line.
🔶 The Option Trader’s GRID System: Adaptive MurreyMath + Expiry Lines
At TanukiTrade, we utilize Enhanced MurreyMath and Expiry lines to create a dynamic grid system, unlike the basic built-in vertical grids in TradingView, which provide no insight into specific price levels or option expirations.
These grids are beneficial because they provide a structured layout, making important price levels visible on the chart. The grid automatically resizes as the underlying asset's volatility changes, helping traders identify expected movements for various option expirations.
The Option Trader’s GRID System part of this indicator can be used without limitations for all instruments . There are no type or other restrictions, and it automatically scales to fit every asset. Even if we haven't implemented the option metrics for a particular underlying asset, the GRID system will still function!
🔹 SETUP OF YOUR OPTIONS GRID SYSTEM
You can setup your new grid system in 3 easy steps!
STEP1: Hide default horizontal grid lines in TradingView
Right-click on an empty area of your chart, then select “Settings.” In the Chart settings -> Canvas -> Grid lines section, disable the display of horizontal lines to avoid distraction.
SETUP STEP2: Scaling fix
Right-click on the price scale on the right side, then select "Scale price chart only" to prevent the chart from scaling to the new horizontal lines!
STEP3: Enable Tanuki Options Grid
As a final step, make sure that both the vertical (MurreyMath) and horizontal (Expiry) lines are enabled in the Grid section of our indicator.
You are done, enjoy the new grid system!
🔹 HORIZONTAL: Enhanced MurreyMath Lines
Murrey Math lines are based on the principles observed by William Gann, renowned for his market symmetry forecasts. Gann's techniques, such as Gann Angles, have been adapted by Murrey to make them more accessible to ordinary investors. According to Murrey, markets often correct at specific price levels, and breakouts or returns to these levels can signal good entry points for trades.
At TanukiTrade, we enhance these price levels based on our experience , ensuring a clear display. We acknowledge that while MurreyMath lines aren't infallible predictions, they are useful for identifying likely price movements over a given period (e.g., one month) if the market trend aligns.
Our opinion: MurreyMath lines are not crystal balls (like no other tool). They should be used to identify that if we are trading in the right direction, the price is likely to reach the next unit step within a unit time (e.g. monthly expiration).
One unit step is the distance between Murrey Math lines, such as between the 0/8 and 1/8 lines. This interval helps identify different quadrants and is crucial for recognizing support and resistance levels.
Some option traders use Murrey Math lines to gauge the movement speed of an instrument over a unit time. A quadrant encompasses 4 unit steps.
Key levels, according to TanukiTrade, include:
Of course, the lines can be toggled on or off, and their default color can also be changed.
🔹 VERTICAL: Expiry Lines
The indicator can display monthly and weekly expirations as dashed lines, with customizable colors. Weekly expirations will always appear in a lighter shade compared to monthly expirations.
Monthly Expiry Lines:
You can turn off the lines indicating monthly expirations, or set the direction (past/future/both) and the number of lines to be drawn.
Weekly Expiry Lines:
You can display weekly expirations pointing to the future. You can also turn them off or specify how many weeks ahead the lines should be drawn.
Of course, the lines can be toggled on or off, and their default color can also be changed.
TIP: Hide default vertical grid lines in TradingView
Right-click on an empty area of your chart, then select “Settings.” In the Chart settings -> Canvas -> Grid lines section, disable the display of vertical lines to avoid distraction. Same, like steps above at MurreyMath lines.
🔶 ADDITIONAL IMPORTANT COMMENTS
- U.S. market only:
Since we only deal with liquid option chains: this option indicator only works for the USA options market and do not include future contracts; we have implemented each selected symbol individually.
- Why is there a slight difference between the displayed data and my live brokerage data? There are two reasons for this, and one is beyond our control.
- Brokerage Calculation Differences:
Every brokerage has slight differences in how they calculate metrics like IV and IVx. If you open three windows for TOS, TastyTrade, and IBKR side by side, you will notice that the values are minimally different. We had to choose a standard, so we use the formulas and mathematical models described by TastyTrade when analyzing the options chain and drawing conclusions.
- Option-data update frequency:
According to TradingView's regulations and guidelines, we can update external data a maximum of 5 times per day. We strive to use these updates in the most optimal way:
(1st update) 15 minutes after U.S. market open
(2nd, 3rd, 4th updates) 1.5–3 hours during U.S. market open hours
(5th update) 10 minutes before market close.
You don’t need to refresh your window, our last refreshed data-pack is always automatically applied to your indicator , and you can see the time elapsed since the last update at the bottom of your indicator.
- Skewed Curves:
The delta, expected move, and standard deviation curves also appear relevantly on a daily or intraday timeframe. Data loss is experienced above a daily timeframe: this is a TradingView limitation.
- Weekly illiquid expiries:
Especially for instruments where weekly options are illiquid: the weekly expiration STD1 data is not relevant. In these cases, we recommend checking in the "Display only Monthly labels" checkbox to avoid displaying not relevant weekly options expirations.
-Timeframe Issues:
Our option indicator visualizes relevant data on a daily resolution. If you see strange or incorrect data (e.g., when the options data was last updated), always switch to a daily (1D) timeframe. If you still see strange data, please contact us.
Disclaimer:
Our option indicator uses approximately 15min-3 hour delayed option market snapshot data to calculate the main option metrics. Exact realtime option contract prices are never displayed; only derived metrics and interpolated delta are shown to ensure accurate and consistent visualization. Due to the above, this indicator can only be used for decision support; exclusive decisions cannot be made based on this indicator . We reserve the right to make errors.This indicator is designed for options traders who understand what they are doing. It assumes that they are familiar with options and can make well-informed, independent decisions. We work with public data and are not a data provider; therefore, we do not bear any financial or other liability.

Options Screener [Pro] - IVRank, IVx, Deltas, Exp.move, Skew
𝗢𝗽𝘁𝗶𝗼𝗻 𝘀𝗰𝗿𝗲𝗲𝗻𝗲𝗿 𝗼𝗻 𝗧𝗿𝗮𝗱𝗶𝗻𝗴𝗩𝗶𝗲𝘄 𝘄𝗶𝘁𝗵 𝗿𝗲𝗮𝗹 𝗱𝗮𝘁𝗮, 𝗮𝘃𝗮𝗶𝗹𝗮𝗯𝗹𝗲 𝗳𝗼𝗿 𝗼𝘃𝗲𝗿 𝟭𝟱𝟬+ 𝗹𝗶𝗾𝘂𝗶𝗱 𝗨𝗦 𝗺𝗮𝗿𝗸𝗲𝘁 𝘀𝘆𝗺𝗯𝗼𝗹𝘀!
𝗢𝘂𝗿 𝘀𝗰𝗿𝗲𝗲𝗻𝗲𝗿 𝗽𝗿𝗼𝘃𝗶𝗱𝗲𝘀 𝗲𝘀𝘀𝗲𝗻𝘁𝗶𝗮𝗹 𝗸𝗲𝘆 𝗺𝗲𝘁𝗿𝗶𝗰𝘀 𝘀𝘂𝗰𝗵 𝗮𝘀:
✅ IVRank
✅ IVx
✅ 5-Day IVx Change
✅ Vertical Pricing Skew
✅ Horizontal IVx Skew
✅ Delta Skew
like TastyTrade, TOS, IBKR etc.
Designed to help you assess option market conditions and make well-informed trading decisions, this tool is an essential addition for every serious options trader!
Ticker Information:
This screener is currently implemented for more than 150 liquid US market tickers and we are continuously expanding the list:
SP:SPX AMEX:SPY NASDAQ:QQQ NASDAQ:TLT AMEX:GLD
NYSE:AA NASDAQ:AAL NASDAQ:AAPL NYSE:ABBV NASDAQ:ABNB NASDAQ:AMD NASDAQ:AMZN AMEX:ARKK NASDAQ:AVGO NYSE:AXP NYSE:BA NYSE:BABA NYSE:BAC NASDAQ:BIDU AMEX:BITO NYSE:BMY NYSE:BP NASDAQ:BYND NYSE:C NYSE:CAT NYSE:CCJ NYSE:CCL NASDAQ:COIN NYSE:COP NASDAQ:COST NYSE:CRM NASDAQ:CRWD NASDAQ:CSCO NYSE:CVNA NYSE:CVS NYSE:CVX NYSE:DAL NASDAQ:DBX AMEX:DIA NYSE:DIS NASDAQ:DKNG NASDAQ:EBAY NASDAQ:ETSY NASDAQ:EXPE NYSE:F NYSE:FCX NYSE:FDX AMEX:FXI AMEX:GDX AMEX:GDXJ NYSE:GE NYSE:GM NYSE:GME NYSE:GOLD NASDAQ:GOOG NASDAQ:GOOGL NYSE:GPS NYSE:GS NASDAQ:HOOD NYSE:IBM NASDAQ:IEF NASDAQ:INTC AMEX:IWM NASDAQ:JD NYSE:JNJ NYSE:JPM NYSE:JWN NYSE:KO NYSE:LLY NYSE:LOW NYSE:LVS NYSE:MA NASDAQ:MARA NYSE:MCD NYSE:MET NASDAQ:META NYSE:MGM NYSE:MMM NYSE:MPC NYSE:MRK NASDAQ:MRNA NYSE:MRO NASDAQ:MRVL NYSE:MS NASDAQ:MSFT AMEX:MSOS NYSE:NCLH NASDAQ:NDX NYSE:NET NASDAQ:NFLX NYSE:NIO NYSE:NKE NASDAQ:NVDA NASDAQ:ON NYSE:ORCL NYSE:OXY NASDAQ:PEP NYSE:PFE NYSE:PINS NYSE:PLTR NASDAQ:PTON NASDAQ:PYPL NASDAQ:QCOM NYSE:RBLX NYSE:RCL NASDAQ:RIOT NASDAQ:RIVN NASDAQ:ROKU NASDAQ:SBUX NYSE:SHOP AMEX:SLV NASDAQ:SMCI NASDAQ:SMH NYSE:SNAP NYSE:SQ NYSE:T NYSE:TGT NASDAQ:TQQQ NASDAQ:TSLA NYSE:TSM NASDAQ:TTD NASDAQ:TXN NYSE:U NASDAQ:UAL NYSE:UBER AMEX:UNG NYSE:UPS NASDAQ:UPST AMEX:USO NYSE:V AMEX:VXX NYSE:VZ NASDAQ:WBA NYSE:WFC NYSE:WMT NASDAQ:WYNN NYSE:X AMEX:XHB AMEX:XLE AMEX:XLF AMEX:XLI AMEX:XLK AMEX:XLP AMEX:XLU AMEX:XLV AMEX:XLY NYSE:XOM NYSE:XPEV CBOE:XSP NASDAQ:ZM
How does the screener work and why is it unique?
This Pine Script screener is an expert tool created to provide various option metrics and visualization tools for options market traders. The screener extracts raw options data from an external data provider (ORATS), processes, and refines the delayed data package using pineseed, and sends it to TradingView. The data is calculated using specific formulas or interpolated values, such as delta distances. This method of integrating options data into a screener framework is unique and innovative on TradingView.
The screener aims to offer a comprehensive view of the current state of options for the implemented instruments, including implied volatility index (IVx), IV rank (IVR), options skew, and expected market movements, which are objectively measured as detailed below.
The options metrics displayed may be familiar to options traders from various major brokerage platforms such as TastyTrade, IBKR, TOS, Tradier, TD Ameritrade, Schwab, etc.
🟨 𝗗𝗘𝗧𝗔𝗜𝗟𝗘𝗗 𝗗𝗢𝗖𝗨𝗠𝗘𝗡𝗧𝗔𝗧𝗜𝗢𝗡 🟨
~~~~~~~~~~~~~~~~~~~~~~~~~~~~~~~~~~~~~~~~~~~~~~~~~~
~~~~~~~~~~~~~~~~~~~~~~~~~~~~~~~~~~~~~~~~~~~~~~~~~~
🔶 Auto-Updating Option Metrics
~~~~~~~~~~~~~~~~~~~~~~~~~~~~~~~~~~~~~~~~~~~~~~~~~~
~~~~~~~~~~~~~~~~~~~~~~~~~~~~~~~~~~~~~~~~~~~~~~~~~~
🔹 IVR (IV Rank)
The Implied Volatility Rank (IVR) indicator helps options traders assess the current level of implied volatility (IV) in comparison to the past 52 weeks. IVR is a useful metric to determine whether options are relatively cheap or expensive. This can guide traders on whether to buy or sell options. We calculate IVrank, like TastyTrade does.
IVR Calculation: IV Rank = (current IV - 52 week IV low) / (52 week IV high - 52 week IV low)
IVR Levels and Interpretations:
IVR 0-10 (Green): Very low implied volatility rank. Options might be "cheap," potentially a good time to buy options.
IVR 10-35 (White): Normal implied volatility rank. Options pricing is relatively standard.
IVR 35-50 (Orange): Almost high implied volatility rank.
IVR 50-75 (Red): Definitely high implied volatility rank. Options might be "expensive," potentially a good time to sell options for higher premiums.
IVR above 75 (Highlighted Red): Ultra high implied volatility rank. Indicates very high levels, suggesting a favorable time for selling options.
Extra: If the IVx value is also greater than 30, the background will be dark highlighted, because a high IVR alone doesn’t mean much without high IVx.
🔹IVx (Implied Volatility Index)
The Implied Volatility Index (IVx) displayed in the option chain is calculated similarly to the VIX. The Cboe employs standard and weekly SPX options to measure the expected volatility of the S&P 500. A similar method is utilized to calculate IVx for each option expiration cycle.
For our purposes, we aggregate the IVx values specifically for the 35-70 day monthly expiration cycle . This aggregated value is then presented in the screener and info panel, providing a clear and concise measure of implied volatility over this period.
We will display a warning if the option chain is heavily skewed and valid, symmetric 16 delta options are not found at optimal monthly expirations.
IVx Color coding:
IVx above 30 is displayed in orange.
IVx above 60 is displayed in red
Important Note: The IVx value alone does not provide sufficient context. There are stocks that inherently exhibit high IVx values. Therefore, it is crucial to consider IVx in conjunction with the Implied Volatility Rank (IVR), which measures the IVx relative to its own historical values. This combined view helps in accurately assessing the significance of the IVx in relation to the specific stock's typical volatility behavior.
This indicator offers traders a comprehensive view of implied volatility, assisting them in making informed decisions by highlighting both the absolute and relative volatility measures.
🔹IVx 5 days change %
We are displaying the five-day change of the IV Index (IVx value). The IV Index 5-Day Change column provides quick insight into recent expansions or decreases in implied volatility over the last five trading days.
Traders who expect the value of options to decrease might view a decrease in IVX as a positive signal. Strategies such as Strangle and Ratio Spread can benefit from this decrease.
On the other hand, traders anticipating further increases in IVX will focus on the rising IVX values. Strategies like Calendar Spread or Diagonal Spread can take advantage of increasing implied volatility.
This indicator helps traders quickly assess changes in implied volatility, enabling them to make informed decisions based on their trading strategies and market expectations.
🔹 Vertical Pricing Skew
At TanukiTrade, Vertical Pricing Skew refers to the difference in pricing between put and call options with the same expiration date at the same distance (at expected move). We analyze this skew to understand market sentiment. This is the same formula used by TastyTrade for calculations.
PUT Skew (red): Put options are more expensive than call options, indicating the market expects a downward move (▽). If put options are more expensive by more than 20% at the same expected move distance, we color it lighter red.
CALL Skew (green): Call options are more expensive than put options, indicating the market expects an upward move (△). If call options are priced more than 30% higher at the examined expiration, we color it lighter green.
We focus on options with 35-70 days to expiration (DTE) for optimal analysis. We always evaluate the skew at the expected move using linear interpolation to determine the theoretical pricing of options. If the pricing have more than C50%/P35% we are highlighting the cell.
This approach helps us gauge market expectations accurately, providing insights into potential price movements.
🔹 Horizontal IVx Skew
In options pricing, it is typically expected that the implied volatility (IVx) increases for options with later expiration dates. This means that options further out in time are generally more expensive. At TanukiTrade, we refer to the phenomenon where this expectation is reversed—when the IVx decreases between two consecutive expirations—as Horizontal Skew or IVx Skew.
Horizontal IVx Skew occurs when: Front Month IVx < Back Month IVx
This scenario can create opportunities for traders who prefer diagonal or calendar strategies. Based on our experience, we categorize Horizontal Skew into two types:
Weekly Horizontal Skew: When IVx skew is observed between two consecutive non-monthly expirations , the displayed value is the rounded-up percentage difference. On hover, the approximate location of this skew is also displayed. The precise location can be seen on the Overlay indicator.
Monthly Horizontal Skew: When IVx skew is observed between two consecutive monthly expirations , the displayed value is the rounded-up percentage difference. On hover, the approximate location of this skew is also displayed. The precise location can be seen on the Overlay indicator.
The Monthly Vertical IVx skew is consistently stronger (more liquid) on average symbols than the weekly vertical IVx skew. Weekly Horizontal IVx Skew may not carry relevant information for symbols not included in the 'Weeklies & Volume Masters' preset.
If the options chain follows the normal IVx pattern, no skew value is displayed.
Additionally , if the Implied Volatility Rank (IVR) is low (indicated by green), the Horizontal Skew background turns black, because this environment is good for Calendar+Diagonal.
Additionally , if the % of the skew is greater than 10, the Horizontal Skew font color turns lighter.
🔹 Delta Skew 🌪️ (Twist)
We have a metric that examines which monthly expiration indicates a "Delta Skew Twist" where the 16 delta deviates from the monthly STD. This is important because, under normal circumstances, the 16 delta is positioned between the expected move and the standard deviation (STD1) line. However, if the interpolated 16 delta line exceeds the STD1 line either upwards or downwards, it represents a special case of vertical skew.
Normal case : exp.move < delta16 < std1
Delta Skew Twist: exp.move < std1 < delta16
If the Days to Expiration of the twist is less than 75, we use a lighter color.
~~~~~~~~~~~~~~~~~~~~~~~~~~~~~~~~~~~~~~~~~~~~~~~~~~
~~~~~~~~~~~~~~~~~~~~~~~~~~~~~~~~~~~~~~~~~~~~~~~~~~
🔶 HOW WE CALCULATE
~~~~~~~~~~~~~~~~~~~~~~~~~~~~~~~~~~~~~~~~~~~~~~~~~~
~~~~~~~~~~~~~~~~~~~~~~~~~~~~~~~~~~~~~~~~~~~~~~~~~~
🔹 Expected Move
The expected move is the predicted dollar change in the underlying stock's price by a given option's expiration date, with 68% certainty. It is calculated using the expiration's pricing and implied volatility levels.
Expected Move Calculation
Expected Move = (ATM straddle price x 0.6) + (1st OTM strangle price x 0.3) + (2nd OTM strangle price x 0.1)
For example , if stock XYZ is trading at 121 and the ATM straddle is 4.40, the 120/122 strangle is 3.46, and the 119/123 strangle is 2.66, the expected move is calculated as follows: 4.40 x 0.60 = 2.64; 3.46 x 0.30 = 1.04; 2.66 x 0.10 = 0.27; Expected move = 2.64 + 1.04 + 0.27 = ±3.9
🔹 Standard deviation
One standard deviation of a stock encompasses approximately 68.2% of outcomes in a distribution of occurrences based on current implied volatility.
We use the expected move formula to calculate the one standard deviation range of a stock. This calculation is based on the days-to-expiration (DTE) of our option contract, the stock price, and the implied volatility of a stock:
Calculation:
Standard Deviation = Closing Price * Implied Volatility * sqrt(Days to Expiration / 365)
According to options literature, there is a 68% probability that the underlying asset will fall within this one standard deviation range at expiration.
∑ Quant Observation: The values of the expected move and the 1st standard deviation (1STD) will not match because they use different calculation methods, even though both are referred to as representing 68% of the underlying asset's movement in options literature. The expected move is based on direct market pricing of ATM options. The 1STD, on the other hand, uses the averaged implied volatility (IVX) for the given expiration to determine its value. Based on our experience, it is better to consider the area between the expected move and the 1STD as the true representation of the original 68% rule.
~~~~~~~~~~~~~~~~~~~~~~~~~~~~~~~~~~~~~~~~~~~~~~~~~~
~~~~~~~~~~~~~~~~~~~~~~~~~~~~~~~~~~~~~~~~~~~~~~~~~~
🔶 USAGE
~~~~~~~~~~~~~~~~~~~~~~~~~~~~~~~~~~~~~~~~~~~~~~~~~~
~~~~~~~~~~~~~~~~~~~~~~~~~~~~~~~~~~~~~~~~~~~~~~~~~~
🔹 Create a new empty layout for the screener!
You can access this from the dropdown menu in the upper right corner. In the popup window, name it as you like, for example, "Option Screener."
🔹 Hide the candlestick chart
Make the chart invisible using the "Hide" option from the three-dot dropdown menu located in the upper left corner.
🔹 Other Unwanted Elements
If other unnecessary elements are distracting you (e.g., economic data, volume, default grid), you can easily remove them from the layout. Right-click on the empty chart area. Here, click on the gear (Settings) icon and remove everything from the "Events" tab, as well as from the "Trading" tab. Under the "Canvas" tab, it is recommended to set the "Grid lines" setting to "None."
~~~~~~~~~~~~~~~~~~~~~~~~~~~~~~~~~~~~~~~~~~~~~~~~~~
~~~~~~~~~~~~~~~~~~~~~~~~~~~~~~~~~~~~~~~~~~~~~~~~~~
🔶 Screener Settings
~~~~~~~~~~~~~~~~~~~~~~~~~~~~~~~~~~~~~~~~~~~~~~~~~~
~~~~~~~~~~~~~~~~~~~~~~~~~~~~~~~~~~~~~~~~~~~~~~~~~~
Naturally, the font size and position can be easily adjusted.
Additionally, there are two basic usage modes: manual input or using the preset list.
🔹If you selected “Manual Below” in the preset dropdown, the tickers you chose from the dropdown (up to a maximum of 40) will be displayed. The panel name will be the one you specified.
🔹If you selected a pre-assembled list , the manually entered list will be ignored, and the preset list will be displayed. (In the future, we will expand the preset list based on your feedback!).
~~~~~~~~~~~~~~~~~~~~~~~~~~~~~~~~~~~~~~~~~~~~~~~~~~
~~~~~~~~~~~~~~~~~~~~~~~~~~~~~~~~~~~~~~~~~~~~~~~~~~
🔶 Best Practices for TanukiTrade Option Screener:
~~~~~~~~~~~~~~~~~~~~~~~~~~~~~~~~~~~~~~~~~~~~~~~~~~
~~~~~~~~~~~~~~~~~~~~~~~~~~~~~~~~~~~~~~~~~~~~~~~~~~
🔹 Every Preset on a New Layout:
If you following the steps above, you easy can setup this screener in one window with one split layout:
🔹 Split Layout:
- Left Side: The underlying asset with our Options IV Overlay (IVR, Deltas, Expected Move, STD1, Skew visualized) along with the Enhanced Murrey Math Indicator and Option Expiry.
- Right Side: Searching for opportunities using our Options Screener.
Opportunities Search
🔹 Everything in One Layout + One Window:
This is the all-in-one view:
- The underlying asset with our Options IV Overlay (IVR, Deltas, Expected Move, STD1, Skew visualized)
- Enhanced Murrey Math Indicator and Option Expiry
- Options Screener on the left
~~~~~~~~~~~~~~~~~~~~~~~~~~~~~~~~~~~~~~~~
🔶 ADDITIONAL IMPORTANT COMMENTS
- U.S. market only:
Since we only deal with liquid option chains: this option indicator only works for the USA options market and do not include future contracts; we have implemented each selected symbol individually.
- Why is there a slight difference between the displayed data and my live brokerage data? There are two reasons for this, and one is beyond our control.
- Brokerage Calculation Differences:
Every brokerage has slight differences in how they calculate metrics like IV and IVx. If you open three windows for TOS, TastyTrade, and IBKR side by side, you will notice that the values are minimally different. We had to choose a standard, so we use the formulas and mathematical models described by TastyTrade when analyzing the options chain and drawing conclusions.
- Option-data update frequency:
According to TradingView's regulations and guidelines, we can update external data a maximum of 5 times per day. We strive to use these updates in the most optimal way:
(1st update) 15 minutes after U.S. market open
(2nd, 3rd, 4th updates) 1.5–3 hours during U.S. market open hours
(5th update) 10 minutes before market close.
You don’t need to refresh your window, our last refreshed data-pack is always automatically applied to your indicator , and you can see the time elapsed since the last update at the bottom of your indicator.
- Weekly illiquid expiries:
The Weekly Horizontal IVx Skew may not carry relevant information for instruments not included in the 'Weeklies & Volume Masters' preset package.
-Timeframe Issues:
Our option indicator visualizes relevant data on a daily resolution. If you see strange or incorrect data (e.g., when the options data was last updated), always switch to a daily (1D) timeframe. If you still see strange data, please contact us.
Disclaimer:
Our option indicator uses approximately 15min-3 hour delayed option market snapshot data to calculate the main option metrics. Exact realtime option contract prices are never displayed; only derived metrics and interpolated delta are shown to ensure accurate and consistent visualization. Due to the above, this indicator can only be used for decision support; exclusive decisions cannot be made based on this indicator . We reserve the right to make errors.This indicator is designed for options traders who understand what they are doing. It assumes that they are familiar with options and can make well-informed, independent decisions. We work with public data and are not a data provider; therefore, we do not bear any financial or other liability.

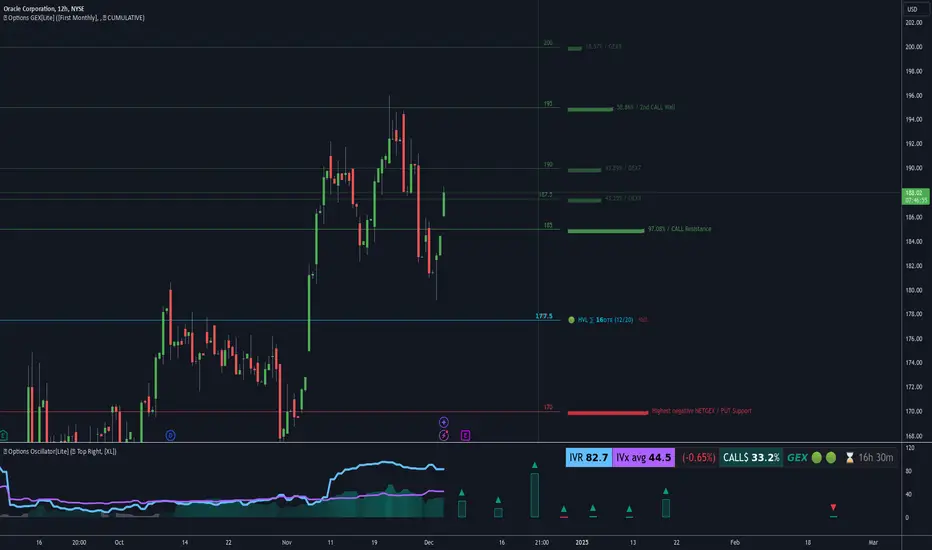
Options Overlay [Lite] IVR IV Skew Delta Expmv MurreyMath Expiry𝗡𝗼𝗻-𝗼𝗳𝗳𝗶𝗰𝗶𝗮𝗹 𝗧𝗢𝗦 𝗮𝗻𝗱 𝗧𝗮𝘀𝘁𝘆𝗧𝗿𝗮𝗱𝗲 𝗹𝗶𝗸𝗲 𝗜𝗩𝗥 𝗢𝗽𝘁𝗶𝗼𝗻𝘀 𝘃𝗶𝘀𝘂𝗮𝗹𝗶𝘇𝗮𝘁𝗶𝗼𝗻 𝘁𝗼𝗼𝗹 𝘄𝗶𝘁𝗵 𝗱𝗲𝗹𝗮𝘆𝗲𝗱 𝗼𝗽𝘁𝗶𝗼𝗻 𝗰𝗵𝗮𝗶𝗻 𝗱𝗮𝘁𝗮
Are you an options trader who uses TradingView for technical analysis for the US market?
➡️ Do you want to see the IV Rank of an instrument on TradingView?
➡️ Can’t you check the key options metrics while charting?
➡️ Have you never visualized the options chain before?
➡️ Would you like to see how the IVx has changed for a specific ticker?
If you answered "yes" to any of these questions, then we have the solution for you!
🔃 Auto-Updating Option Metrics without refresh!
🍒 Developed and maintained by option traders for option traders.
📈 Specifically designed for TradingView users who trade options.
Our indicator provides essential key metrics such as:
✅ IVRank
✅ IVx
✅ 5-Day IVx Change
✅ Delta curves and interpolated distances
✅ Expected move curve
✅ Standard deviation (STD1) curve
✅ Vertical Pricing Skew
✅ Horizontal IVx Skew
✅ Delta Skew
like TastyTrade, TOS, IBKR etc, but in a much more visually intuitive way. See detailed descriptions below.
If this isn't enough, we also include a unique grid system designed specifically for options traders. This package features our innovative dynamic grid system:
✅ Enhanced Murrey Math levels (horizontal scale)
✅ Options expirations (vertical scale)
Designed to help you assess market conditions and make well-informed trading decisions, this tool is an essential addition for every serious options trader!
Ticker Information:
This indicator is currently implemented for 5 liquid tickers: NASDAQ:AAPL NASDAQ:AMZN AMEX:DIA NYSE:ORCL and NASDAQ:TSLA
How does the indicator work and why is it unique?
This Pine Script indicator is a complex tool designed to provide various option metrics and visualization tools for options market traders. The indicator extracts raw options data from an external data provider (ORATS), processes and refines the delayed data package using pineseed, and sends it to TradingView, visualizing the data using specific formulas (see detailed below) or interpolated values (e.g., delta distances). This method of incorporating options data into a visualization framework is unique and entirely innovative on TradingView.
The indicator aims to offer a comprehensive view of the current state of options for the implemented instruments, including implied volatility (IV), IV rank (IVR), options skew, and expected market movements, which are objectively measured as detailed below.
The options metrics we display may be familiar to options traders from various major brokerage platforms such as TastyTrade, IBKR, TOS, Tradier, TD Ameritrade, Schwab, etc.
Key Features:
IV Rank (IVR) : The implied volatility rank compares the current IV to the lowest and highest values over the past 52 weeks. The IVR indicator helps determine whether options are relatively cheap or expensive.
IV Average (IVx) : The implied volatility displayed in the options chain, calculated similarly to the VIX. IVx values are aggregated within the 35-70 day expiration cycle.
IV Change (5 days) : The change in implied volatility over the past five trading days. This indicator provides a quick insight into the recent changes in IV.
Expected Move (Exp. Move) : The expected movement for the options expiration cycle, calculated using the price of the ATM (at-the-money) straddle, the first OTM (out-of-the-money) strangle, and the second OTM strangle.
Options Skew : The price difference between put and call options with the same expiration date. Vertical and horizontal skew indicators help understand market sentiment and potential price movements.
Visualization Tools:
Informational IVR Panel : A tabular display mode that presents the selected indicators on the chart. The panel’s placement, size, and content are customizable, including color and tooltip settings.
1 STD, Delta, and Expected Move : Visualization of fundamental classic options metrics corresponding to expirations with bell curves.
Colored Label Tooltips : Detailed tooltips above the bell curves showing options metrics for each expiration.
Adaptive Murrey Math Lines : A horizontal line system based on the principles of Murrey Math Lines, helping identify important price levels and market structures.
Expiration Lines : Displays both monthly and weekly options expirations. The indicator supports various color and style settings, as well as the regulation of the number of expirations displayed.
🟨 𝗗𝗘𝗧𝗔𝗜𝗟𝗘𝗗 𝗗𝗢𝗖𝗨𝗠𝗘𝗡𝗧𝗔𝗧𝗜𝗢𝗡 🟨
🔶 Auto-Updating Option Metrics and Curved Lines
🔹 Interpolated DELTA Curves (16,20,25,30,40)
In our indicator, the curve layer settings allow you to choose the delta value for displaying the delta curve: 16, 20, 25, 30, or even 40. The color of the curve can be customized, and you can also hide the delta curve by selecting the "-" option.
It's important to mention that we display interpolated deltas from the actual option chain of the underlying asset using the Black-Scholes model. This ensures that the 16 delta truly reflects the theoretical, but accurate, 16 delta distance. (For example, deltas shown by brokerages for individual strikes are rounded; a 0.16 delta might actually be 0.1625.)
🔹 Expected Move Curve (Exp.mv)
The expected move is the predicted dollar change in the underlying stock's price by a given option's expiration date, with 68% certainty. It is calculated using the expiration's pricing and implied volatility levels. We chose the TastyTrade method for calculating expected move, as we found it to be the most expressive.
Expected Move Calculation
Expected Move = (ATM straddle price x 0.6) + (1st OTM strangle price x 0.3) + (2nd OTM strangle price x 0.1)
For example , if stock XYZ is trading at 121 and the ATM straddle is 4.40, the 120/122 strangle is 3.46, and the 119/123 strangle is 2.66, the expected move is calculated as follows: 4.40 x 0.60 = 2.64; 3.46 x 0.30 = 1.04; 2.66 x 0.10 = 0.27; Expected move = 2.64 + 1.04 + 0.27 = ±3.9
In this example below, the TastyTrade platform indicates the expected move on the option chain with a brown color, and the exact value is displayed behind the ± symbol for each expiration. By default, we also use brown for this indication, but this can be changed or the curve display can be turned off.
🔹 Standard Deviation Curve (1 STD)
One standard deviation of a stock encompasses approximately 68.2% of outcomes in a distribution of occurrences based on current implied volatility.
We use the expected move formula to calculate the one standard deviation range of a stock. This calculation is based on the days-to-expiration (DTE) of our option contract, the stock price, and the implied volatility of a stock:
Calculation:
Standard Deviation = Closing Price * Implied Volatility * sqrt(Days to Expiration / 365)
According to options literature, there is a 68% probability that the underlying asset will fall within this one standard deviation range at expiration.
If the 1 STD and Exp.mv displays are both enabled, the indicator fills the area between them with a light gray color. This is because both represent probability distributions that appear as a "bell curve" when graphed, making it visually appealing.
Tip and Note:
The 1 STD line might appear jagged at times , which does not indicate a problem with the indicator. This is normal immediately after market open (e.g., during the first data refresh of the day) or if the expirations are illiquid (e.g., weekly expirations). The 1 STD value is calculated based on the aggregated IVx for the expirations, and the aggregated IVx value for weekly expirations updates less frequently due to lower trading volume. In such cases, we recommend enabling the "Only Monthly Expirations" option to smooth out the bell curve.
∑ Quant Observation:
The values of the expected move and the 1st standard deviation (1STD) will not match because they use different calculation methods, even though both are referred to as representing 68% of the underlying asset's movement in options literature. The expected move is based on direct market pricing of ATM options. The 1STD, on the other hand, uses the averaged implied volatility (IVX) for the given expiration to determine its value. Based on our experience, it is better to consider the area between the expected move and the 1STD as the true representation of the original 68% rule.
🔶 IVR Dashboard Panel Rows
🔹 IVR (IV Rank)
The Implied Volatility Rank (IVR) indicator helps options traders assess the current level of implied volatility (IV) in comparison to the past 52 weeks. IVR is a useful metric to determine whether options are relatively cheap or expensive. This can guide traders on whether to buy or sell options. We calculate IVrank, like TastyTrade does.
IVR Calculation:
IV Rank = (current IV - 52 week IV low) / (52 week IV high - 52 week IV low)
IVR Levels and Interpretations:
IVR 0-10 (Green): Very low implied volatility rank. Options might be "cheap," potentially a good time to buy options.
IVR 10-35 (White): Normal implied volatility rank. Options pricing is relatively standard.
IVR 35-50 (Orange): Almost high implied volatility rank.
IVR 50-75 (Red): Definitely high implied volatility rank. Options might be "expensive," potentially a good time to sell options for higher premiums.
IVR above 75 (Highlighted Red): Ultra high implied volatility rank. Indicates very high levels, suggesting a favorable time for selling options.
The panel refreshes automatically if the symbol is implemented. You can hide the panel or change the position and size.
🔹IVx (Implied Volatility Index)
The Implied Volatility Index (IVx) displayed in the option chain is calculated similarly to the VIX. The Cboe uses standard and weekly SPX options to measure the expected volatility of the S&P 500. A similar method is utilized to calculate IVx for each option expiration cycle.
For our purposes on the IVR Panel, we aggregate the IVx values specifically for the 35-70 day monthly expiration cycle . This aggregated value is then presented in the screener and info panel, providing a clear and concise measure of implied volatility over this period.
IVx Color coding:
IVx above 30 is displayed in orange.
IVx above 60 is displayed in red
IVx on curve:
The IVx values for each expiration can be viewed by hovering the mouse over the colored tooltip labels above the Curve.
IVx avg on IVR panel :
If the option is checked in the IVR panel settings, the IVR panel will display the average IVx values up to the optimal expiration.
Important Note:
The IVx value alone does not provide sufficient context. There are stocks that inherently exhibit high IVx values. Therefore, it is crucial to consider IVx in conjunction with the Implied Volatility Rank (IVR), which measures the IVx relative to its own historical values. This combined view helps in accurately assessing the significance of the IVx in relation to the specific stock's typical volatility behavior.
This indicator offers traders a comprehensive view of implied volatility, assisting them in making informed decisions by highlighting both the absolute and relative volatility measures.
🔹IVx 5 days change %
We are displaying the five-day change of the IV Index (IVx value). The IV Index 5-Day Change column provides quick insight into recent expansions or decreases in implied volatility over the last five trading days.
Traders who expect the value of options to decrease might view a decrease in IVX as a positive signal. Strategies such as Strangle and Ratio Spread can benefit from this decrease.
On the other hand, traders anticipating further increases in IVX will focus on the rising IVX values. Strategies like Calendar Spread or Diagonal Spread can take advantage of increasing implied volatility.
This indicator helps traders quickly assess changes in implied volatility, enabling them to make informed decisions based on their trading strategies and market expectations.
🔹 Vertical Pricing Skew
At TanukiTrade, Vertical Pricing Skew refers to the difference in pricing between put and call options with the same expiration date at the same distance (at expected move). We analyze this skew to understand market sentiment. This is the same formula used by TastyTrade for calculations.
We calculate the interpolated strike price based on the expected move , taking into account the neighboring option prices and their distances. This allows us to accurately determine whether the CALL or PUT options are more expensive.
PUT Skew (red): Put options are more expensive than call options, indicating the market expects a downward move (▽). If put options are more expensive by more than 20% at the same expected move distance, we color it lighter red.
CALL Skew (green): Call options are more expensive than put options, indicating the market expects an upward move (△). If call options are priced more than 30% higher at the examined expiration, we color it lighter green.
Vertical Skew on Curve:
The degree of vertical pricing skew for each expiration can be viewed by hovering over the points above the curve. Hover with mouse for more information.
Vertical Skew on IVR panel:
We focus on options with 35-70 days to expiration (DTE) for optimal analysis in case of vertical skew. Hover with mouse for more information.
This approach helps us gauge market expectations accurately, providing insights into potential price movements. Remember, we always evaluate the skew at the expected move using linear interpolation to determine the theoretical pricing of options.
🔹 Delta Skew 🌪️ (Twist)
We have a new metric that examines which monthly expiration indicates a "Delta Skew Twist" where the 16 delta deviates from the monthly STD. This is important because, under normal circumstances, the 16 delta is positioned between the expected move and the standard deviation (STD1) line (see Exp.mv & 1STD exact definitions above). However, if the interpolated 16 delta line exceeds the STD1 line either upwards or downwards, it represents a special case of vertical skew on the option chain.
Normal case : exp.move < delta16 < std1
Delta Skew Twist: exp.move < std1 < delta16
We indicate this with direction-specific colors (red/green) on the delta line. We also color the section of the delta curve affected by the delta skew in this case, even if you choose to display a lower delta, such as 30, instead of 16.
If "Colored Labels with Tooltips" is enabled, we also display a 🌪️ symbol in the tooltip for the expirations affected by Delta Skew.
If you have enabled the display of 'Vertical Pricing Skew' on the IVR Panel, a 🌪️ symbol will also appear next to the value of the vertical skew, and the tooltip will indicate from which expiration Delta Skew is observed.
🔹 Horizontal IVx Skew
In options pricing, it is typically expected that the implied volatility (IVx) increases for options with later expiration dates. This means that options further out in time are generally more expensive. At TanukiTrade, we refer to the phenomenon where this expectation is reversed—when the IVx decreases between two consecutive expirations—as Horizontal Skew or IVx Skew.
Horizontal IVx Skew occurs when: Front Expiry IVx < Back Expiry IVx
This scenario can create opportunities for traders who prefer diagonal or calendar strategies . Based on our experience, we categorize Horizontal Skew into two types:
Weekly Horizontal Skew:
When IVx skew is observed between two consecutive non-monthly expirations, the displayed value is the rounded-up percentage difference. On hover, the approximate location of this skew is also displayed. The precise location can be seen on this indicator.
Monthly Horizontal Skew:
When IVx skew is observed between two consecutive monthly expirations , the displayed value is the rounded-up percentage difference. On hover, the approximate location of this skew is also displayed. The precise location can be seen on our Overlay indicator.
The Monthly Vertical IVx skew is consistently more liquid than the weekly vertical IVx skew. Weekly Horizontal IVx Skew may not carry relevant information for symbols not included in the 'Weeklies & Volume Masters' preset in our Options Screener indicator.
If the options chain follows the normal IVx pattern, no skew value is displayed.
Color codes or tooltip labels above curve:
Gray - No horizontal skew;
Purple - Weekly horizontal skew;
BigBlue - Monthly horizontal skew
The display of monthly and weekly IVx skew can be toggled on or off on the IVR panel. However, if you want to disable the colored tooltips above the curve, this can only be done using the "Colored labels with tooltips" switch.
We indicate this range with colorful information bubbles above the upper STD line.
🔶 The Option Trader’s GRID System: Adaptive MurreyMath + Expiry Lines
At TanukiTrade, we utilize Enhanced MurreyMath and Expiry lines to create a dynamic grid system, unlike the basic built-in vertical grids in TradingView, which provide no insight into specific price levels or option expirations.
These grids are beneficial because they provide a structured layout, making important price levels visible on the chart. The grid automatically resizes as the underlying asset's volatility changes, helping traders identify expected movements for various option expirations.
The Option Trader’s GRID System part of this indicator can be used without limitations for all instruments . There are no type or other restrictions, and it automatically scales to fit every asset. Even if we haven't implemented the option metrics for a particular underlying asset, the GRID system will still function!
🔹 SETUP OF YOUR OPTIONS GRID SYSTEM
You can setup your new grid system in 3 easy steps!
STEP1: Hide default horizontal grid lines in TradingView
Right-click on an empty area of your chart, then select “Settings.” In the Chart settings -> Canvas -> Grid lines section, disable the display of horizontal lines to avoid distraction.
SETUP STEP2: Scaling fix
Right-click on the price scale on the right side, then select "Scale price chart only" to prevent the chart from scaling to the new horizontal lines!
STEP3: Enable Tanuki Options Grid
As a final step, make sure that both the vertical (MurreyMath) and horizontal (Expiry) lines are enabled in the Grid section of our indicator.
You are done, enjoy the new grid system!
🔹 HORIZONTAL: Enhanced MurreyMath Lines
Murrey Math lines are based on the principles observed by William Gann, renowned for his market symmetry forecasts. Gann's techniques, such as Gann Angles, have been adapted by Murrey to make them more accessible to ordinary investors. According to Murrey, markets often correct at specific price levels, and breakouts or returns to these levels can signal good entry points for trades.
At TanukiTrade, we enhance these price levels based on our experience , ensuring a clear display. We acknowledge that while MurreyMath lines aren't infallible predictions, they are useful for identifying likely price movements over a given period (e.g., one month) if the market trend aligns.
Our opinion: MurreyMath lines are not crystal balls (like no other tool). They should be used to identify that if we are trading in the right direction, the price is likely to reach the next unit step within a unit time (e.g. monthly expiration).
One unit step is the distance between Murrey Math lines, such as between the 0/8 and 1/8 lines. This interval helps identify different quadrants and is crucial for recognizing support and resistance levels.
Some option traders use Murrey Math lines to gauge the movement speed of an instrument over a unit time. A quadrant encompasses 4 unit steps.
Key levels, according to TanukiTrade, include:
Of course, the lines can be toggled on or off, and their default color can also be changed.
🔹 VERTICAL: Expiry Lines
The indicator can display monthly and weekly expirations as dashed lines, with customizable colors. Weekly expirations will always appear in a lighter shade compared to monthly expirations.
Monthly Expiry Lines:
You can turn off the lines indicating monthly expirations, or set the direction (past/future/both) and the number of lines to be drawn.
Weekly Expiry Lines:
You can display weekly expirations pointing to the future. You can also turn them off or specify how many weeks ahead the lines should be drawn.
Of course, the lines can be toggled on or off, and their default color can also be changed.
TIP: Hide default vertical grid lines in TradingView
Right-click on an empty area of your chart, then select “Settings.” In the Chart settings -> Canvas -> Grid lines section, disable the display of vertical lines to avoid distraction. Same, like steps above at MurreyMath lines.
🔶 ADDITIONAL IMPORTANT COMMENTS
- U.S. market only:
Since we only deal with liquid option chains: this option indicator only works for the USA options market and do not include future contracts; we have implemented each selected symbol individually.
- Why is there a slight difference between the displayed data and my live brokerage data? There are two reasons for this, and one is beyond our control.
- Brokerage Calculation Differences:
Every brokerage has slight differences in how they calculate metrics like IV and IVx. If you open three windows for TOS, TastyTrade, and IBKR side by side, you will notice that the values are minimally different. We had to choose a standard, so we use the formulas and mathematical models described by TastyTrade when analyzing the options chain and drawing conclusions.
- Option-data update frequency:
According to TradingView's regulations and guidelines, we can update external data a maximum of 5 times per day. We strive to use these updates in the most optimal way:
(1st update) 15 minutes after U.S. market open
(2nd, 3rd, 4th updates) 1.5–3 hours during U.S. market open hours
(5th update) 10 minutes before market close.
You don’t need to refresh your window, our last refreshed data-pack is always automatically applied to your indicator , and you can see the time elapsed since the last update at the bottom of your indicator.
- Skewed Curves:
The delta, expected move, and standard deviation curves also appear relevantly on a daily or intraday timeframe. Data loss is experienced above a daily timeframe: this is a TradingView limitation.
- Weekly illiquid expiries:
Especially for instruments where weekly options are illiquid: the weekly expiration STD1 data is not relevant. In these cases, we recommend checking in the "Display only Monthly labels" checkbox to avoid displaying not relevant weekly options expirations.
-Timeframe Issues:
Our option indicator visualizes relevant data on a daily resolution. If you see strange or incorrect data (e.g., when the options data was last updated), always switch to a daily (1D) timeframe. If you still see strange data, please contact us.
Disclaimer:
Our option indicator uses approximately 15min-3 hour delayed option market snapshot data to calculate the main option metrics. Exact realtime option contract prices are never displayed; only derived metrics and interpolated delta are shown to ensure accurate and consistent visualization. Due to the above, this indicator can only be used for decision support; exclusive decisions cannot be made based on this indicator . We reserve the right to make errors.This indicator is designed for options traders who understand what they are doing. It assumes that they are familiar with options and can make well-informed, independent decisions. We work with public data and are not a data provider; therefore, we do not bear any financial or other liability.
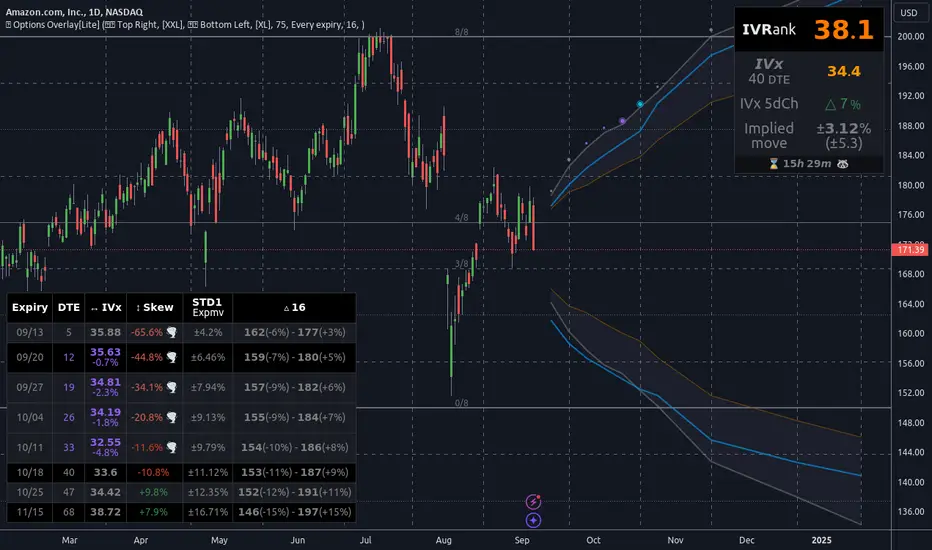
[Options Strategies] Selling Covered Calls and Puts (TSO) This trading indicator assists with traditional covered options trading strategies like Covered Calls, Covered Puts, and Cash Secured Puts. It also offers advanced features for trading options intelligently by utilizing options specific levels, such as BE (Break Even) and Strike (all visually shown on chart) in combination with S&R (Support and Resistance), Trend Lines, and other technical analysis tools such as MA (Moving Averages) and ATR Average True Range, all integrated within the indicator.
* Covered options approach over trading shares or options separately offers distinct advantages:
- Reduced Risk and Flexibility : Covered options strategy provides a more conservative approach by combining stock ownership with options trading. It reduces risk exposure compared to buying options outright or trading shares alone. Additionally, it offers flexibility in various market conditions.
- Profitability in Sideways Markets: Covered options allow for profitability in scenarios where the stock price is either moving optimally or remaining sideways. In contrast, just holding stocks might not yield significant gains in a sideways market, and buying options can result in losses due to time decay.
- Protection Against Price Movements: In covered options, if the stock price goes against the trade, the loss is mitigated by the premium received from selling the options. This provides a level of protection compared to other trading strategies where losses can accumulate more rapidly.
==============================================================
Strategies / Visual Examples:
---------------------------------------------------------------------------
---------------------------------------------------------------------------
Up to 3 Symbols can be monitored at the same time with alerts for each Symbol and a Stats Table. To see Symbol's visuals (Date Range, Strike, BE, etc.) - the chart has to be loaded with that Symbol. Here is an example of trading multiple stocks at same layout on different charts trading AAPL, BAC and TSLA.
---------------------------------------------------------------------------
---------------------------------------------------------------------------
An example of a Smart Covered Calls trading SPY.
STRATEGY EXPLANATION:
* Trade Open Trigger (Bullish/Sideway)
>>> S&R (Support and Resistance) or Trend Line broken, bounced off or simply near (if price is near/slightly crossing S&R/Trend Line > a bounce often takes place)
>>> Confirmation by additional TA (Technical Analysis) tools.
>>> EXAMPLE: Broken Resistance combined with a Trend Line up-bounce, confirmed by bullish 200EMA.
* TP (Take-Profit)
>>> Contracts Expire at Expiration date: Premium received for selling contracts kept.
>>> Assignment: Premium received for selling contracts kept + stock assigned/sold at a higher price than it was purchased.
* BE/SL (Break Even Stop-Loss) |
>>> BE/SL hit: stock sold at a slight loss with options contracts bought out (BTC - Buy to Close) at a lower price than initially sold (since price went down and these are calls), so technically the loss is reduced by the partial Premium still kept from initially sold contracts at trade open.
>>> Increasing the BE/SL distance: for wider BE/SL > Bid Price needs to be increased:
- Set longer Expiration date.
- Set closer Strike price.
NOTE: With longer Expiration date and closer Strike, chances of assignment increase as well. It's best to find an optimal level, where BE/SL is behind a Support/Resistance level and/or an established trend line and/or Large Length Moving Average, yet not extremely far away.
---------------------------------------------------------------------------
---------------------------------------------------------------------------
An example of a Smart Covered Puts trading SPY.
STRATEGY EXPLANATION:
* Trade Open Trigger (Bearish/Sideway)
>>> S&R (Support and Resistance) or Trend Line broken, bounced off or simply near (if price is near/slightly crossing S&R/Trend Line > a bounce often takes place)
>>> Confirmation by additional TA (Technical Analysis) tools.
>>> EXAMPLE: Broken Resistance combined with a Trend Line down-bounce, confirmed by bearish 200EMA.
* TP (Take-Profit)
>>> Contracts Expire at Expiration date: Premium received for selling contracts kept.
>>> Assignment: Premium received for selling contracts kept + stock assigned/bought-to-cover at a lower price than it was shorted.
* BE/SL (Break Even Stop-Loss) |
>>> BE/SL hit: stock bought-to-cover at a slight loss with options contracts bought out (BTC - Buy to Close) at a lower price than initially sold (since price went up and these are puts), so technically the loss is reduced by the partial Premium still kept from initially sold contracts at trade open.
>>> Increasing the BE/SL distance: for wider BE/SL > Bid Price needs to be increased:
- Set longer Expiration date.
- Set closer Strike price.
NOTE: With longer Expiration date and closer Strike, chances of assignment increase as well. It's best to find an optimal level, where BE/SL is behind a Support/Resistance level and/or an established trend line and/or Large Length Moving Average, yet not extremely far away.
---------------------------------------------------------------------------
---------------------------------------------------------------------------
An example of a Smart Secured Cash Puts trading SPY.
STRATEGY EXPLANATION:
* Trade Open Trigger (Bullish/Sideway)
>>> Bullish steady trend.
>>> Confirmation by additional TA (Technical Analysis) tools.
>>> EXAMPLE: Slowly rising price action above 200EMA.
* TP (Take-Profit)
>>> Early BTC: BTC (Buy to Close) before Expiration date if options premium/contract price already reduced by at least 50-90% (the reduced price is the profit, if premium lost 90% - only 10% will need to be paid to buy options out to close the trade) and if the stock price is nearing Resistance, Trend Line or big length moving average (like 200EMA) as a bounce may happen or even a potential reverse of the trend. If there is no trend reversal or a small correction bounce occurs, with further trend continuation > another Cash Secured Puts trade can be opened with new Expiration date and Strike.
>>> Contracts Expire at Expiration date: Premium received for selling contracts kept, considering the Strike was never hit.
>>> Assignment with stock closing below Strike and above/near BE (Break Even): Premium received for selling contracts kept. NOTE: It is best to get rid of the stock ASAP to then open a new Cash Secured Puts trade with lower Strike and a new Expiration date.
* BE/SL (Break Even Stop-Loss) |
>>> BE/SL hit: contracts bought out (BTC - Buy to Close) at a higher price than initially sold (since price went down and these are puts), the amount/difference in current contract price is the loss (as premium received + contract price increase is the total cost, which will have to be paid to buy the countracts out).
>>> Increasing the BE/SL distance: for wider BE/SL > Bid Price needs to be increased:
- Set longer Expiration date.
- Set closer Strike price.
NOTE: With longer Expiration date and closer Strike, chances of assignment increase as well. It's best to find an optimal level, where BE/SL is behind a Support/Resistance level and/or an established trend line and/or Large Length Moving Average, yet not extremely far away.
---------------------------------------------------------------------------
---------------------------------------------------------------------------
An example of Options Wheel strategy trading TQQQ. See how Strike and BE (Break Even) hits are displayed every time they occur.
STRATEGY EXPLANATION:
* Trade Open Trigger (Bullish/Sideway)
>>> Options Wheel strategy combines Cash Secured Puts with Covered Calls, so a steady bullish trend is preferred with lower volatility.
>>> It's best to start with Cash Secured Puts until assignment hits (stocks purchased), then switch to Covered Calls until assignment hits (stocks sold) and so on.
* TP (Take-Profit)
>>> Contracts Expire at Expiration date: Premium received for selling contracts kept.
>>> Assignment: Premium received for selling contracts kept. Stock is assigned (purchased if Cash Secured Puts were sold | sold if Covered Calls were sold ).
* BE/SL (Break Even Stop-Loss)
>>> Assignment is the stop-loss for this strategy, which ends current trade and starts next one. It is not a direct loss, but could result a long unrealized losses if after stock purchase assignment it goes down for a while or even a complete loss if low-cap company is used and it goes out of business.
>>> BE/SL distance can still be increased/kept optimal: for wider BE/SL > Bid Price needs to be increased:
- Set longer Expiration date.
- Set closer Strike price.
NOTE: With longer Expiration date and closer Strike, chances of assignment increase as well. It's best to find an optimal level, where BE/SL is behind a Support/Resistance level and/or an established Trend Line and/or Large Length Moving Average, yet not extremely far away.
| 3.0_wheel_strategy_tqqq_example.png
===========================================================================
Trading open/close/TP/SL labels, plots and colors explanations:
---------------------------------------------------------------------------
There are 3 approaches: Cashed Secured Puts, Covered Puts, Covered Calls. Here is an example showing all 3 (the Strikes, Bid prices, Expirations were chosen realistically).
>>> There are 3 symbol templates, the color can be changed for each and each symbol template can be unchecked to be fully hidden or all 3 can be used.
>>> Strike: dashed horizontal line plotted at chosen Strike, if Strike is hit within the Date Range - there will be a label shown.
>>> BE (Break Even): dotted horizontal line plotted at calculated BE, if BE is hit within the Date Range - there will be a label shown.
>>> Stock Purchased: solid horizontal line plotted at input price at which the stock was purchased.
>>> Date Range (STO >>> Expiration ): vertical lines with arrows (arrows direction is based on the approach), which connect Strike, BE (Break Even) and Stock Purchased creating an square/rectangle of the whole trade, making it easy to see everything at once.
>>> Stats Table: shows all the necessary data for each symbol.
===========================================================================
GLOBAL SETTINGS ///////////////////////////////////////////////////////////
---------------------------------------------------------------------------
>>> Show: week divider vertical lines: Will show vertical divider lines separating each week.
>>> Show: Mondays and Fridays: Will show M - for Monday, F - for Friday, T - for Tuesday (Tuesday will be shown if there is a Holiday on Monday)
---------------------------------------------------------------------------
OPTIONS SETUP: SYMBOL0X /////////////////////////////////////////////////// | (identical for all 3 symbols)
---------------------------------------------------------------------------
>>> Symbol0X | Show Table: Turns on symbol01, all visuals on chart, calculations, etc. Table can be separately hidden if desired.
>>> Label Size: Size of the labels on chart showing Strike, BE (Break Even), etc.
>>> Label Color: Color for all symbol0X labels.
>>> Text Color: Text color for all symbol0X labels.
>>> Options Trading Style: 1)Covered Calls: Bullish-sideways market approach (need to own 100 shares of stock per each contract sold), Strike price has to be set above the current stock price | 2)Covered Puts: Bearish-sideways market approach (need to own 100 shares of stock per each contract sold), Strike price has to be set below the current stock price | 3)Cash Secured Puts: Bullish-sideways approach (need to have enough cash to acquire shares at Strike price if hit), Strike price has to be set below the current stock price.
>>> # of contracts sold (1 contract > 100shares): # of contracts sold per trade, for Covered Calls and Covered Puts, every contract must be backed up by 100shares of the underlying stock.
>>> Price per 1 contract (Bid): Premium received per each contract sold.
>>> Strike Price.
>>> Stock Purchase Price: Stock purchase price (NOTE: This is only for Covered Call and Covered Puts, for Secured Cash Puts - stock is only purchased if at Expiration it closes beyond Strike price).
>>> STO (Sell to Open) Date: date at which the contracts were sold and Premium received.
>>> Exp (Expiration) Date: date at which contracts expire, if price never breaks the Strike at Expiration - contracts become worthless!
>>> Alert/Label: Futures Expire Soon: With this setting turned on, an Alert will trigger and a Label will be shown at opening of the first candle bar on the Expiration date. It will certainly be before the end of the day, however depending on the chart TimeFrame during alert creation - it may trigger at a different time. For Example: On a Daily chart TimeFrame SPY (S&P500) will trigger such alert at 9:30AM ET. ||| NOTE: Due to difference in timezones - the solid lines representing the STO >>> Exp range may be off by 1 business day from the date input in the indicator Settings > Inputs, so double check and calibrate the date by setting it 1 day behind/ahead from actual dates so that Alert is received on the actual Expiration date.
>>> Strike price Broken - Style: 'Close': Show/Alert Strike price broken only once candle bar is closed | 'Live': Show/Alert Strike price broken immediately once it happens, before candle bar is closed.
>>> Show: Strike price Broken: will show a label near candle bar breaking the Strike price.
>>> Alert: Strike price Broken: will alert at price breaking the Strike price.
>>> BE (Break Even) price Broken - Alert Style: 'Close': Show/Alert BE (Break Even) price broken only once candle bar is closed | 'Live': Show/Alert BE (Break Even) price broken immediately once it happens, before candle bar is closed.
>>> Show: BE (Break Even) price Broken: will show a label near candle bar breaking the BE price.
>>> Alert: BE (Break Even) price Broken: will alert at price breaking the BE price.
---------------------------------------------------------------------------
TA: TREND LINES ///////////////////////////////////////////////////////////
---------------------------------------------------------------------------
>>> Trend Lines - Uptrend/downtrend colors
>>> Show: Trend Lines: Show/Hide trend lines
>>> Show: Trend Line Breaks: Show/Hide labels where trend lines were broken
>>> Alert: Trend Line Breaks: Alert when trend line is broken
>>> Trend Lines - Search - Left Bars / Trend Lines - Search - Right Bars: how many candle bars will be used to calculate Trend Lines, the bigger the number > the more precise and less amount of trend lines will be found
>>> Trend Lines - Extend Setting
---------------------------------------------------------------------------
TA: S&R (SUPPORT AND RESISTANCE) //////////////////////////////////////////
---------------------------------------------------------------------------
>>> S&R (Support and Resistance) - Support/Resistance colors.
>>> Show: S&R (Support and Resistance) Top/Bottom Levels.
>>> Show: S&R (Support and Resistance) Top/Bottom Level Breaks: Show/Hide labels where support/resistance levels were broken
>>> Alert: S&R (Support and Resistance) Top/Bottom Level Breaks: Alert when S&R (Support and Resistance) level is broken
>>> S&R (Support and Resistance) - Search - Left Bars / S&R (Support and Resistance) - Search - Right Bars: how many candle bars will be used to calculate S&R (Support & Resistance) Levels, the bigger the number > the more precise and less amount of support and resistance levels will be found.
>>> S&R Search - Custom Resolution: This is a custom timeframe setting specifically for S&R Search, it disregards current chart timeframe. This is great to use for scalping, for example: with main chart set to 1min and the custom timeframe set to 3min or 5min - there will be stronger support/resistance levels with more detailed price action.
---------------------------------------------------------------------------
TA: ADDITIONAL TOOLS //////////////////////////////////////////////////////
>>> Show - MA (Moving Average).
>>> Show - ATR (Average True Range).
---------------------------------------------------------------------------
---------------------------------------------------------------------------
STATS TABLE ///////////////////////////////////////////////////////////////
Stats Table displays all the necessary date about each options setup.
>>> Table positioning
---------------------------------------------------------------------------
===========================================================================
Adding Alerts in TradngView
---------------------------------------------------------------------------
-Add indicator to chart and make sure to check/uncheck which alerts are required, then simply create it.
-Right-click anywhere on the TradingView chart
-Click on Add alert
-Condition: Select this indicator by it’s name
-Immediately below, change it to "alert() function calls only"
-Expiration: Open-ended (that may require higher tier TradingView account, otherwise the alert will need to be occasionally re-triggered)
-Alert name: Whatever you desire
-Hit “Create”
-Note: If you change ANY Settings within the indicator – you must DELETE the current alert and create a new one per steps above, otherwise it will continue triggering alerts per old Settings!
===========================================================================
If you have any questions or issues with the indicator, please message me directly via TradingView.
---------------------------------------------------------------------------
Good Luck! (NOTE: Trading is very risky, past performance is not necessarily indicative of future results, so please trade responsibly!)
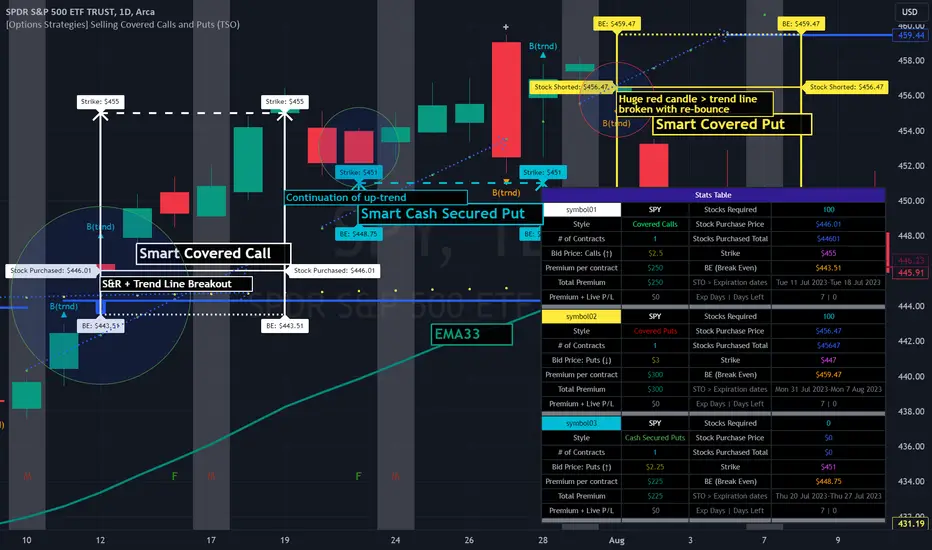
BE - Strategy Builder ToolkitIndicator vs Toolkit:
This is definitely not an indicator, hence this doesn't do any kind of analysis nor provide meaningful outputs where you can take trading decisions out of it.
This is a Strategy Builder Toolkit which works like any other broker/3P applications, which helps traders to build their own custom/ predefined strategies, save / deploy them at their wish.
Idea Behind Developing this Toolkit: I am sure many of traders have overcome scenarios where, on break of x level he wants to initiate straddle else he wants to initiate Iron Condor. Some of them wants to deploy custom strategies only at certain time or at certian price levels.
It becomes pretty difficult to track markets when you are away from desk and if you dont adjust the strategy legs, you are incurring big drawdowns. There are many if's and buts to deploy strategies.
To overcome such challenges, i have built this toolkit.
Note: As this is just a toolkit, you should conduct your analysis to gauge the market direction outside the perview of this. Once you know the view / direction of the script. you can use this toolkit in action to
1. Deploy Strategy at (Desired levels| Desired time|Confired Levels|Confirmed Volumes)
2. Strategy can be Prebuilt / Custom Built
3.1 Set SL, Target for Directional view (Trail SL aswell)
3.2 Set Upside or Downside Target for Non Directional view (Trail SL aswell)
3.3 let the strategy play with out SL|Targets for consolidation view.
4. Adjust Legs by closing existing position and opening fresh position or place fresh adjustments
5. Book partial Profits with in the zone.
How the Toolkit is buit: Script uses text related functions to understand the custom input given in the indicator and coverts into a strategy and deployes them as a algo trading (Next Level Bot) with the additional parameter set for SL|Target|Entry levels.
Understanding the settings:
1. Strike Difference: is basically a value between each strike. eg: Banknifty : 100, Nifty & Finnifty: 50
2. 1 Lot Qty: Qty per Lot accepted by exchange|Broker. eg: BNF: 15, Nifty: 50, Finnifty: 40
3. Lot Multiplier: If you build strategy with 1 lot and if you set the Lot multiplier as 2 then strategy gets deployed with 2 lots. for eg. If i have saved strategy to buy BNF 1 ITM with 1Lot and have set lot multipier to 3 then at the time of deploying the trade it pushes as 3 lots (3 * 15Qty per lot = 45Qty) of 1 ITM strike.
4. Symbol Name: Select the Symbol Name here.
5. Current & Next Week Expiry Date: Specify the expiry Dates in the format as supported by your broker.
6. Broker Name, Exchange & Product Type: hope it is self explanatory.
IMPORTANT settings to understand:
7. Triggere Entry Post (optional): You have to specify when you want to deploy the strategy. For instance, if i want to deploy my strategy at 30 min after market open which is 9:45 am, then i have specify as 0945. Another instance where i want to close my strategy at 3 PM then you have to specify as 1500. Uncheck this option if you are not worried about the time of entry.
My personal Used Case: On the Expiry -1 Day at 0916 (9:16AM) i will buy 6 lots of 8OTM PE & CE and Sell 2 lots 7OTM, 2 lots of 6OTM and 2 lots of 5OTM and close the trade by 1100 (11AM).
8. Price Levels (Confirmed vs UnConfirmed) (Optional): Confirmed is basically price is sustained at|around the specified price level, where in UnConfirmed is basically the touch of the specified level.
for instance if i want to deploy straddle only if price is sustained at 100. then, i would specify GE with 100 in price input settings, and check thee Confirmed price box. Assuming if LTP is running at 98 and with the above settings it will only deploy the trade upon price is sustained at 100 level for 3 to 5 candles not at the touch of 100.
Uncheck this option if you are not worried about the Entry Price.
9. Confirmed Volume (Optional) (Long or Short): Basis your view|direction of the strategy. you can get additional confirmation. At the time of entry you want volume to be present towards the direction of the strategy. Uncheck this option if you are not worried about the volume or Volume doesn't exist for the chart loaded.
10. Alert Types: It consists of 3 Long & 3 Short directional (prebuilt) strategy along with Close Strategy, Close Specified Symbols Only & Design Custom Strategy Option.
10.1 : Slow Upmove - If you are having bullish view and predict that prices shall go slow and steady. This strategy can be deployed where you get the benifit of time decay as well while the delta play in favor of you. (viseversa for Slow DownMove)
10.2 : Fast Upmove - If you are having bullish view and predict that prices shall go fast. This strategy can be deployed where you get the smaller benifit of time decay as well while the delta play in favor of you. (viseversa for Fast DownMove)
10.3 : Vol Upmove (Volatality)- If you are having bullish view and predict market is tend to be volatile. This strategy can be deployed where you get the benifit of volatility as well while the delta play in favor of you. (viseversa for VolDownMove)
10.4 : Close Trade - You can use this option close the deployed strategy completely.
10.5 : Close Symbols - You can use this option close few of the symbols for the strategy deployed.
10.6 : Custom: Use this option to design you own custom strayegy with the syntax below:
Sample 1:
N|B|C2|3
N refers to Nextweek Expiry (if C is used then Current week expiry)
B refers to Buy (if S is used then Sell)
C refers to Call | CE (if P is used then PE or Put)
2 refers to 2OTM (for CE any Postitive number refers to as OTM and for PE it will be treated as ITM strikes & 0 refers to as ATM - viseversa for Negative Numbers)
3 refers to as 3 Lot
With the syntax of N|B|C2|3 - strategy will be deployed as "Buy 3 lots of 2 OTM Call of Next expiry"
Sample 2:
C|S|P-3|3|10|30
Above syntax means: SELL Current Expiry 3 Lots of 3 OTM Put Strike with 10 SL and 30 TGT
Sample 3:
C|S|C10|3|Default
Above syntax means: SELL Current Expiry 3 Lots of 10 OTM CALL Strike with 50% SL and 95% TGT
Sample 4:
C|B|C-2|3|40%|50%
Above syntax means: BUY Current Expiry 3 Lots of 2 ITM CALL Strike with 40% SL and 50% TGT
Sample 5: Long Straddle
C|B|C0|3
C|B|P0|3
Above syntax means: BUY Current Expiry 3 Lots of ATM CALL & PUT Strike
Sample 6: Iron Butterfly
C|B|C1|1
C|S|C0|1
C|S|P0|1
C|B|P-1|1
Above syntax means: Sell Current Expiry 1 Lots of ATM CALL & PUT Strike and BUY 1OTM Call & Put Strike
Sample 7: Diagonal Spread
C|S|C2|1
C|S|P-2|1
N|B|C3|1
N|B|P-3|1
Above syntax means: Sell Current Expiry 1 Lots of 2OTM CALL & PUT Strike and BUY 3OTM Call & Put Strike of Next Expiry.
To Understand how to deploy Strategy with defined Adjustments. For instance i want to deploy Iron Condor with Adjustments for BNF when the price is currently running at 45000.
C|B-|C3|1
C|S*|C2|1
C|B--|P-3|1
C|S**|P-2|1
At:2|C|S|C2|1
At:2|C|B|C3|1
At:-2|C|S|P-2|1
At:-2|C|B|P-3|1
On:2|*
On:-2|**
On:2|-
On:-2|--
With the above syntax: Intial trades are placed with
BUY BANKNIFTY45300CALL(Current Expiry) 1 Lot
BUY BANKNIFTY44700PUT(Current Expiry) 1 Lot
SELL BANKNIFTY45200CALL(Current Expiry) 1 Lot
SELL BANKNIFTY44800PUT(Current Expiry) 1 Lot
Toolkit tracks the price and holds the adjustments.
We may start to bleed on the sold leg (45200CALL) once the price crosses 45200. Hence if the price crosses 2 strike upside as specified with syntax " On:2|* " where * is a character tagged to Sold Call Leg. it closes the 45200 Call.
Similarly, " On:2|- " where - is character tagged to Brought Call Leg. it closes the 45300 Call, as soon as prices reaches 2 strike upside.
At:2|C|S|C2|1
At:2|C|B|C3|1
With the At Statements you can place the fresh adjustments legs. Above syntax refers to Once the price reaches 45200 it places below adjustment legs.
BUY BANKNIFTY45500CALL(Current Expiry) 1 Lot
SELL BANKNIFTY45400CALL(Current Expiry) 1 Lot
Note: Similarly If prices reaches downside with the On and At Sytax it places the necessary adjustment legs accordingly.
11. SL & TGT - You can specify SL, TGT or Upside & Dowside TGT during the entry conditions and Stratey shall be closed upon hitting either the SL or TGT accordingly.
12. On % Tgt & Lock % SL: This option is used for Prebuilt strategy where you can lock the Profit | Set Revised SL upon hitting specified TGT percentage.
13. Close Symbols: This option is used if you select Alert type as Close Symbols (Ref - 10.5 : Close Symbols) for specified list of symbols Alert shall be pushed to close the open positions of those symbols.
DISCLAIMER: No sharing, copying, reselling, modifying, or any other forms of use are authorized for our documents, script / strategy, and the information published with them. This informational planning script / strategy is strictly for individual use and educational purposes only. This is not financial or investment advice. Investments are always made at your own risk and are based on your personal judgement. I am not responsible for any losses you may incur. Please invest wisely.
Happy to receive suggestions and feedback in order to improve the performance of the indicator better.

DEVPRO TradingDEVPRO Trading system comprises of the following:
D - Double (EMA and VWAP)
E - EMA
V - VWAP (current and previous day ending VWAP level)
P - Standard Pivot Point
R - RSI (Multi-time frame table is added at the top and traders can add standard RSI 14 as an additional non-overlay indicator)
O - OI data (not available for options trading in TV but trader can always check in their broker terminal)
Double EMA have been color coded in red and green for bullish and bearish trends.
Candles are colored for bullish (green), sideways (grey) and bearish (red) phases.
Setup to be traded with monthly options for stocks and weekly options for indices.
Bullish Setup:
RSI greater than 50
Current candle close above VWAP and previous day closing VWAP
Current candle close above daily Pivot
For option buying (Call option OI should be falling below its moving average 20 meaning short covering)
For option selling (Put option OI should be rising above its moving average 20 meaning Put writers confidence is increasing)
Book partial qty profits at R1/R2/R3 and/or exit completely on Doji candle low break
Bearish Setup:
RSI less than 50
Current candle close below VWAP and previous day closing VWAP
Current candle close below daily Pivot
For option buying (Put option OI should be falling below its moving average 20 meaning short covering)
For option selling (Call option OI should be rising above its moving average 20 meaning Call writers confidence is increasing)
Book partial qty profits at S1/S2/S3 and/or exit completely on Doji candle high break
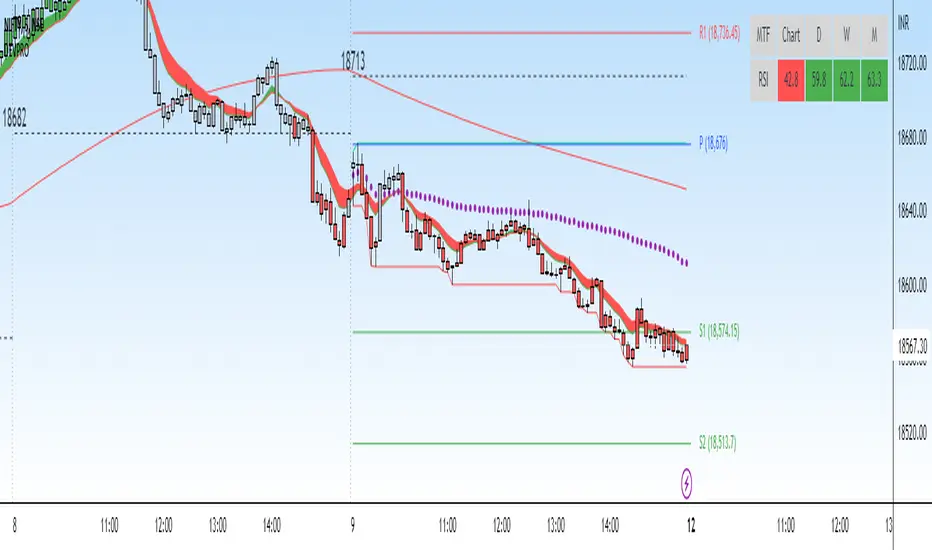
BUY/SELL + ADVANCE DECLINEThis script is a custom trading view indicator that helps to identify potential buy and sell signals based on the RSI (Relative Strength Index) and SMA (Simple Moving Average) indicators. The script also identifies potential reversals using a combination of RSI and price action. It plots buy, sell, and reversal signals on the chart along with an SMA line. Additionally, it provides alerts based on the buy, sell, and reversal conditions.
Changes made to the original script:
Fixed the undeclared identifier 'c' error by calculating the difference between the current closing price and the previous closing price: c = close - close .
Added an "ADD Value Floating Label" to the chart. The label shows the difference between the current and previous closing prices (ADD value) along with a "Bullish" or "Bearish" indicator based on the value of 'c'. The label is positioned at the top right of the visible chart area and remains static.
Here's a summary of the major components of the script:
Input settings: Define the input parameters for RSI and SMA.
Calculation of RSI and SMA: Compute the RSI and SMA values based on the input parameters.
Color definitions: Define colors for different conditions and levels.
Condition definitions: Define various conditions for buy, sell, reversal, and other criteria.
Buy and sell conditions: Determine buy and sell signals based on RSI, SMA, and price action.
Reversal conditions: Identify potential reversals using RSI and price action.
Plot signals: Display buy, sell, and reversal signals on the chart.
Bar colors: Color the bars based on the identified signals.
Plot SMA: Display the SMA line on the chart.
Alert conditions: Set up alerts for buy, sell, and reversal conditions.
ADD Value Floating Label: Add a label to the chart showing the ADD value and a "Bullish" or "Bearish" indicator.

Automated Option Price - Black-Scholes modelPlease make sure you are plotting this indicator on DAILY bars, not doing so will lead to unintended results. Also, make sure that you keep up to date the Risk-free interest rate, which you can consult (for U.S.) on ycharts.com.
This is an indicator that is meant to be used for Options Day Trading, but it can be useful for mid-term or leaps for I also enabled the possibility for user to input manually the Strike and Expiration date. I based the calculation on the Black-Scholes model. Variables included in the calculation are:
-Stock price (S): The current price of the underlying asset (e.g., a stock).
-Strike price (K): The predetermined price at which the option can be exercised.
-Time to expiration (T): The time remaining until the option expires, expressed as a fraction of a year.
-Volatility (σ): The annualized standard deviation of the stock's returns, which is a measure of the stock's price fluctuations.
-Risk-free interest rate (r): The annualized return on a risk-free investment, often approximated by the yield on a government bond.
The only variable I excluded from the original model was the Dividend yield (q).
U S E R I N P U T S:
1. AUTOMATIC calculations enabled:
i) Strike price (K):
Automatically calculate the strike price for both call and put options based on the stock's closing price. The logic follows a set of rules to determine the strike prices which will usually be Out-of-the-Money (OTM):
-If the stock's closing price is between 1 and 60, the call strike price is rounded up to the nearest whole number, while the put strike price is rounded down to the nearest whole number.
-If the stock's closing price is between 60 and 90, the call strike price is rounded up to the nearest whole number and increased by 1, while the put strike price is rounded down to the nearest whole number and decreased by 1.
-If the stock's closing price is between 90 and 120, the call strike price is rounded up to the nearest whole number and increased by 2, while the put strike price is rounded down to the nearest whole number and decreased by 2.
-If the stock's closing price is above 120, the call strike price is rounded up to the nearest multiple of 5, while the put strike price is rounded down to the nearest multiple of 5.
By applying these rules, I just tried to ensure that the automatically calculated strike prices are tailored to the stock's price range, allowing for more accurate option pricing calculations.
ii) Time to expiration (T):
The indicator will consider this week’s expiration contracts (Friday) only when the current day/bar = Monday. If Tuesday or older it will consider the expiration date of the next week’s Friday (because we are not Theta gamblers, right?).
If you are not comfortable with above for whatever reason, you can always…
2. Enter inputs MANUALLY
First make sure you UNTICK the boxes for automatic calculation.
i) Strike price (K) – Self-explanatory
ii) Time to expiration (T) – Just make sure that the horizon you are inputting matches with the next parameter (e.g. you would not input a Monthly risk-free interest rate for a Leap).
iii) Risk-free interest rate (r) – You can pull this data from the web. Here’s the link I used to define the value that this indicator was launched with:
ycharts.com
Don’t get obsessed with updating this daily if you are using this for day trading, you will notice that weekly may be more than enough.
V O L A T I L I T Y
Not option to manually input Volatility so I’ll explain how it is calculated in this script:
I considered two measures of volatility; one is derived calculating the annualized volatility using the standard deviation of daily returns and the second one is the ATR-based annualized volatility. I then used a ‘combined’ approach with the harmonic mean and the arithmetic mean of these results which can help account for the variability in the option prices calculated with different volatility estimates, which can be more robust when dealing with outliers or skewed data. I back tested with some samples of actual option prices and found that this approach is the one that got results closer to the actual bids.
T A B L E
Nomenclature to read rows is:
Option Strike Price | Type of Option (Put or Call) @ The current Close or at 50% level of bar | Estimated Price
*The Option expiration Date showed as dd-MMM as part of the headers.
Second and third row (color 1): These will show the calculated value for the Put/Call, assuming you are buying at the CURRENT price of the stock.
Third and Fifth row (color2): These will show the calculated value for the Put/Call, assuming you buy at the 50% level of the current bar (this is the value that the contract WOULD HAVE at the 50% level of the bar).
If you plot the indicator during market hours it will obviously update as price moves, this is an intended feature.
L I M I T A T I O N S
The Black-Scholes model, like many other models, has its limitations and will oftentimes provide inaccurate option prices in all market conditions. High volatility events, such as earnings announcements, can lead to significant price fluctuations that are not fully captured by the model.
The model assumes that the stock price follows a continuous random walk with constant volatility, but in reality, volatility can change over time, and stock prices can exhibit jumps, especially around significant events like earnings announcements. This can cause the model to underestimate the true option price in such situations.
Please make sure that you first back test on the symbols you trade to ensure the information presented by this indicator will suit your trading strategy. You will find that the delta between the proposed price of the indicator versus the actual price may differ significantly in some symbols while for others it will be very close. For instance, today (13APR23), the prices for AMD, DIS, AAPL (puts only), were very close to actual bids, whereas TSLA differ significantly (but then again, take a look at the calendar and this last symbol is having earnings next week which may add a premium to the contracts)… I am sure you will get your own conclusions and applicable use cases based on the data you test with.
As always, be wise and methodical on the investment or trading decisions you make!
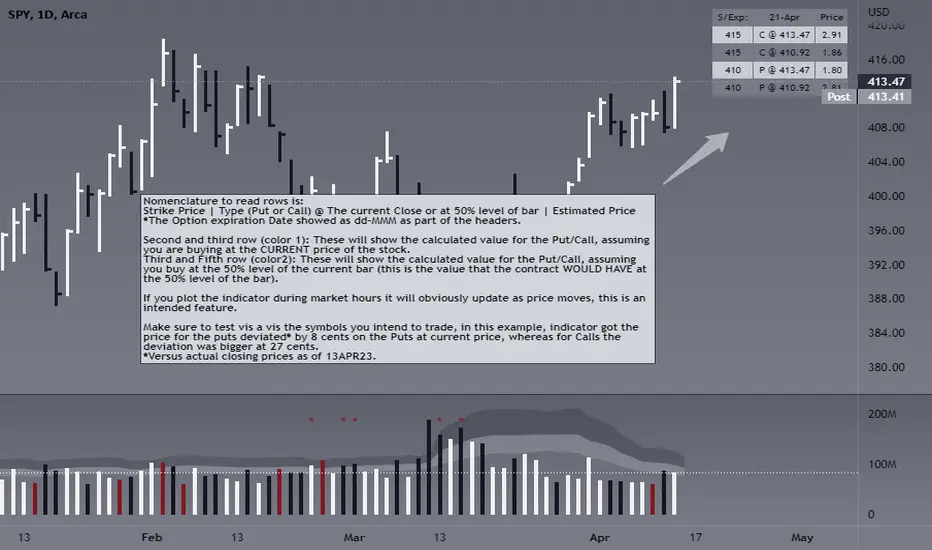
Options Price CalculatorIn the team, we continue to explore and expand the boundaries of TradingView.
For now, there is not much an options trader can do with options in TradingView.
We wanted to change that and created a simple option pricer.
You can set up in parameters a set of strikes, implied volatility, and days to expiry.
The indicators will take a risk-free rate from US01Y and the underlying price from your current chart.
It will compute prices and greeks for both put and call options.
Thanks to @MUQWISHI for helping code it.
Disclaimer
Please remember that past performance may not indicate future results.
Due to various factors, including changing market conditions, the strategy may no longer perform as well as in historical backtesting.
This post and the script don’t provide any financial advice.
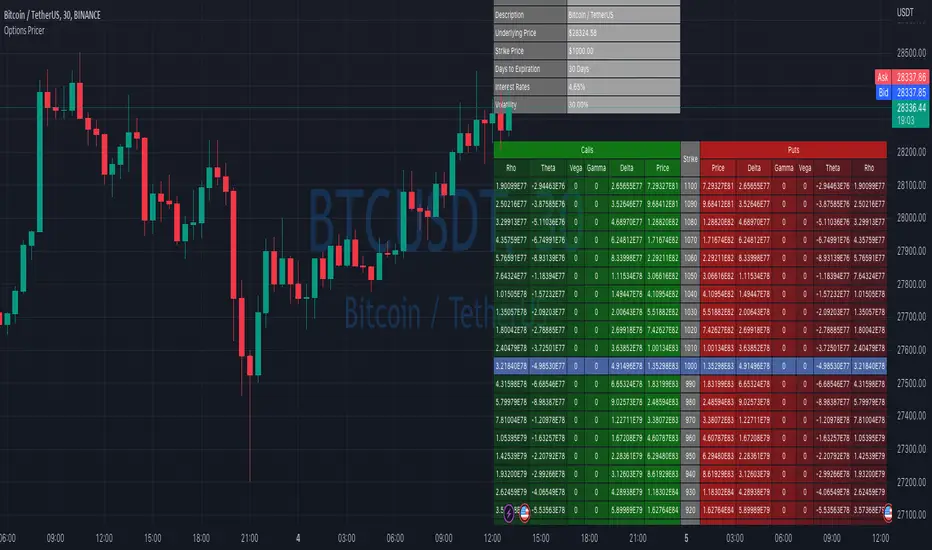
Effortless ContinuationIntroduction:
The Effortless Continuation Indicator is a technical analysis tool designed for traders to identify potential buy and sell signals in the market. This indicator combines three popular technical indicators - Moving Average Convergence Divergence (MACD), Triple Exponential Moving Average (TEMA), and Double Exponential Moving Average (DEMA) - to generate buy and sell signals. It is suitable for use on any time frame, from intraday trading to swing trading and longer-term investing.
Indicator Components:
The indicator comprises of three main components: MACD, TEMA, and DEMA.
Moving Average Convergence Divergence (MACD):
The MACD is a momentum indicator that measures the difference between two moving averages of the price of an asset. It is calculated by subtracting the 26-period Exponential Moving Average (EMA) from the 12-period EMA. The MACD line is used to identify changes in momentum, trends, and potential buy and sell signals.
Triple Exponential Moving Average (TEMA):
The TEMA is a type of Moving Average that takes multiple EMA values and applies a triple smoothing to them. This allows the TEMA to react more quickly to changes in price trends than traditional moving averages. The TEMA line is used as an additional confirmation for potential buy and sell signals.
Double Exponential Moving Average (DEMA):
The DEMA is similar to the TEMA but applies double smoothing to the EMA values. It is used as a signal line to confirm buy and sell signals generated by the MACD and TEMA.
Signal Generation:
The Effortless Continuation Indicator generates buy and sell signals based on the crossover and crossunder of the MACD and DEMA lines, as well as the price being above or below the TEMA line. Long signals are generated when the MACD crosses above the DEMA and the price is above the TEMA. Short signals are generated when the MACD crosses below the DEMA and the price is below the TEMA.
Chop Sensitivity:
The indicator has a user-adjustable "Chop Sensitivity" setting, which allows traders to adjust the ATR sensitivity for long and short signals. ATR is a volatility indicator that measures the average range of price movements over a given period of time. The default value is set to 0.5 ATR, which means that long and short signals will not be generated if the price is within 0.5 ATR of the TEMA.
Alerts:
The Effortless Continuation Indicator has built-in alerts for both long and short signals. It also includes a single alert that will trigger for both long and short signals. This allows traders to stay informed of potential trading opportunities even when they are not actively monitoring the markets.
Conclusion:
The Effortless Continuation Indicator is a powerful technical analysis tool that can help traders identify potential buy and sell signals in the market. It is easy to use and can be customized to suit individual trading styles and preferences. It is important to note that this indicator does not predict the market, but rather provides potential signals that should be confirmed with additional technical and fundamental analysis. With its advanced signal generation and alert features, the Effortless Continuation Indicator can be a valuable addition to any trader's toolbox.
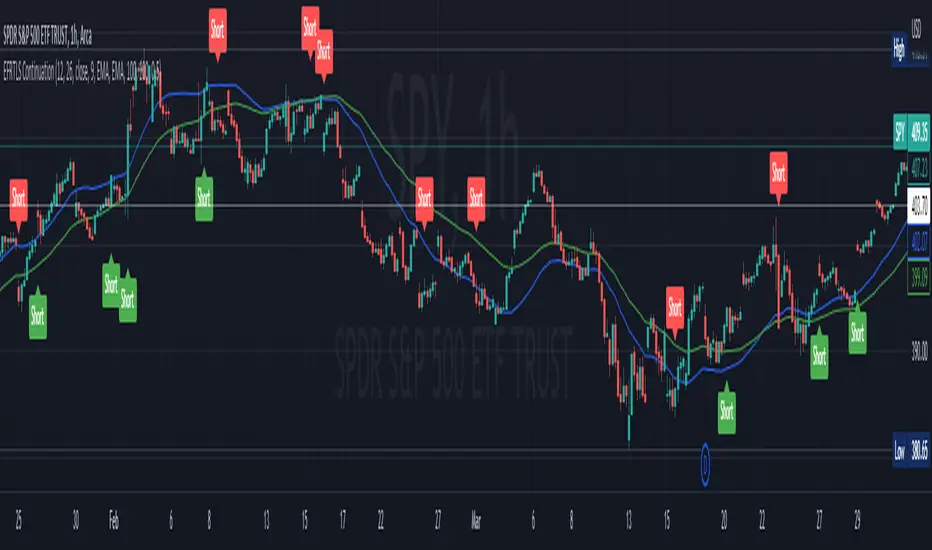
SPX IC Intraday & StatsThis indicator was designed for traders who make intraday Iron Condors with the SPX.
It basically has 2 main parts:
Part 1:
The indicator shows the distance, in real time, between the current SPX price and the IC selling wings (calls and puts wings) that have been selected. This result is displayed in percentages and in points. In the upper right corner (for calls) and lower right corner (for puts). The label will change color as the price moves closer to or further away from the sell strike. Darker red color as it approaches the wings, lighter green color as the price approaches the center of the Iron Condor.
Part 2:
Statistical dashboard showing the number of times in the past that from a certain hour (the current time) to the market close (4pm US East Time) the SPX moved outside or inside the width of the selected wings. The position of the table is configurable. By default, it's in the upper right corner.
Dashboard:
First Date: the first day of the sample (this varies depending on the timeframe, the higher the timeframe the larger the sample is, as TradingView counts more bars backwards, by default TV offers 10000 bars for the PRO version). Recommended 5 minutes.
Range Time: refers to the time range of the sample. From the current time to 4pm (US East Time).
Deviation Wing (%): It's the deviation (in percentage) based on the current time, from the current SPX price to the wing strikes. It takes the smaller value, either call or put wing.
Total Days: the number of days in the sample.
In range Days: the number of days that the price remained in that range from the current time to the market close.
Out of Range Days: the number of days the price ended outside that range from the current time to the market close.
Configuration:
Open Time (Hour): IC opening hour.
Open time (Minute): IC opening minutes.
Width Wings: width of the wings from the SPX price at the configured time.
Mini Rectangles: Refers to include within the IC 4 deviations (mini rectangles) to better visualize where the SPX price is with reference to the wings. Darker red color as it gets closer to the wings, lighter green color as the price gets closer to the center of the Iron Condor.
Add SMAs: Add SMAs 8, 20 and 50 to the IC chart.
Include Fundamental Days: Include or not in the sample important news days. They are considered: FED Meetings, CPI Reports, Unemployment Reports, Powell Speech.
Include Days: (Monday, Tuesday, Wednesday, Thursday, Friday). Include (or not) in the sample the chosen days.
Apply Filters Since: Sampling start date. Per default: False.
Table Position: Dashboard position.
Note 1: It's recommended to use the Dark Theme Color of TradingView.
Note 2: this indicator will only work in intraday timeframes less than 30 minutes (1m, 2m, 5m, 10m, 15m, 30m) and will only show results while the market is open.
************************************
Spanish Version:
Este indicador fue diseñado para los traders que hacen intradías de Iron Condors con el SPX.
Básicamente cuenta con 2 partes principales:
Parte 1:
El indicador muestra la distancia, en tiempo real, entre el actual precio del SPX y las alas vendedoras (alas calls y puts) que se hayan seleccionado. Este resultado se muestra en porcentajes y en puntos. En la esquina superior derecha (para los calls) e inferior derecha (para los puts). El label cambiará de color a medida que el precio se acerque o aleje del precio de las alas. Color rojo más oscuro a medida que se acerque a las alas, color verde claro cuando el precio se acerque al centro del Iron Condor.
Parte 2:
Dashboard estadístico que muestra la cantidad de veces que desde una determinada hora (el tiempo actual) hasta el cierre del mercado (4pm US East Time) el SPX se movió fuera o dentro del ancho de las alas seleccionadas. La posición de la tabla es configurable. Por defecto esta en la esquina superior derecha.
Dashboard:
First Date: el primer día de la muestra (esto varía dependiendo el timeframe, a mayor timeframe la muestra es mayor, ya que TradingView contará más barras para atrás (por default TV ofrece 10000 barras para la versión PRO). Recomendado 5 minutos.
Range Time: se refiere al rango horario de la muestra. Desde la hora actual hasta las 4pm (US East Time)
Deviation Wing (%): Es la desviación en porcentaje en base a la hora actual, desde el precio actual del SPX hasta el ancho de las alas. Toma el menor valor, sea al ala call o al ala put.
Total Days: la cantidad de días de la muestra.
In range Days: la cantidad de días que el precio se mantuvo en ese rango desde la hora actual hasta el cierre del mercado
Out of Range Days: la cantidad de días que el precio terminó fuera de ese rango desde la hora actual hasta el cierre del mercado.
Configuración:
Open Time (Hour): Hora de apertura del IC.
Open time (Minute): Minutos de apertura del IC.
Width Wings: ancho de las alas desde el precio del SPX a la hora configurada.
MiniRectangles: Se refiere a incluir dentro del IC 4 desviaciones (mini rectángulos) para visualizar de mejor manera donde se encuentra el precio del SPX con referencia a las alas. Color rojo más oscuro a medida que se acerque a las alas, color verde claro cuando el precio se acerque al centro del Iron Condor.
Add SMAs: Agrega al cuadro las SMA 8, 20 y 50.
Include Fundamental Days: Incluye o no en la muestra días de noticias importantes. Son considerados: FED Meetings, CPI Reports, Unemployment Reports, Powell Speech.
Include Days: (Monday, Tuesday, Wednesday, Thursday, Friday). Incluye (o no) en la muestra los días elegidos.
Apply Filters Since: Fecha de comienzo del muestreo.
Table Position: Posición del dashboard.
Nota 1: se recomienda usar el Dark Theme Color de TradingView.
Nota 2: este indicador solo funcionará en temporalidades intradías menores a 30 minutos (1m,2m,5m,10m,15m,30m) y Solo mostrará resultados mientras el mercado esté abierto, o sea en tiempo real.
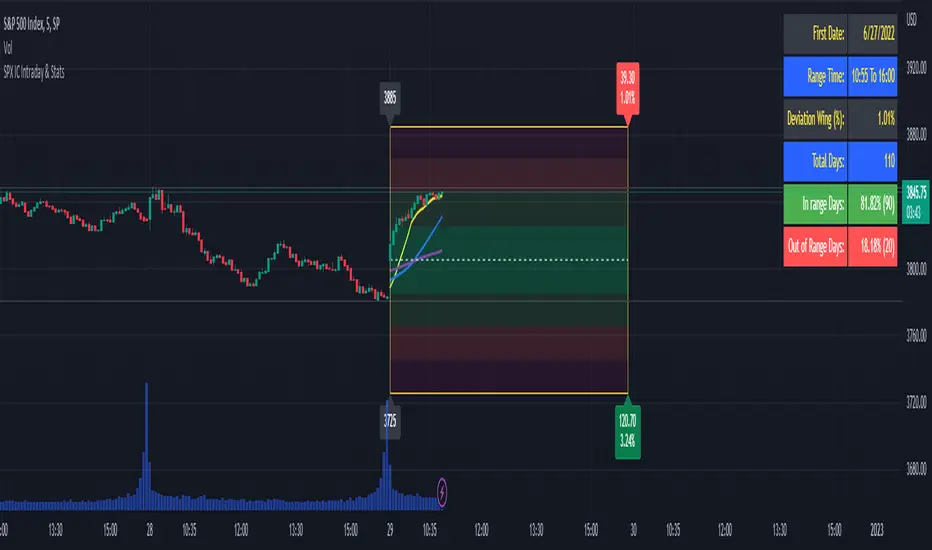
Volatility Cone [Loxx]When it comes to forecasting volatility, it seems that the old axiom about weather is applicable: "Everyone talks about it, but no one can do much about it!" Volatility cones are a tool that may be useful in one’s attempt to do something about predicting the future volatility of an asset.
A "volatility cone" is a plot of the range of volatilities within a fixed probability band around the true parameter, as a function of sample length. Volatility cone is a visualization tool for the display of historical volatility term structure. It was introduced by Burghardt and Lane in early 1990 and is popular in the option trading community. This is mostly a static indicator due to processor load and is restricted to the daily time frame.
Why cones?
When we enter the options arena, in an effort to "trade volatility," we want to be able to compare current levels of implied volatility with recent historical volatility in an effort to assess the relative value of the option(s) under consideration Volatility cones can be an effective tool to help us with this assessment. A volatility cone is an analytical application designed to help determine if the current levels of historical or implied volatilities for a given underlying, its options, or any of the new volatility instruments, such as VolContractTM futures, VIX futures, or VXX and VXZ ETNs, are likely to persist in the future. As such, volatility cones are intended to help the user assess the likely volatility that an underlying will go on to display over a certain period. Those who employ volatility cones as a diagnostic tool are relying upon the principle of "reversion to the mean." This means that unusually high levels of volatility are expected to drift or move lower (revert) to their average (mean) levels, while relatively low volatility readings are expected to rise, eventually, to more "normal" values.
How to use
Suppose you want to analyze an options contract expiring in 3-months and this current option has an current implied volatility 25.5%. Suppose also that realized volatility (y-axis) at the 3-month mark (90 on the x-axis) is 45%, median in 35%, the 25th percentile is 30%, and the low is 25%. Comparing this range to the implied volatility you would maybe conclude that this is a relatively "cheap" option contract. To help you visualize implied volatility on the chart given an expiration date in bars, the indicator includes the ability to enter up to three expirations in bars and each expirations current implied volatility
By ascertaining the various historical levels of volatility corresponding to a given time horizon for the options futures under consideration, we’re better prepared to judge the relative "cheapness" or "expensiveness" of the instrument.
Volatility options
Close-to-Close
Close-to-Close volatility is a classic and most commonly used volatility measure, sometimes referred to as historical volatility .
Volatility is an indicator of the speed of a stock price change. A stock with high volatility is one where the price changes rapidly and with a bigger amplitude. The more volatile a stock is, the riskier it is.
Close-to-close historical volatility calculated using only stock's closing prices. It is the simplest volatility estimator. But in many cases, it is not precise enough. Stock prices could jump considerably during a trading session, and return to the open value at the end. That means that a big amount of price information is not taken into account by close-to-close volatility .
Despite its drawbacks, Close-to-Close volatility is still useful in cases where the instrument doesn't have intraday prices. For example, mutual funds calculate their net asset values daily or weekly, and thus their prices are not suitable for more sophisticated volatility estimators.
Parkinson
Parkinson volatility is a volatility measure that uses the stock’s high and low price of the day.
The main difference between regular volatility and Parkinson volatility is that the latter uses high and low prices for a day, rather than only the closing price. That is useful as close to close prices could show little difference while large price movements could have happened during the day. Thus Parkinson's volatility is considered to be more precise and requires less data for calculation than the close-close volatility. One drawback of this estimator is that it doesn't take into account price movements after market close. Hence it systematically undervalues volatility. That drawback is taken into account in the Garman-Klass's volatility estimator.
Garman-Klass
Garman Klass is a volatility estimator that incorporates open, low, high, and close prices of a security.
Garman-Klass volatility extends Parkinson's volatility by taking into account the opening and closing price. As markets are most active during the opening and closing of a trading session, it makes volatility estimation more accurate.
Garman and Klass also assumed that the process of price change is a process of continuous diffusion (geometric Brownian motion). However, this assumption has several drawbacks. The method is not robust for opening jumps in price and trend movements.
Despite its drawbacks, the Garman-Klass estimator is still more effective than the basic formula since it takes into account not only the price at the beginning and end of the time interval but also intraday price extremums.
Researchers Rogers and Satchel have proposed a more efficient method for assessing historical volatility that takes into account price trends. See Rogers-Satchell Volatility for more detail.
Rogers-Satchell
Rogers-Satchell is an estimator for measuring the volatility of securities with an average return not equal to zero.
Unlike Parkinson and Garman-Klass estimators, Rogers-Satchell incorporates drift term (mean return not equal to zero). As a result, it provides a better volatility estimation when the underlying is trending.
The main disadvantage of this method is that it does not take into account price movements between trading sessions. It means an underestimation of volatility since price jumps periodically occur in the market precisely at the moments between sessions.
A more comprehensive estimator that also considers the gaps between sessions was developed based on the Rogers-Satchel formula in the 2000s by Yang-Zhang. See Yang Zhang Volatility for more detail.
Yang-Zhang
Yang Zhang is a historical volatility estimator that handles both opening jumps and the drift and has a minimum estimation error.
We can think of the Yang-Zhang volatility as the combination of the overnight (close-to-open volatility ) and a weighted average of the Rogers-Satchell volatility and the day’s open-to-close volatility . It considered being 14 times more efficient than the close-to-close estimator.
Garman-Klass-Yang-Zhang
Garman Klass is a volatility estimator that incorporates open, low, high, and close prices of a security.
Garman-Klass volatility extends Parkinson's volatility by taking into account the opening and closing price. As markets are most active during the opening and closing of a trading session, it makes volatility estimation more accurate.
Garman and Klass also assumed that the process of price change is a process of continuous diffusion (geometric Brownian motion). However, this assumption has several drawbacks. The method is not robust for opening jumps in price and trend movements.
Despite its drawbacks, the Garman-Klass estimator is still more effective than the basic formula since it takes into account not only the price at the beginning and end of the time interval but also intraday price extremums.
Researchers Rogers and Satchel have proposed a more efficient method for assessing historical volatility that takes into account price trends. See Rogers-Satchell Volatility for more detail.
Exponential Weighted Moving Average
The Exponentially Weighted Moving Average (EWMA) is a quantitative or statistical measure used to model or describe a time series. The EWMA is widely used in finance, the main applications being technical analysis and volatility modeling.
The moving average is designed as such that older observations are given lower weights. The weights fall exponentially as the data point gets older – hence the name exponentially weighted.
The only decision a user of the EWMA must make is the parameter lambda. The parameter decides how important the current observation is in the calculation of the EWMA. The higher the value of lambda, the more closely the EWMA tracks the original time series.
Standard Deviation of Log Returns
This is the simplest calculation of volatility . It's the standard deviation of ln(close/close(1))
Sampling periods used
5, 10, 20, 30, 60, 90, 120, 150, 180, 210, 240, 270, 300, 330, and 360
Historical Volatility plot
Purple outer lines: High and low volatility values corresponding to x-axis time
Blue inner lines: 25th and 75th percentiles of volatility corresponding to x-axis time
Green line: Median volatility values corresponding to x-axis time
White dashed line: Realized volatility corresponding to x-axis time
Additional things to know
Due to UI constraints on TradingView it will be easier to visualize this indicator by double-clicking the bottom pane where it appears and then expanded the y- and x-axis to view the entire chart.
You can click on each point on the graph to see what the volatility of that point is.
Option expiration dates will show up as large dots on the graph. You can input your own values in the settings.

Higher Time Frame Average True RangesPurpose: This script will help an options trader asses risk and determine good entry and exit strategies
Background Information: The true range is the greatest of: current high minus the current low; the absolute value of the current high minus the previous close; and the absolute value of the current low minus the previous close. The Average True Range (ATR) is a 14-day moving average of the true range. Traders use the ATR indicator to assess volatility in stocks and decide when to enter and exit trades. It is important to note the limitations of using True Range and ATR: These indications cannot tell you the direction of your options trade (call vs. put) and they cannot tell you whether a particular trend is about to reverse. However, it can be used to assess if volatility has peaked for a particular direction and time period.
How this script works: This indicator calculates true range for the daily (DTR), weekly (WTR), and monthly (MTR) time frames and compares it to the Average True Range (ATR) for each of those time frames (DATR, WATR, and MATR). The comparison is displayed into a colored table in the upper right-hand corner of the screen. When a daily, weekly, or monthly true range reaches 80% of its respective ATR, the row for that time frame will turn Orange indicating medium risk for staying in the trade. If the true range goes above 100% of the respective ATR, then the row will turn Red indicating high risk for staying in the trade. When the row for a time period turns red, volatility for the time period has likely peaked and traders should heavily consider taking profits. It is important to note these calculations start at different times for each time frame: Daily (Today’s Open), Weekly (Monday’s Open), Monthly (First of the Month’s Open). This means if it’s the 15th of the month then the Monthly True Range is being calculated for the trading days in the first half of the month (approximately 10 trade days).
The script also plots three sets of horizontal dotted lines to visually represent the ATR for each time period. Each set is generated by adding and subtracting the daily, weekly, and monthly ATRs from that time periods open price. For example, the weekly ATR is added and subtracted from Mondays open price to visually represent the true range for that week. The DATR is represented by red lines, the WATR is represented by the green lines, and the MATR is represented by the blue lines. These plots could also be used to assess risk as well.
How to use this script: Use the table to assess risk and determine potential exit strategies (Green=Low Risk, Orange=Medium Risk, Red=High Risk. Use the dotted lines to speculate what a stock’s price could be in a given time period (Daily=Red, Weekly=Green, and Monthly=Blue). And don’t forget the true range’s calculation and plots starts at the beginning of each time period!

TradeWithAB SignalsThis indicator specifically designed for Momentum trading by an Intraday trader on index( Nifty , BankNifty ) and Equity stocks. This indicator works with DMI and PRICE ACTIONS which gives automated Buy and Sell signals along with Stop loss and Trailing Stop loss when certain criteria are met. It is not a Holy Grail system that gives you continuous profits and it has some limited downfalls also which can be controlled by proper risk Management and position sizing. This is a premium invite only indicator which can be use after given access to you by us. There are some guidelines on how to use this indicator which are given below and you have to follow these guidelines very strictly to get the maximum results.
Guidelines :-
1. Default Timeframe - 5 min
2. You have to take almost all the trade generated by this indicator on a particular stock/index for better results.
3. Signal confirmation is required for enter the trade as it will give you maximum profits.
4. GREEN TRIANGLE is represented as BUY Signal whereas RED TRIANGLE is represented as SELL Signal.
5. GREEN ARROW is considered as BUY TRAILING STOP LOSS as well as BUY RE-ENTRY for some scenarios.
6. RED ARROW is considered as SELL TRAILING STOP LOSS and SELL RE-ENTRY for some scenarios.
7. Ignore the signals(if any) of 1st candle(9:15)and last candle(3:25)of the day for better results.
BUY Trade Management :-
1. Trade should be initiated if and only if there is a buy signal(Green Triangle) is generated.
2. You should only enter the trade at the CLOSE of the signal generated candle.
3. Your Stop loss should be placed at the LOW of the signal generated candle.
4. There is a trailing Stop loss signal (Green Arrow) after the buying signal is generated.
5. You should trail your Stop loss at the LOW of the trailing Stop loss signal generated candle.
6. You should trail your Stop loss repeatedly until your trailing Stop loss got hit and hence Exit your buy trade.
7. After Exiting the trade you always have option to re-enter at the next trailing Stop loss signal(green arrow) generated candle CLOSE and put your Stop loss at LOW of that candle and repeat the same trailing stop loss procedures.
SELL Trade Management :-
1. Trade should be initiated if and only if there is a sell signal(Red Triangle) is generated.
2. You should only enter the trade at the CLOSE of the signal generated candle.
3. Your Stop loss should be placed at the HIGH of the signal generated candle.
4. There is a trailing Stop loss signal (Red Arrow) after the selling signal is generated.
5. You should trail your Stop loss at the HIGH of the trailing Stop loss signal generated candle.
6. You should trail your Stop loss repeatedly until your trailing Stop loss got hit and hence Exit your sell trade.
7. After Exiting the trade you have always option to re-enter at the next trailing Stop loss signal(red arrow) generated candle CLOSE and put your Stop loss at HIGH of that candle and repeat the same trailing stop loss procedures.
Disclaimer :-
*I am not a SEBI Registered Analyst and shall not be liable for any profit, loss or liability resulting, directly or indirectly from the use and results of the indicator. This is not a Holy Grail setup, sometimes the traders hit Stop loss and sometimes it gives amazing results as well.
Instructions to access to this invite-only script:-
*Send us a message if you wish to gain access to this indicator. The subscribers will get benefits of any future development or updates in the current script without any extra charges. Other trading style like swing and positional trading will also available in future updates.
Dealar VIX Implied Range + Retracement LevelsThis Implied range Is derived by the VIX(1 sd annual +/- Implied move.)
This Indicator plots the daily Implied range, A lot of quantitative trading firms/ MM firms hedge their delta & gamma exposure around the Implied range(prop calc). I have added retracement levels as well, so you have more pivot levels.
Enjoy!

Ichi-Price WaveWelcome to the Ichi-Price Wave. This indicator is designed for day trading options contracts for any ticker, using a number of indicators — Ichimoku Cloud, Volume-Weighted Average Price, Stochastic Relative Strength Index, Exponential Moving Average (13/48) — and calculating how they interact with each other to provide entry and exit signals for both Calls and Puts on normal days. ****Read the Important Information section before opening any positions based on this indicator. (Also *NFA)
The general concept is that you, the trader, are a Surfer 🏄🏾 who rides the best waves in deep water until it gets dangerous.
Emoji storyline: The 🏄🏾 emoji (Call or Put, depending on the color of its Green or Red label, respectively) indicates an upcoming *potential* entry that, for a number of reasons, may be disregarded. (See: Important Information section below). And just as there are no certainties in the stock market itself, the tiered exit signals are ranked by low 🐬, medium 🦈 and high risk 🦑 tolerance. (In other words, it's relatively safe to surf with dolphins around, but there's the off chance they even strike trainers and become aggressive. It's more dangerous to swim with sharks. And on the unlikely, rare occasion you see a literal, giant, mythical, ship destroying Kraken 😬 ... you definitely need to get out of the water.
Surfing for as long as possible reaps the greatest rewards — but risk/reward are to be considered for entries and exits. Exiting every time you see a 🐬 (E1) should secure profits nearly 100% of the time, but they'll be very minimal. Whereas surfing til you reach a Kraken 🦑 (which will not even appear on most Price Wave cycles) would reap the most rewards. (NFA: I recommend considering sharks 🦈 as an exit point for the majority of positions, and perhaps only keeping a few runners open with the hopes of finding that shiny Kraken. (On the non-Emoji chart, the low, medium and high risk exits are named E1, E2 and E3, respectively. Got to the indicator's Settings > Inputs > then toggle EMOJIs ON/OFF)
Boring stuff: The entry 🏄🏾 signals are triggered by multiple conditions that must be all true. For Call entries, one of the necessary conditions is that the RSI's K must be maximum 10 (this can be changed in default). This, along with another condition where current price must be below the VWAP Lower Bound 1, serves as a great reference point showing the stock price is currently uncomfortable where it is and may likely soon snap back closer to the VWAP, perhaps even to the other side due to a pendulum effect.
Important information
Relying on those two factors for setting entry and exit points are great for normal days. (Normal, as in the ticker price bounces within a channel (e.g., ≤3% + or -) that's trending slightly bullish or bearish depending on greater market trend). But there are abnormal days where news catalysts (e.g., CPI data, CEO scandals, unexpected company data release, etc.) trigger FOMO and FUD, ultimately rendering the logic behind most indicators non applicable (e.g., RSI's "buy when oversold"). On the chart, this indicator accounts for this with two measures:
One, you should only "Surf" in the water. That is, there are two bands — Shallow and Deep Water. Any "Surf" emojis where price action is outside of the water should be ignored**. Two, there are additional EMOJIs that show you "Bearish trend" ⛈ and "Bullish trend ☀️. (Story time again: You obviously shouldn't surf in thunder and lightning. But also, surfing in the blistering sun with no clouds in the sky during a heatwave is also dangerous to your health.)
You can use these two measures to disregard the "surfers" suggesting you join them in opening a position in the suggested direction. And surfers followed by Cloud EMOJIs — 🌤️ (Put) or 🌧️ (Call) — can be used as "perfect entry" points. (The clouds represent weather being less extreme and better for surfing).
(**While these should mostly be ignored, these have not been muted because there is the possibility of a very strong turn around if you happen to catch the last one (which is not ideal for risk-averse traders). Use other indicators, such as the MACD and trend lines, to find potential bottoms (or tops) as price action plunges (or soars) due to abnormal news circumstances.)
Entry and exit buffers
At the beginning of each day, most indicators usually are not immediately calibrated correctly due to premarket trading and open market (at least to the degree that the day's sentiment can be best read from them due to the amount of volatility). What I recommend when using this indicator is disregarding signals during the first 15 minutes (or possibly 30 minutes) of market open to get the best results. And also, considering this indicator is meant for day trading (i.e., not holding positions overnight), disregarding ENTRY signals for the last 45 minutes of the trading day could give yourself enough buffer on the back end for exiting comfortably.
RSI entry
Preparing for an entry when you see a surfer is recommended, but actually opening the position when you see a 🌤️ (Put) or 🌧️ (Call) would yield best results and avoid misfires — particularly when those two cloud EMOJIs are signaled when the RSI is overbought and K is at least 95 (Puts), or oversold and K at maximum 5 (Calls). (Story time logic: The cloud eclipsing the Sun means it's cooling off and better for surfing. And the rain cloud no longer having lightning means the "bearish" storm is possibly soon over).
Delta and the Greeks
You should experiment yourself, but keep in mind that this is for capitalizing off of a day's minor price swings (≤3% + or -). Entering a same day expiry contract that's deep OTM is not going to work with this indicator (even if you enter at a surfer 🏄🏾 and exit at a Kraken 🦑) because the price wave from one end to the other won't be enough to compensate for the other Greeks working against you. Use another indicator (or insider knowledge ... Just kidding, that's illegal, don't do that) if you want to buy those kind of contracts.
I personally purchase contracts w/ minimum 80% Implied Volatility and somewhere between 20-40 Delta. Having a nice range for yourself with these factors, depending also on the size of your own portfolio and the risk tolerance you have, will determine how much you're able to capitalize off successful entry and exits.
Tips
• I set stop losses 5-10% depending on the ticker. (e.g., $TSLA's volatility may require SL closer to 10% whereas using it on $SPY, a 5% could suffice). This is in addition to ignoring entry signals that don't meet the aforementioned two requirements (i.e., it's risky to Surf in shallow water, and you shouldn't try to Surf at all outside of the water, ref. Band 2 and outside of Band 2). Remember, this is the stock market — not the casino. We rely on strategy and risk management — not hope.
• It's recommended you use time intervals ≤ 5 min. (I use 1 minute and 5 min)
• Liquidity . Using these signals on a ticker with low liquidity (particularly if you enter on the Ask side), can reduce your profits to 0% or even to a loss even if you have a perfect entry and exit. I always point to SPY as the optimal bid-ask spread, but keep that in mind.
What's with the name "Ichi-Price Wave"?
The "Ichi" gives credit to Japanese journalist Goichi Hosoda, whose indicator I used in conjunction with the 13/48 Exponential Moving Averages to create some of the exit signal conditions (e.g., E2🦈). That E2 condition is: Signal the first time the price intersects the Ichimoku conversion line *after* it has entered the VWAP UB/LB channel on one end and has exited on the opposite end). And it's named "Price Wave" because it's a literal price wave, which is where the fun surf narrative comes in. Also, "Price" doubles as me naming it after myself (in a less pretentious way). It's actually convenient that my last name is literally Price. Almost as if I was born for this. Nonetheless, this indicator is far more accurate in spotting directional changes than the free 13/48 cross, which oddly enough, influencers are charging for access. It's free, but the code is protected, for now at least.
Try it out on any ticker and look at how accurately it catches the tops and bottoms (keeping in mind to ignore misfires according to the two measures and also setting ~5-10% stop losses). And of course, use this in conjunction with other indicators. Ignoring all of my other emojis and simply setting surfer 🏄🏾 alerts could serve as additional confirmations for your personal strategy. Or you could simply enter at a surfer 🏄🏾 and exit when it reaches VWAP (or at least increase your Stop Loss to sell at break even if it doesn't reach). That strategy is the most conservative and would secure consistent gains). AND AGAIN, use your stop losses. Either it makes a move or it doesn't. Simply re-enter at a better point if necessary.

Bhoomi INDICES 2.1Bhoomi 2.0 is a Market Directional Indicator. It predicts the same by plotting respective zones and Labels.
To request access and to know more Information please contact us here.
Bhoomi 2.0 INDICES works on the Major World Indices as listed on tradingview. More to come in future, but please find the current list below. If you do not see the INDEX you trades, please comment below and we will add that for you.
"SPCFD:SPX"
"TVC:IXIC"
"DJCFD:DJI"
"TVC:NI225"
"CBOE:VIX"
"TSX:TSX"
"TVC:UKX"
"XETR:DAX"
"EURONEXT:PX1"
"EURONEXT:PX1GR"
"EURONEXT:PX1NR"
"TVC:FTMIB"
"TVC:NI225"
"TVC:KOSPI"
"TVC:SHCOMP "
"SZSE:399001"
"HSI:HSI"
"TVC:STI"
"ASX:XJO"
"NZX:NZ50G"
"TWSE:TAIEX"
"FTSEMYX:FBMKLCI"
"IDX:COMPOSITE"
"TVC:SX5E"
"BME:IBC"
"SIX:SMI"
"GPW:WIG20"
"EURONEXT:AEX"
"EURONEXT:BEL20"
"INDEX:BEL20"
"MOEX:IMOEX"
"OMXHEX:OMXH25"
"OMXICE:OMXI10"
"OMXSTO:OMXS30"
"OMXCOP:OMXC25"
"BELEX:BELEX15"
"OMXRSE:OMXRGI"
"OMXTSE:OMXTGI"
"OMXVSE:OMXVGI"
"BIST:XU100"
"TASE:TA35"
"TVC:SA40"
"NSE:NIFTY"
"BSE:SENSEX"
"DFM:DFMGI"
"TADAWUL:TASI"
"QSE:GNRI"
"BAHRAIN:BSEX"
"NSENG:NSE30"
"EGX:EGX30"
"BMFBOVESPA:IBOV"
"BMV:ME"
"BYMA:IMV"
"BVC:ICAP"
"BCS:SP_IPSA"
"BVL:SPBLPGPT"
"CURRENCYCOM:US500"
"CURRENCYCOM:US300"
"CURRENCYCOM:US100"
"CURRENCYCOM:US30"
"INDEX:DEU30"
"CBOE:VXD"
INDEX:DE40