samc's - Keltner OscillatorThe KELTNER CHANNEL is a widely used technical indicator developed in the 60's by Chester W. Keltner who described it in his 1960 book How To Make Money in Commodities.
so i took the logic, simplified the code and made into an oscillator.
to add a flavor of modern times you can choose among 10 different colorways themes in the settings. (so traders can adjust it for dark or light charts)
Although the initial idea was developed for stocks and commodities, I've carefully back tested this as an oscillator across FX MAJORS , MINORS and high liquidity stocks for the use case of scalping and Medium term trade ideas.
now, this indicator works successfully over all time frames, custom time frames and all assets.
This script builds on the same approach as my earlier session tool — keeping things clean, visual, and easy to read.
I intend to publish more of my work as i develop them from Beta ideas into stable scripts, and i welcome feedback.
Oscillaltor
Multi-Timeframe Bollinger BandsMy hope is to optimize the settings for this indicator and reintroduce it as a "strategy" with suggested position entry and exit points shown in the price pane.
I’ve been having good results setting the “Bollinger Band MA Length” in the Input tab to between 5 and 10. You can use the standard 20 period, but your results will not be as granular.
This indicator has proven very good at finding local tops and bottoms by combining data from multiple timeframes. Use timeframes that are lower than the timeframe you are viewing in your price pane. Be cognizant that the indicator, like other oscillators, does occasionally produce divergences at tops and bottoms.
Any feedback is appreciated.
Overview
This indicator is an oscillator that measures the normalized position of the price relative to Bollinger Bands across multiple timeframes. It takes the price's position within the Bollinger Bands (calculated on different timeframes) and averages those positions to create a single value that oscillates between 0 and 1. This value is then plotted as the oscillator, with reference lines and colored regions to help interpret the price's relative strength or weakness.
How It Works
Bollinger Band Calculation:
The indicator uses a custom function f_getBBPosition() to calculate the position of the price within Bollinger Bands for a given timeframe.
Price Position Normalization:
For each timeframe, the function normalizes the price's position between the upper and lower Bollinger Bands.
It calculates three positions based on the high, low, and close prices of the requested timeframe:
pos_high = (High - Lower Band) / (Upper Band - Lower Band)
pos_low = (Low - Lower Band) / (Upper Band - Lower Band)
pos_close = (Close - Lower Band) / (Upper Band - Lower Band)
If the upper band is not greater than the lower band or if the data is invalid (e.g., na), it defaults to 0.5 (the midline).
The average of these three positions (avg_pos) represents the normalized position for that timeframe, ranging from 0 (at the lower band) to 1 (at the upper band).
Multi-Timeframe Averaging:
The indicator fetches Bollinger Band data from four customizable timeframes (default: 30min, 60min, 240min, daily) using request.security() with lookahead=barmerge.lookahead_on to get the latest available data.
It calculates the normalized position (pos1, pos2, pos3, pos4) for each timeframe using f_getBBPosition().
These four positions are then averaged to produce the final avg_position:avg_position = (pos1 + pos2 + pos3 + pos4) / 4
This average is the oscillator value, which is plotted and typically oscillates between 0 and 1.
Moving Averages:
Two optional moving averages (MA1 and MA2) of the avg_position can be enabled, calculated using simple moving averages (ta.sma) with customizable lengths (default: 5 and 10).
These can be potentially used for MA crossover strategies.
What Is Being Averaged?
The oscillator (avg_position) is the average of the normalized price positions within the Bollinger Bands across the four selected timeframes. Specifically:It averages the avg_pos values (pos1, pos2, pos3, pos4) calculated for each timeframe.
Each avg_pos is itself an average of the normalized positions of the high, low, and close prices relative to the Bollinger Bands for that timeframe.
This multi-timeframe averaging smooths out short-term fluctuations and provides a broader perspective on the price's position within the volatility bands.
Interpretation
0.0 The price is at or below the lower Bollinger Band across all timeframes (indicating potential oversold conditions).
0.15: A customizable level (green band) which can be used for exiting short positions or entering long positions.
0.5: The midline, where the price is at the average of the Bollinger Bands (neutral zone).
0.85: A customizable level (orange band) which can be used for exiting long positions or entering short positions.
1.0: The price is at or above the upper Bollinger Band across all timeframes (indicating potential overbought conditions).
The colored regions and moving averages (if enabled) help identify trends or crossovers for trading signals.
Example
If the 30min timeframe shows the close at the upper band (position = 1.0), the 60min at the midline (position = 0.5), the 240min at the lower band (position = 0.0), and the daily at the upper band (position = 1.0), the avg_position would be:(1.0 + 0.5 + 0.0 + 1.0) / 4 = 0.625
This value (0.625) would plot in the orange region (between 0.85 and 0.5), suggesting the price is relatively strong but not at an extreme.
Notes
The use of lookahead=barmerge.lookahead_on ensures the indicator uses the latest available data, making it more real-time, though its effectiveness depends on the chart timeframe and TradingView's data feed.
The indicator’s sensitivity can be adjusted by changing bb_length ("Bollinger Band MA Length" in the Input tab), bb_mult ("Bollinger Band Standard Deviation," also in the Input tab), or the selected timeframes.

Relative Volatility Mass [SciQua]The ⚖️ Relative Volatility Mass (RVM) is a volatility-based tool inspired by the Relative Volatility Index (RVI) .
While the RVI measures the ratio of upward to downward volatility over a period, RVM takes a different approach:
It sums the standard deviation of price changes over a rolling window, separating upward volatility from downward volatility .
The result is a measure of the total “volatility mass” over a user-defined period, rather than an average or normalized ratio.
This makes RVM particularly useful for identifying sustained high-volatility conditions without being diluted by averaging.
────────────────────────────────────────────────────────────
╭────────────╮
How It Works
╰────────────╯
1. Standard Deviation Calculation
• Computes the standard deviation of the chosen `Source` over a `Standard Deviation Length` (`stdDevLen`).
2. Directional Separation
• Volatility on up bars (`chg > 0`) is treated as upward volatility .
• Volatility on down bars (`chg < 0`) is treated as downward volatility .
3. Rolling Sum
• Over a `Sum Length` (`sumLen`), the upward and downward volatilities are summed separately using `math.sum()`.
4. Relative Volatility Mass
• The two sums are added together to get the total volatility mass for the rolling window.
Formula:
RVM = Σ(σ up) + Σ(σ down)
where σ is the standard deviation over `stdDevLen`.
╭────────────╮
Key Features
╰────────────╯
Directional Volatility Tracking – Differentiates between volatility during price advances vs. declines.
Rolling Volatility Mass – Shows the total standard deviation accumulation over a given period.
Optional Smoothing – Multiple MA types, including SMA, EMA, SMMA (RMA), WMA, VWMA.
Bollinger Band Overlay – Available when SMA is selected, with adjustable standard deviation multiplier.
Configurable Source – Apply RVM to `close`, `open`, `hl2`, or any custom source.
╭─────╮
Usage
╰─────╯
Trend Confirmation: High RVM values can confirm strong trending conditions.
Breakout Detection: Spikes in RVM often precede or accompany price breakouts.
Volatility Cycle Analysis: Compare periods of contraction and expansion.
RVM is not bounded like the RVI, so absolute values depend on market volatility and chosen parameters.
Consider normalizing or using smoothing for easier visual comparison.
╭────────────────╮
Example Settings
╰────────────────╯
Short-term volatility detection: `stdDevLen = 5`, `sumLen = 10`
Medium-term trend volatility: `stdDevLen = 14`, `sumLen = 20`
Enable `SMA + Bollinger Bands` to visualize when volatility is unusually high or low relative to recent history.
╭───────────────────╮
Notes & Limitations
╰───────────────────╯
Not a directional signal by itself — use alongside price structure, volume, or other indicators.
Higher `sumLen` will smooth short-term fluctuations but reduce responsiveness.
Because it sums, not averages, values will scale with both volatility and chosen window size.
╭───────╮
Credits
╰───────╯
Based on the Relative Volatility Index concept by Donald Dorsey (1993).
TradingView
SciQua - Joshua Danford

Mean Reversion & Momentum Hybrid | D_QUANT 📌 Mean Reversion & Momentum Hybrid | D_QUANT
📖 Description:
This indicator combines mean reversion logic, volatility filtering, and percentile-based momentum to deliver clear, context-aware buy/sell signals designed for trend-following and contrarian setups.
At its core, it merges:
A Bollinger Band % Positioning Model (BB%)
A 75th/25th Percentile Momentum System
A Volatility-Adjusted Trend Filter using RMA + ATR
All tied together with a dynamic gradient-style oscillator that visualizes signal strength and persistence over time — making it easy to track high-conviction setups.
Signals only trigger when all three core components align, filtering out noise and emphasizing high-probability turning points or trend continuations.
⚙️ Methodology Overview:
Bollinger Bands % (BB%):
Price is measured as a percentage between upper and lower Bollinger Bands (based on OHLC4). Entries are only considered when price exceeds custom BB% thresholds — emphasizing market extremes.
Volatility-Based Trend Filter (RMA + ATR):
A smoothed RMA baseline is paired with ATR to define trend bias. This ensures signals only occur when price deviates meaningfully beyond recent volatility.
Percentile Momentum Model (75th/25th Rank):
Price is compared against its rolling 75th and 25th percentile. If price breaks these statistical boundaries (adjusted by ATR), it triggers a directional momentum condition.
Signal Consensus Engine:
All three layers must agree — BB% condition, trend filter, and percentile momentum — before a buy or sell signal is plotted.
Gradient Oscillator Visualization:
Signals appear as a fading oscillator line with a gradient-filled area beneath it. The color intensity represents how “fresh” or “strong” the signal is, fading over time if not reconfirmed, offering both clarity and signal aging at a glance.
🔧 User Inputs:
🧠 Core Settings:
Source: Select the price input (default: close)
Bollinger Bands Length: Period for BB basis and deviation
Bollinger Bands Multiplier: Width of the bands
Minimum BB Width (% of Price): Prevents signals during low-volatility chop
📊 BB% Thresholds:
BB% Long Threshold (L): Minimum %B to consider a long
BB% Short Threshold (S): Maximum %B to consider a short
🔍 Trend Filter Parameters:
RMA Length: Period for the smoothed trend baseline
ATR Length: Lookback for ATR in trend deviation filter
⚡️ Momentum Parameters:
Momentum Length: Period for percentile momentum calculation
Mult_75 / Mult_25: ATR-adjusted thresholds for breakout above/below percentile levels
🎨 Visualization:
Bar Coloring: Highlights candles during active signals
Background Coloring: Optional background shading for signals
Show Oscillator Plot: Toggle the gradient-style oscillator
🧪 Use Case:
This indicator works well across all assets for trend identification. It is particularly effective when used on higher timeframes (e.g. 12H, 1D,2D) to capture mean reversion bounces or confirm breakouts backed by percentile momentum and volatility expansion.
⚠️ Notes:
This is not financial advice. Use in combination with proper risk management and confluence from other tools.

ZenAlgo - ADXThis open-source indicator builds upon the official Average Directional Index (ADX) implementation by TradingView. It preserves the core logic of the original ADX while introducing additional visualization features, configurability, and analytical overlays to assist with directional strength analysis.
Core Calculation
The script computes the ADX, +DI, and -DI based on smoothed directional movement and true range over a user-defined length. The smoothing is performed using Wilder’s method, as in the original implementation.
True Range is calculated from the current high, low, and previous close.
Directional Movement components (+DM, -DM) are derived by comparing the change in highs and lows between consecutive bars.
These values are then smoothed, and the +DI and -DI are expressed as percentages of the smoothed True Range.
The difference between +DI and -DI is normalized to derive DX, which is further smoothed to yield the ADX value.
The indicator includes a selectable signal line (SMA or EMA) applied to the ADX for crossover-based visualization.
Visualization Enhancements
Several plots and conditions have been added to improve interpretability:
Color-coded histograms and lines visualize DI relative to a configurable threshold (default: 25). Colors follow the ZenAlgo color scheme.
Dynamic opacity and gradient coloring are used for both ADX and DI components, allowing users to distinguish weak/moderate/strong directional trends visually.
Mirrored ADX is internally calculated for certain overlays but not directly plotted.
The script also provides small circles and diamonds to highlight:
Crossovers between ADX and its signal line.
DI crossing above or below the 25 threshold.
Rising ADX confirmed by rising DI values, with point size reflecting ADX strength.
Divergence Detection
The indicator includes optional detection of fractal-based divergences on the DI curve:
Regular and hidden bullish and bearish divergences are identified based on relative fractal highs/lows in both price and DI.
Detected divergences are optionally labeled with 'R' (Regular) or 'H' (Hidden), and color-coded accordingly.
Fractal points are defined using 5-bar patterns to ensure consistency and reduce false positives.
ADX/DI Table
When enabled, a floating table displays live values and summaries:
ADX value , trend direction (rising/falling), and qualitative strength.
DI composite , trend direction, and relative strength.
Contextual power dynamics , describing whether bulls or bears are gaining or losing strength.
The background colors of the table reflect current trend strength and direction.
Interpretation Guidelines
ADX indicates the strength of a trend, regardless of its direction. Values below 20 are often considered weak, while those above 40 suggest strong trending conditions.
+DI and -DI represent bullish and bearish directional movements, respectively. Crossovers between them are used to infer trend direction.
When ADX is rising and either +DI or -DI is dominant and increasing, the trend is likely strengthening.
Divergences between DI and price may suggest potential reversals but should be interpreted cautiously and not in isolation.
The threshold line (default 25) provides a basic filter for ignoring low-strength conditions. This can be adjusted depending on the market or timeframe.
Added Value over Existing Indicators
Fully color-graded ADX and DI display for better visual clarity.
Optional signal MA over ADX with crossover markers.
Rich contextual labeling for both divergence and threshold events.
Power dynamics commentary and live table help users contextualize current momentum.
Customizable options for smoothing type, divergence display, table position, and visual offsets.
These additions aim to improve situational awareness without altering the fundamental meaning of ADX/DI values.
Limitations and Disclaimers
As with any ADX-based tool, this indicator does not indicate market direction alone —it measures strength, not trend bias.
Divergence detection relies on fractal patterns and may lag or produce false positives in sideways markets.
Signal MA crossovers and DI threshold breaks are not entry signals , but contextual markers that may assist with timing or filtering other systems.
The table text and labels are for visual assistance and do not replace proper technical analysis or market context.

Mayfair Reversal Change✅ Mayfair Reversal Change — By EastWave Capital
Description:
The Mayfair Reversal Change indicator is a tool designed to help traders identify potential market turning points using Stochastic Oscillator behavior and filtered price action logic. It acts as a reversal signal filter and is particularly effective when the market is overextended (overbought/oversold) and about to revert from exhaustion zones.
🔍 How It Works:
This script monitors the Stochastic %K and %D crossovers and adds a custom logic layer to filter only high-quality reversal points:
Stochastic Filter Conditions:
Uses smoothed stochastic settings:
%K smoothing = 3
%D smoothing = 3
Only shows signals after %K crosses back below 80 (for Sell) or above 20 (for Buy)
This prevents signals from appearing too early during an active overbought or oversold phase.
Directional Confirmation Logic:
Bullish signal is printed only when %K re-enters below 20 after a confirmed stochastic crossover.
Bearish signal appears only when %K re-enters above 80.
This reduces false signals that occur during continued trending moves.
Toggle Switch:
A user-toggle input is included to enable or disable the reversal filter logic.
This gives flexibility for traders who want to test signals with or without the stochastic condition.
📈 How to Use:
Timeframes: Recommended for 5M, 15M, and 30M
Markets: Compatible with any market — FX, Gold, Indices, Crypto
Entry Approach:
Wait for signal after price has reached a potential extreme area.
Confirm with chart structure, support/resistance, or SMC zone.
Enter on confirmation, placing stop loss beyond the swing high/low.
Combine with trendline breaks or price imbalances (FVG) for extra confluence.
Can be used in combination with the Mayfair FX Scalper script for dual-layer confirmation.
⚠️ Important Notes:
Signals are visual only and should be confirmed with proper strategy.
This indicator does not execute or manage trades automatically.
Designed to assist with reversal setups but should not be used in isolation.
Always manage risk, use SL/TP, and avoid over-leveraging.

52SIGNAL RECIPE Hidden Volume52SIGNAL RECIPE Hidden Volume
◆ Overview
52SIGNAL RECIPE Hidden Volume is an innovative indicator that visualizes the hidden buying and selling strength behind the conventional volume candles. By analyzing the relative proportion of buying and selling within each candle’s price range, it splits the total volume into buy volume and sell volume. Displayed as color-coded bars (blue for buying, pink for selling) in a separate panel below the chart, it provides clear insight into the market’s buying and selling pressure.
Unlike standard volume indicators that only show total volume, this indicator reveals the underlying balance and shifts in buying and selling power, offering traders a deeper understanding of market dynamics.
Furthermore, when viewed alongside the traditional volume candles that everyone commonly uses, it helps traders interpret price movements and volume flows more comprehensively, enabling a more insightful analysis of overall market trends.
─────────────────────────────────────
◆ Key Features
- Buy/Sell Volume Ratio Analysis: Calculates the relative buy and sell ratios based on the candle’s price movement range
- Hidden Buying and Selling Strength Visualization: Separately displays buy volume (blue) and sell volume (pink) as stacked bars in a dedicated bottom panel
- Real-time Data Reflection: Captures immediate changes in market buying and selling pressure based on live volume data
- Clear Visual Distinction: Uses background shading to easily highlight periods of buying dominance (blue) or selling dominance (pink)
- Quantified Buy/Sell Balance: Displays the current buying vs selling ratio numerically on chart labels for quick reference
- Recommended Use with Traditional Volume Candles: Designed to be used together with commonly used volume candles for more comprehensive market flow interpretation
─────────────────────────────────────
◆ Trading Application Points
- Provides deeper insight into market sentiment compared to conventional volume bars
- Helps identify shifts in buying and selling power indicative of trend continuations or reversals
- Useful as a complementary tool alongside price action to better time entries and exits
─────────────────────────────────────
◆ Synergy With Other Indicators
- Combine with trend indicators (RSI, MACD, Moving Averages) to validate trend strength and momentum
- Use together with volume and order flow tools to enhance understanding of market participant behavior
─────────────────────────────────────
◆ Conclusion
52SIGNAL RECIPE Hidden Volume is a powerful and intuitive tool that unveils the balance of buying and selling forces concealed within the total volume. By visualizing buy and sell volumes separately and updating in real-time, it allows traders to grasp the subtle shifts in market pressure and make more informed trading decisions.
Especially when used together with the traditional volume candles commonly referenced by most traders, it enhances traders’ ability to interpret price movement combined with volume flow in a more multi-dimensional and precise way, ultimately supporting more effective trading strategies.
─────────────────────────────────────
※ Disclaimer: This indicator is provided as a supplementary analysis tool and should not be used as the sole basis for trading decisions. Past data does not guarantee future results. Always apply proper risk management.
52SIGNAL RECIPE Hidden Volume
◆ 개요
52SIGNAL RECIPE Hidden Volume은 일반적인 볼륨 캔들 뒤에 숨겨진 매수와 매도의 힘의 크기를 가시화하는 지표입니다. 각 캔들의 가격 움직임 범위 내에서 매수와 매도의 상대적인 비율을 계산해, 총 거래량을 매수 볼륨과 매도 볼륨으로 나누어 보여줍니다. 별도의 차트 하단 패널에 파란색 매수 볼륨과 분홍색 매도 볼륨을 컬러 막대 그래프로 시각적으로 구분하여 시장 내 거래 심리와 매수·매도 압력을 명확하게 파악할 수 있도록 지원합니다.
일반 거래량 지표가 단순한 거래량 수치만 제공하는 반면, 이 지표는 매수세와 매도세의 숨겨진 균형과 변화를 직관적으로 보여줘, 시장 내부의 매매 강도와 방향성을 깊이 있게 이해하는 데 유용합니다.
또한, 일반적으로 모두가 사용하는 볼륨 캔들과 함께 병행해 보면, 가격 변동과 거래량의 흐름을 더 입체적으로 분석할 수 있어서 시장 전체의 흐름을 해석하는 데 훨씬 용이합니다.
─────────────────────────────────────
◆ 주요 특징
- 매수·매도 거래 비율 분석: 캔들의 가격 변동 범위를 기준으로 매수와 매도 비율 산출
- 숨겨진 매수·매도 힘 시각화: 별도 차트 하단 패널에서 매수 볼륨(파란색)과 매도 볼륨(분홍색)으로 구분하여 가시화
- 실시간 반영: 실시간으로 변하는 거래량 데이터에 기반해 시장 내부 매수·매도 압력 변화 즉시 포착
- 심플한 시각적 구분: 색상과 배경으로 매수 우세 또는 매도 우세 구간을 직관적으로 표시
- 매수·매도 힘의 균형 이해 지원: 차트 상단 텍스트 라벨로 현재 매수/매도 비율을 숫자로 제공
- 볼륨 캔들과 병행 사용 권장: 모두가 사용하는 기본 볼륨 캔들과 함께 보면서 시장 흐름 해석에 활용 가능
─────────────────────────────────────
◆ 트레이딩 활용 포인트
- 기존 거래량 지표 대비 더 깊은 시장 심리 분석 가능
- 매수세와 매도세 간 힘의 균형 변화를 주목하여 추세 전환이나 지속 신호로 활용
- 가격 흐름과 결합해 진입 및 청산 타이밍 설정에 도움
─────────────────────────────────────
◆ 다른 지표와 조합 가능성
- 가격 추세 지표(RSI, MACD, 이동평균선 등)와 함께 사용해 추세 강도와 매수·매도 압력 동시 분석
- 거래량 및 주문장 지표와 결합하여 시장 참여자 심리 및 매매 동향 파악 강화
─────────────────────────────────────
◆ 결론
52SIGNAL RECIPE Hidden Volume은 일반 볼륨 캔들만으로는 알기 어려운 매수와 매도 간의 힘의 균형을 명확히 보여주는 강력하고 직관적인 지표입니다. 실시간 거래량 내 매수·매도 비율을 분리해 시각화함으로써, 트레이더들이 시장 내부의 숨겨진 힘의 흐름을 이해하고 이를 바탕으로 한 전략적 의사결정을 내릴 수 있도록 돕습니다.
특히 일반적으로 많이 사용하는 볼륨 캔들과 함께 병행하여 볼 때, 가격 변동과 함께 시장의 거래 심리를 더욱 입체적이고 정확하게 해석할 수 있어 훨씬 효과적인 매매 전략 수립이 가능합니다.
─────────────────────────────────────
※ 면책 조항: 본 지표는 투자 판단을 위한 보조 도구로 제공되며, 단독 의존해서는 안 됩니다. 과거 데이터에 기반한 분석이므로 미래 결과를 보장하지 않으며, 적절한 리스크 관리와 함께 사용하시기 바랍니다.

Signalgo BBSignalgo BB: Technical Overview
Signalgo BB is a Bollinger Bands (BB) indicator for TradingView, designed to provide a multi-dimensional view of volatility, trend, and trading opportunities within a single overlay. Below is a detailed, impartial explanation of its workings, inputs, and trading logic.
Core Mechanics
Signalgo BB operates on the principle of nested volatility bands and moving averages. It calculates:
Fast & Slow Bands: Two sets of Bollinger Bands (BB), using different moving average types (EMA or SMA), lengths, and standard deviation multipliers.
Volatility Cloud: A dynamic visual layer indicating when price is inside both, one, or neither band.
Filtering: A short-term RSI is used to confirm trend direction and filter out weak signals.
Inputs & Components
MA Type: Choice between EMA, SMA for both fast and slow MA calculations.
Fast/Slow Lengths
Fast/Slow Deviations
RSI Length/Thresholds
Show Cloud: Toggle for the visual volatility cloud.
Signal Mode: Band Break.
Prevent Repeated Signals: Option to suppress duplicate signals in the same direction.
TP/SL & Trailing Logic: Advanced, automated trade management with ATR-based distances, three take-profit levels, and a dynamic trailing stop.
Signal Generation
Band Break: Triggers when price crosses the fast BB band.
RSI Filter: All signals require RSI confirmation.
Prevent Repeated Signals: Optionally only marks the first breakout in a series to reduce overtrading.
Entry/Exit Marks: Labels are plotted for visual clarity, and signals can trigger TradingView alerts.
Trade Management
Stop Loss (SL): Set at a multiple of ATR from the entry price, adapting to current volatility.
Take Profits (TP1, TP2, TP3): Three levels scaled by risk-reward ratios, supporting partial exits.
Trailing Stop: After the first TP is hit, SL moves to breakeven and then trails at a user-defined multiple of ATR, locking in further gains.
Event Markers: Each TP, SL, and trailing stop event is labeled on the chart.
Direction State: The indicator tracks active trades, allowing for only one open position per direction at a time.
Cloud Visualization: The background color changes depending on whether price is inside both, one, or no bands, making it easier to visualize market conditions.
Multiple Signal Logics: It doesn’t just look at breakouts, it includes cloud crossings, mean reversion, and a choice of how to combine them.
Rigorous Filtering: Signals require RSI trend confirmation, reducing false entries during weak phases.
Automated Trade Management: Built-in TP/SL and trailing logic, dynamically adapting to volatility.
Signal Suppression: Option to prevent repeated signals, reducing noise and overtrading.
Customizable MA Types: Supports EMA, SMA, and a selection algorithm for future expansion.
Trading Strategy Application
Volatility Regimes: The cloud’s color indicates whether price is inside, between, or outside the bands, helping traders identify trending, ranging, or breakout conditions.
Signals: entries can be based on breakouts filtered by RSI trend strength.
Risk Management: All active trades are managed by TP/SL logic, trailing stops after TP1, and visual feedback on exits.
Visual Alerts: Both signals and TP/SL events are marked on the chart for manual review.
Flexibility: Users can switch modes or suppress repeated signals as needed, depending on trading style.
Practical Usage
Intraday to Swing: Suitable for timeframes from minutes to days, depending on the MA periods and volatility profile.
Manual or Automated: The visual overlay and alerts support both manual trading and automated strategies.
Education & Review: The colored cloud and event markers make it easy to review past price action and learn from signals.
What separates this indicator from traditional ones:
1. Dual Bollinger Bands
Traditional: Most indicators use a single set of Bollinger Bands (two standard deviations above/below a moving average).
Signalgo BB: Implements two sets of bands—a "fast" set (shorter moving average, narrower deviation) and a "slow" set (longer moving average, wider deviation). This provides both immediate (fast) and broader context (slow) for volatility and price action.
2. Volatility Cloud Visualization
Traditional: Standard Bollinger Bands display as two lines, with the area between sometimes shaded as a "band" but without dynamic color changes.
Signalgo BB: The background is colored differently depending on whether price is within both, one, or neither band, offering a visual "cloud" that distinguishes trending, ranging, or breakout regimes at a glance.
3. RSI Filtering
Traditional: Many indicators either don’t filter signals, or if they do, it’s not always configurable.
Signalgo BB: Adds an optional RSI filter, requiring signals to be confirmed by short-term RSI overbought/oversold conditions. This reduces false signals in range-bound or low-trend environments.
4. Prevention of Repeated Signals
Traditional: Most indicators will keep firing signals as long as conditions are met, which can cause overtrading.
Signalgo BB: Offers a user-toggleable option to suppress repeated signals in the same direction until the opposite signal occurs. This reduces noise for discretionary traders.
5. Integrated Trade Management
Traditional: Manual or separate coding is required for stop-loss, take-profit, and trailing stop logic.
Signalgo BB: Builds in dynamic, ATR-based stop-loss; up to three take-profit levels and a trailing stop that activates after the first TP is hit. All levels are visually plotted on the chart, and events (TP/SL hits) are labeled, aiding strategy review and automation.
6. Event Labeling and Alerts
Traditional: Alerts may exist for entry/exit, but rarely for each TP/SL event.
Signalgo BB: Places labels for every entry, exit, and TP/SL event. It also provides TradingView alertconditions for each event, enabling automated notifications or integration with trading bots.
7. Directional State Tracking
Traditional: Indicators typically do not track the "state" of a trade (e.g., active long/short/flat) beyond simple signals.
Signalgo BB: Maintains persistent variables for entry price, SL, TP, trailing stop, and trade direction, ensuring only one active signal per direction. This prevents overlapping entries and mimics realistic trade management.
8. User Customization
Traditional: Default settings are often hardcoded, or customization is limited.
Signalgo BB: Offers extensive user inputs for MA type and TP/SL logic—making the tool adaptable to many strategies and timeframes.

RSI Mansfield +RSI Mansfield+ – Adaptive Relative Strength Indicator with Divergences
Overview
RSI Mansfield+ is an advanced relative strength indicator that compares your instrument’s performance against a configurable benchmark index or asset (e.g., Bitcoin Dominance, S&P 500). It combines Mansfield normalization, adaptive smoothing techniques, and automatic detection of bullish and bearish divergences (regular and hidden), delivering a comprehensive tool for assessing relative strength across any market and timeframe.
Originality and Motivation
Unlike traditional relative strength scripts, this indicator introduces several distinctive improvements:
Mansfield Normalization: Scales the ratio between the asset and the benchmark relative to its moving average, transforming it into a normalized oscillator that fluctuates around zero, making it easier to spot outperformance or underperformance.
Adaptive Smoothing: Automatically selects whether to use EMA or SMA based on the market type (crypto or stocks) and timeframe (intraday, daily, weekly, monthly), avoiding manual configuration and providing more robust results under varying volatility conditions.
Divergence Detection: Identifies four types of divergences in the Mansfield oscillator to help anticipate potential reversal points or trend confirmations.
Multi-Market Support: Offers benchmark selection among major crypto and global stock indices from a single input.
These enhancements make RSI Mansfield+ more practical and powerful than conventional relative strength scripts with static benchmarks or without divergence capabilities.
Core Concepts
Relative Strength (RS): Compares price evolution between your asset and the selected benchmark.
Mansfield Normalization: Measures how much the RS deviates from its historical moving average, expressed as a scaled oscillator.
Divergences: Detects regular and hidden bullish or bearish divergences within the Mansfield oscillator.
Timeframe Adaptation: Dynamically adjusts moving average lengths based on timeframe and market type.
How It Works
Benchmark Selection
Choose among over 10 indices or market domains (BTC Dominance, ETH Dominance, S&P 500, European indices, etc.).
Ratio Calculation
Computes the price-to-benchmark ratio and smooths it with the adaptive moving average.
Normalization and Scaling
Transforms deviations into a Mansfield oscillator centered around zero.
Dynamic Coloring
Green indicates relative outperformance, red signals underperformance.
Divergence Detection
Automatically identifies bullish and bearish (regular and hidden) divergences by comparing oscillator pivots against price pivots.
Baseline Reference
A clear zero line helps interpret relative strength trends.
Usage Guidelines
Benchmark Comparison
Ideal for traders analyzing whether an asset is outperforming or lagging its sector or market.
Divergence Analysis
Helps detect potential reversal or continuation signals in relative strength.
Multi-Timeframe Compatibility
Can be applied to intraday, daily, weekly, or monthly charts.
Interpretation
Oscillator >0 and green: outperforming the benchmark.
Oscillator <0 and red: underperforming.
Bullish divergences: potential relative strength reversal to the upside.
Bearish divergences: possible loss of momentum or reversal to the downside.
Credits
The concept of Mansfield Relative Strength is based on Stan Weinstein’s original work on relative performance analysis. This script was built entirely from scratch in TradingView Pine Script v6, incorporating original logic for adaptive smoothing, normalized scaling, and divergence detection, without reusing any external open-source code.

Contrarian RSIContrarian RSI Indicator
Pairs nicely with Contrarian 100 MA (optional hide/unhide buy/sell signals)
Description
The Contrarian RSI is a momentum-based technical indicator designed to identify potential reversal points in price action by combining a unique RSI calculation with a predictive range model inspired by the "Contrarian 5 Levels" logic. Unlike traditional RSI, which measures price momentum based solely on price changes, this indicator integrates a smoothed, weighted momentum calculation and predictive price ranges to generate contrarian signals. It is particularly suited for traders looking to capture reversals in trending or range-bound markets.
This indicator is versatile and can be used across various timeframes, though it performs best on higher timeframes (e.g., 1H, 4H, or Daily) due to reduced noise and more reliable signals. Lower timeframes may require additional testing and careful parameter tuning to optimize performance.
How It Works
The Contrarian RSI combines two primary components:
Predictive Ranges (5 Levels Logic): This calculates a smoothed price average that adapts to market volatility using an ATR-based mechanism. It helps identify significant price levels that act as potential support or resistance zones.
Contrarian RSI Calculation: A modified RSI calculation that uses weighted momentum from the predictive ranges to measure buying and selling pressure. The result is smoothed and paired with a user-defined moving average to generate clear signals.
The indicator generates buy (long) and sell (exit) signals based on crossovers and crossunders of user-defined overbought and oversold levels, making it ideal for contrarian trading strategies.
Calculation Overview
Predictive Ranges (5 Levels Logic):
Uses a custom function (pred_ranges) to calculate a dynamic price average (avg) based on the ATR (Average True Range) multiplied by a user-defined factor (mult).
The average adjusts only when the price moves beyond the ATR threshold, ensuring responsiveness to significant price changes while filtering out noise.
This calculation is performed on a user-specified timeframe (tf5Levels) for multi-timeframe analysis.
Contrarian RSI:
Compares consecutive predictive range values to calculate gains (g) and losses (l) over a user-defined period (crsiLength).
Applies a Gaussian weighting function (weight = math.exp(-math.pow(i / crsiLength, 2))) to prioritize recent price movements.
Computes a "wave ratio" (net_momentum / total_energy) to normalize momentum, which is then scaled to a 0–100 range (qrsi = 50 + 50 * wave_ratio).
Smooths the result with a 2-period EMA (qrsi_smoothed) for stability.
Moving Average:
Applies a user-selected moving average (SMA, EMA, WMA, SMMA, or VWMA) with a customizable length (maLength) to the smoothed RSI (qrsi_smoothed) to generate the final indicator value (qrsi_ma).
Signal Generation:
Long Entry: Triggered when qrsi_ma crosses above the oversold level (oversoldLevel, default: 1).
Long Exit: Triggered when qrsi_ma crosses below the overbought level (overboughtLevel, default: 99).
Entry and Exit Rules
Long Entry: Enter a long position when the Contrarian RSI (qrsi_ma) crosses above the oversold level (default: 1). This suggests the asset is potentially oversold and due for a reversal.
Long Exit: Exit the long position when the Contrarian RSI (qrsi_ma) crosses below the overbought level (default: 99), indicating a potential overbought condition and a reversal to the downside.
Customization: Adjust overboughtLevel and oversoldLevel to fine-tune sensitivity. Lower timeframes may benefit from tighter levels (e.g., 20 for oversold, 80 for overbought), while higher timeframes can use extreme levels (e.g., 1 and 99) for stronger reversals.
Timeframe Considerations
Higher Timeframes (Recommended): The indicator is optimized for higher timeframes (e.g., 1H, 4H, Daily) due to its reliance on predictive ranges and smoothed momentum, which perform best with less market noise. These timeframes typically yield more reliable reversal signals.
Lower Timeframes: The indicator can be used on lower timeframes (e.g., 5M, 15M), but signals may be noisier and require additional confirmation (e.g., from price action or other indicators). Extensive backtesting and parameter optimization (e.g., adjusting crsiLength, maLength, or mult) are recommended for lower timeframes.
Inputs
Contrarian RSI Length (crsiLength): Length for RSI momentum calculation (default: 5).
RSI MA Length (maLength): Length of the moving average applied to the RSI (default: 1, effectively no MA).
MA Type (maType): Choose from SMA, EMA, WMA, SMMA, or VWMA (default: SMA).
Overbought Level (overboughtLevel): Upper threshold for exit signals (default: 99).
Oversold Level (oversoldLevel): Lower threshold for entry signals (default: 1).
Plot Signals on Main Chart (plotOnChart): Toggle to display signals on the price chart or the indicator panel (default: false).
Plotted on Lower:
Plotted on Chart:
5 Levels Length (length5Levels): Length for predictive range calculation (default: 200).
Factor (mult): ATR multiplier for predictive ranges (default: 6.0).
5 Levels Timeframe (tf5Levels): Timeframe for predictive range calculation (default: chart timeframe).
Visuals
Contrarian RSI MA: Plotted as a yellow line, representing the smoothed Contrarian RSI with the applied moving average.
Overbought/Oversold Lines: Red line for overbought (default: 99) and green line for oversold (default: 1).
Signals: Blue circles for long entries, white circles for long exits. Signals can be plotted on the main chart (plotOnChart = true) or the indicator panel (plotOnChart = false).
Usage Notes
Use the indicator in conjunction with other tools (e.g., support/resistance, trendlines, or volume) to confirm signals.
Test extensively on your chosen timeframe and asset to optimize parameters like crsiLength, maLength, and mult.
Be cautious with lower timeframes, as false signals may occur due to market noise.
The indicator is designed for contrarian strategies, so it works best in markets with clear reversal patterns.
Disclaimer
This indicator is provided for educational and informational purposes only. Always conduct thorough backtesting and risk management before using any indicator in live trading. The author is not responsible for any financial losses incurred.

Intermarket Correlation Oscillator (ICO)The Intermarket Correlation Oscillator (ICO) is a TradingView indicator that helps traders analyze the relationship between two assets, such as stocks, indices, or cryptocurrencies, by measuring their price correlation. It displays this correlation as an oscillator ranging from -1 to +1, making it easy to spot whether the assets move together, oppositely, or independently. A value near +1 indicates strong positive correlation (assets move in the same direction), near -1 shows strong negative correlation (opposite movements), and near 0 suggests no correlation. This tool is ideal for confirming trends, spotting divergences, or identifying hedging opportunities across markets.
How It Works?
The ICO calculates the Pearson correlation coefficient between the chart’s primary asset (e.g., Apple stock) and a secondary asset you choose (e.g., SPY for the S&P 500) over a specified number of bars (default: 20). The oscillator is plotted in a separate pane below the chart, with key levels at +0.8 (overbought, strong positive correlation) and -0.8 (oversold, strong negative correlation). A midline at 0 helps gauge neutral correlation. When the oscillator crosses these levels or the midline, labels ("OB" for overbought, "OS" for oversold) and alerts notify you of significant shifts. Shaded zones highlight extreme correlations (red for overbought, green for oversold) if enabled.
Why Use the ICO?
Trend Confirmation: High positive correlation (e.g., SPY and QQQ both rising) confirms market trends.
Divergence Detection: Negative correlation (e.g., DXY rising while stocks fall) signals potential reversals.
Hedging: Identify negatively correlated assets to balance your portfolio.
Market Insights: Understand how assets like stocks, bonds, or crypto interact.
Easy Steps to Use the ICO in TradingView
Add the Indicator:
Open TradingView and load your chart (e.g., AAPL on a daily timeframe).
Go to the Pine Editor at the bottom of the TradingView window.
Copy and paste the ICO script provided earlier.
Click "Add to Chart" to display the oscillator below your price chart.
Configure Settings:
Click the gear icon next to the indicator’s name in the chart pane to open settings.
Secondary Symbol: Choose an asset to compare with your chart’s symbol (e.g., "SPY" for S&P 500, "DXY" for USD Index, or "BTCUSD" for Bitcoin). Default is SPY.
Correlation Lookback Period: Set the number of bars for calculation (default: 20). Use 10-14 for short-term trading or 50 for longer-term analysis.
Overbought/Oversold Levels: Adjust thresholds (default: +0.8 for overbought, -0.8 for oversold) to suit your strategy. Lower values (e.g., ±0.7) give more signals.
Show Midline/Zones: Check boxes to display the zero line and shaded overbought/oversold zones for visual clarity.
Interpret the Oscillator:
Above +0.8: Strong positive correlation (red zone). Assets move together.
Below -0.8: Strong negative correlation (green zone). Assets move oppositely.
Near 0: No clear relationship (midline reference).
Labels: "OB" or "OS" appears when crossing overbought/oversold levels, signaling potential correlation shifts.
Set Up Alerts:
Right-click the indicator, select "Add Alert."
Choose conditions like "Overbought Alert" (crossing above +0.8), "Oversold Alert" (crossing below -0.8), or zero-line crossings for bullish/bearish correlation shifts.
Configure notifications (e.g., email, SMS) to stay informed.
Apply to Trading:
Use positive correlation to confirm trades (e.g., buy AAPL if SPY is rising and correlation is high).
Spot divergences for reversals (e.g., stocks dropping while DXY rises with negative correlation).
Combine with other indicators like RSI or moving averages for stronger signals.
Tips for New Users
Start with related assets (e.g., SPY and QQQ for tech stocks) to see clear correlations.
Test on a demo account to understand signals before trading live.
Be aware that correlation is a lagging indicator; confirm signals with price action.
If the secondary symbol doesn’t load, ensure it’s valid on TradingView (e.g., use correct ticker format).
The ICO is a powerful, beginner-friendly tool to explore intermarket relationships, enhancing your trading decisions with clear visual cues and alerts.

DP_MoneyFlow_Osc_V4**DP_Moneyflow_Osc_V4** is a custom, volume‐weighted momentum oscillator built around the classic Money Flow Index (MFI), with a few twists to help you spot more reliable reversal points:
***Best way to use it is to take the signals as alert points, to understand when money is starting to flow in or starting to flow out. It is not intended to be a Buy or Sell signal at the point of entry where the label is printed.***
1. **Core Calculation**
* Computes the standard MFI on your chart’s native timeframe:
* Money Flow = typical price (H+L+C)/3 × volume
* Segregates positive vs. negative flow based on whether price rose or fell on each bar
* Smooths each with an N-bar SMA, forms the ratio, and maps it into a 0–100 scale
2. **Inversion & Smoothing**
* You can **invert** the oscillator around 50 (so peaks become troughs and vice versa) with the **Reverse MFI** toggle.
* Applies two layers of smoothing (one for raw noise reduction, another for longer-term trend stability).
3. **Dynamic Coloring**
* Above Overbought (OB) threshold → solid red; below Oversold (OS) → solid green.
* In between, it linearly fades from red/green toward black as it approaches the 50 midpoint.
* **Invert Colors** flips the hue logic (red ↔ green) if you prefer.
4. **Overbought/Oversold Zones**
* Plots horizontal lines at your chosen OB/OS levels.
* Optionally fills the zone between them for quick visual reference.
5. **Peak/Trough Signal Labels**
* Detects **true extremes** by finding when the oscillator reverses direction right at or beyond your OB/OS levels.
* Prints a tiny “OB” or “OS” label **exactly at that pivot bar**, so you see the high or low of the swing.
6. **Alternation Toggle**
* Prevents two consecutive “OS” or “OB” labels by enforcing strict Buy/Sell alternation—turn this on or off via **Enable Signal Alternation**.
---
**Use-Case**: This oscillator excels at pinpointing the *tops* and *bottoms* of strong volume‐backed moves, giving you clear pivot markers rather than every threshold crossover. Tweak the smoothing and threshold inputs to calibrate sensitivity to your market and timeframe.

Smarter Money Flow Divergence Detector [PhenLabs]📊 Smarter Money Flow Divergence Detector
Version: PineScript™ v6
📌 Description
SMFD was developed to help give you guys a better ability to “read” what is going on behind the scenes without directly having access to that level of data. SMFD is an enhanced divergence detection indicator that identifies money flow patterns from advanced volume analysis and price action correspondence. The detection portion of this indicator combines intelligent money flow calculations with multi timeframe volume analysis to help you see hidden accumulation and distribution phases before major price movements occur.
The indicator measures institutional trading activity by looking at volume surges, price volume dynamics, and the factors of momentum to construct an overall picture of market sentiment. It’s built to assist traders in identifying high probability entries by identifying if smart money is positioning against price action.
🚀 Points of Innovation
● Advanced Smart Money Flow algorithm with volume spike detection and large trade weighting
● Multi timeframe volume analysis for enhanced institutional activity detection
● Dynamic overbought/oversold zones that adapt to current market conditions
● Enhanced divergence detection with pivot confirmation and strength validation
● Color themes with customizable visual styling options
● Real time institutional bias tracking through accumulation/distribution analysis
🔧 Core Components
● Smart Money Flow Calculation: Combines price momentum, volume expansion, and VWAP analysis
● Institutional Bias Oscillator: Tracks accumulation/distribution patterns with volume pressure analysis
● Enhanced Divergence Engine: Detects bullish/bearish divergences with multiple confirmation factors
● Dynamic Zone Detection: Automatically adjusts overbought/oversold levels based on market volatility
● Volume Pressure Analysis: Measures buying vs selling pressure over configurable periods
● Multi factor Signal System: Generates entries with trend alignment and strength validation
🔥 Key Features
● Smart Money Flow Period: Configurable calculation period for institutional activity detection
● Volume Spike Threshold: Adjustable multiplier for detecting unusual institutional volume
● Large Trade Weight: Emphasis factor for high volume periods in flow calculations
● Pivot Detection: Customizable lookback period for accurate divergence identification
● Signal Sensitivity: Three tier system (Conservative/Medium/Aggressive) for signal generation
● Themes: Four color schemes optimized for different chart backgrounds
🎨 Visualization
● Main Oscillator: Line, Area, or Histogram display styles with dynamic color coding
● Institutional Bias Line: Real time tracking of accumulation/distribution phases
● Dynamic Zones: Adaptive overbought/oversold boundaries with gradient fills
● Divergence Lines: Automatic drawing of bullish/bearish divergence connections
● Entry Signals: Clear BUY/SELL labels with signal strength indicators
● Information Panel: Real time statistics and status updates in customizable positions
📖 Usage Guidelines
Algorithm Settings
● Smart Money Flow Period
○ Default: 20
○ Range: 5-100
○ Description: Controls the calculation period for institutional flow analysis.
Higher values provide smoother signals but reduce responsiveness to recent activity
● Volume Spike Threshold
○ Default: 1.8
○ Range: 1.0-5.0
○ Description: Multiplier for detecting unusual volume activity indicating institutional participation. Higher values require more extreme volume for detection
● Large Trade Weight
○ Default: 2.5
○ Range: 1.5-5.0
○ Description: Weight applied to high volume periods in smart money calculations. Increases emphasis on institutional sized transactions
Divergence Detection
● Pivot Detection Period
○ Default: 12
○ Range: 5-50
○ Description: Bars to analyze for pivot high/low identification.
Affects divergence accuracy and signal frequency
● Minimum Divergence Strength
○ Default: 0.25
○ Range: 0.1-1.0
○ Description: Required price change percentage for valid divergence patterns.
Higher values filter out weaker signals
✅ Best Use Cases
● Trading with intraday to daily timeframes for institutional position identification
● Confirming trend reversals when divergences align with support/resistance levels
● Entry timing in trending markets when institutional bias supports the direction
● Risk management by avoiding trades against strong institutional positioning
● Multi timeframe analysis combining short term signals with longer term bias
⚠️ Limitations
● Requires sufficient volume for accurate institutional detection in low volume markets
● Divergence signals may have false positives during highly volatile news events
● Best performance on liquid markets with consistent institutional participation
● Lagging nature of volume based calculations may delay signal generation
● Effectiveness reduced during low participation holiday periods
💡 What Makes This Unique
● Multi Factor Analysis: Combines volume, price, and momentum for comprehensive institutional detection
● Adaptive Zones: Dynamic overbought/oversold levels that adjust to market conditions
● Volume Intelligence: Advanced algorithms identify institutional sized transactions
● Professional Visualization: Multiple display styles with customizable themes
● Confirmation System: Multiple validation layers reduce false signal generation
🔬 How It Works
1. Volume Analysis Phase:
● Analyzes current volume against historical averages to identify institutional activity
● Applies multi timeframe analysis for enhanced detection accuracy
● Calculates volume pressure through buying vs selling momentum
2. Smart Money Flow Calculation:
● Combines typical price with volume weighted analysis
● Applies institutional trade weighting for high volume periods
● Generates directional flow based on price momentum and volume expansion
3. Divergence Detection Process:
● Identifies pivot highs/lows in both price and indicator values
● Validates divergence strength against minimum threshold requirements
● Confirms signals through multiple technical factors before generation
💡 Note: This indicator works best when combined with proper risk management and position sizing. The institutional bias component helps identify market sentiment shifts, while divergence signals provide specific entry opportunities. For optimal results, use on liquid markets with consistent institutional participation and combine with additional technical analysis methods.

Volatility Quality [Alpha Extract]The Alpha-Extract Volatility Quality (AVQ) Indicator provides traders with deep insights into market volatility by measuring the directional strength of price movements. This sophisticated momentum-based tool helps identify overbought and oversold conditions, offering actionable buy and sell signals based on volatility trends and standard deviation bands.
🔶 CALCULATION
The indicator processes volatility quality data through a series of analytical steps:
Bar Range Calculation: Measures true range (TR) to capture price volatility.
Directional Weighting: Applies directional bias (positive for bullish candles, negative for bearish) to the true range.
VQI Computation: Uses an exponential moving average (EMA) of weighted volatility to derive the Volatility Quality Index (VQI).
vqiRaw = ta.ema(weightedVol, vqiLen)
Smoothing: Applies an additional EMA to smooth the VQI for clearer signals.
Normalization: Optionally normalizes VQI to a -100/+100 scale based on historical highs and lows.
Standard Deviation Bands: Calculates three upper and lower bands using standard deviation multipliers for volatility thresholds.
vqiStdev = ta.stdev(vqiSmoothed, vqiLen)
upperBand1 = vqiSmoothed + (vqiStdev * stdevMultiplier1)
upperBand2 = vqiSmoothed + (vqiStdev * stdevMultiplier2)
upperBand3 = vqiSmoothed + (vqiStdev * stdevMultiplier3)
lowerBand1 = vqiSmoothed - (vqiStdev * stdevMultiplier1)
lowerBand2 = vqiSmoothed - (vqiStdev * stdevMultiplier2)
lowerBand3 = vqiSmoothed - (vqiStdev * stdevMultiplier3)
Signal Generation: Produces overbought/oversold signals when VQI reaches extreme levels (±200 in normalized mode).
Formula:
Bar Range = True Range (TR)
Weighted Volatility = Bar Range × (Close > Open ? 1 : Close < Open ? -1 : 0)
VQI Raw = EMA(Weighted Volatility, VQI Length)
VQI Smoothed = EMA(VQI Raw, Smoothing Length)
VQI Normalized = ((VQI Smoothed - Lowest VQI) / (Highest VQI - Lowest VQI) - 0.5) × 200
Upper Band N = VQI Smoothed + (StdDev(VQI Smoothed, VQI Length) × Multiplier N)
Lower Band N = VQI Smoothed - (StdDev(VQI Smoothed, VQI Length) × Multiplier N)
🔶 DETAILS
Visual Features:
VQI Plot: Displays VQI as a line or histogram (lime for positive, red for negative).
Standard Deviation Bands: Plots three upper and lower bands (teal for upper, grayscale for lower) to indicate volatility thresholds.
Reference Levels: Horizontal lines at 0 (neutral), +100, and -100 (in normalized mode) for context.
Zone Highlighting: Overbought (⋎ above bars) and oversold (⋏ below bars) signals for extreme VQI levels (±200 in normalized mode).
Candle Coloring: Optional candle overlay colored by VQI direction (lime for positive, red for negative).
Interpretation:
VQI ≥ 200 (Normalized): Overbought condition, strong sell signal.
VQI 100–200: High volatility, potential selling opportunity.
VQI 0–100: Neutral bullish momentum.
VQI 0 to -100: Neutral bearish momentum.
VQI -100 to -200: High volatility, strong bearish momentum.
VQI ≤ -200 (Normalized): Oversold condition, strong buy signal.
🔶 EXAMPLES
Overbought Signal Detection: When VQI exceeds 200 (normalized), the indicator flags potential market tops with a red ⋎ symbol.
Example: During strong uptrends, VQI reaching 200 has historically preceded corrections, allowing traders to secure profits.
Oversold Signal Detection: When VQI falls below -200 (normalized), a lime ⋏ symbol highlights potential buying opportunities.
Example: In bearish markets, VQI dropping below -200 has marked reversal points for profitable long entries.
Volatility Trend Tracking: The VQI plot and bands help traders visualize shifts in market momentum.
Example: A rising VQI crossing above zero with widening bands indicates strengthening bullish momentum, guiding traders to hold or enter long positions.
Dynamic Support/Resistance: Standard deviation bands act as dynamic volatility thresholds during price movements.
Example: Price reversals often occur near the third standard deviation bands, providing reliable entry/exit points during volatile periods.
🔶 SETTINGS
Customization Options:
VQI Length: Adjust the EMA period for VQI calculation (default: 14, range: 1–50).
Smoothing Length: Set the EMA period for smoothing (default: 5, range: 1–50).
Standard Deviation Multipliers: Customize multipliers for bands (defaults: 1.0, 2.0, 3.0).
Normalization: Toggle normalization to -100/+100 scale and adjust lookback period (default: 200, min: 50).
Display Style: Switch between line or histogram plot for VQI.
Candle Overlay: Enable/disable VQI-colored candles (lime for positive, red for negative).
The Alpha-Extract Volatility Quality Indicator empowers traders with a robust tool to navigate market volatility. By combining directional price range analysis with smoothed volatility metrics, it identifies overbought and oversold conditions, offering clear buy and sell signals. The customizable standard deviation bands and optional normalization provide precise context for market conditions, enabling traders to make informed decisions across various market cycles.

Market Zone Analyzer[BullByte]Understanding the Market Zone Analyzer
---
1. Purpose of the Indicator
The Market Zone Analyzer is a Pine Script™ (version 6) indicator designed to streamline market analysis on TradingView. Rather than scanning multiple separate tools, it unifies four core dimensions—trend strength, momentum, price action, and market activity—into a single, consolidated view. By doing so, it helps traders:
• Save time by avoiding manual cross-referencing of disparate signals.
• Reduce decision-making errors that can arise from juggling multiple indicators.
• Gain a clear, reliable read on whether the market is in a bullish, bearish, or sideways phase, so they can more confidently decide to enter, exit, or hold a position.
---
2. Why a Trader Should Use It
• Unified View: Combines all essential market dimensions into one easy-to-read score and dashboard, eliminating the need to piece together signals manually.
• Adaptability: Automatically adjusts its internal weighting for trend, momentum, and price action based on current volatility. Whether markets are choppy or calm, the indicator remains relevant.
• Ease of Interpretation: Outputs a simple “BULLISH,” “BEARISH,” or “SIDEWAYS” label, supplemented by an intuitive on-chart dashboard and an oscillator plot that visually highlights market direction.
• Reliability Features: Built-in smoothing of the net score and hysteresis logic (requiring consecutive confirmations before flips) minimize false signals during noisy or range-bound phases.
---
3. Why These Specific Indicators?
This script relies on a curated set of well-established technical tools, each chosen for its particular strength in measuring one of the four core dimensions:
1. Trend Strength:
• ADX/DMI (Average Directional Index / Directional Movement Index): Measures how strong a trend is, and whether the +DI line is above the –DI line (bullish) or vice versa (bearish).
• Moving Average Slope (Fast MA vs. Slow MA): Compares a shorter-period SMA to a longer-period SMA; if the fast MA sits above the slow MA, it confirms an uptrend, and vice versa for a downtrend.
• Ichimoku Cloud Differential (Senkou A vs. Senkou B): Provides a forward-looking view of trend direction; Senkou A above Senkou B signals bullishness, and the opposite signals bearishness.
2. Momentum:
• Relative Strength Index (RSI): Identifies overbought (above its dynamically calculated upper bound) or oversold (below its lower bound) conditions; changes in RSI often precede price reversals.
• Stochastic %K: Highlights shifts in short-term momentum by comparing closing price to the recent high/low range; values above its upper band signal bullish momentum, below its lower band signal bearish momentum.
• MACD Histogram: Measures the difference between the MACD line and its signal line; a positive histogram indicates upward momentum, a negative histogram indicates downward momentum.
3. Price Action:
• Highest High / Lowest Low (HH/LL) Range: Over a defined lookback period, this captures breakout or breakdown levels. A closing price near the recent highs (with a positive MA slope) yields a bullish score, and near the lows (with a negative MA slope) yields a bearish score.
• Heikin-Ashi Doji Detection: Uses Heikin-Ashi candles to identify indecision or continuation patterns. A small Heikin-Ashi body (doji) relative to recent volatility is scored as neutral; a larger body in the direction of the MA slope is scored bullish or bearish.
• Candle Range Measurement: Compares each candle’s high-low range against its own dynamic band (average range ± standard deviation). Large candles aligning with the prevailing trend score bullish or bearish accordingly; unusually small candles can indicate exhaustion or consolidation.
4. Market Activity:
• Bollinger Bands Width (BBW): Measures the distance between BB upper and lower bands; wide bands indicate high volatility, narrow bands indicate low volatility.
• Average True Range (ATR): Quantifies average price movement (volatility). A sudden spike in ATR suggests a volatile environment, while a contraction suggests calm.
• Keltner Channels Width (KCW): Similar to BBW but uses ATR around an EMA. Provides a second layer of volatility context, confirming or contrasting BBW readings.
• Volume (with Moving Average): Compares current volume to its moving average ± standard deviation. High volume validates strong moves; low volume signals potential lack of conviction.
By combining these tools, the indicator captures trend direction, momentum strength, price-action nuances, and overall market energy, yielding a more balanced and comprehensive assessment than any single tool alone.
---
4. What Makes This Indicator Stand Out
• Multi-Dimensional Analysis: Rather than relying on a lone oscillator or moving average crossover, it simultaneously evaluates trend, momentum, price action, and activity.
• Dynamic Weighting: The relative importance of trend, momentum, and price action adjusts automatically based on real-time volatility (Market Activity State). For example, in highly volatile conditions, trend and momentum signals carry more weight; in calm markets, price action signals are prioritized.
• Stability Mechanisms:
• Smoothing: The net score is passed through a short moving average, filtering out noise, especially on lower timeframes.
• Hysteresis: Both Market Activity State and the final bullish/bearish/sideways zone require two consecutive confirmations before flipping, reducing whipsaw.
• Visual Interpretation: A fully customizable on-chart dashboard displays each sub-indicator’s value, regime, score, and comment, all color-coded. The oscillator plot changes color to reflect the current market zone (green for bullish, red for bearish, gray for sideways) and shows horizontal threshold lines at +2, 0, and –2.
---
5. Recommended Timeframes
• Short-Term (5 min, 15 min): Day traders and scalpers can benefit from rapid signals, but should enable smoothing (and possibly disable hysteresis) to reduce false whipsaws.
• Medium-Term (1 h, 4 h): Swing traders find a balance between responsiveness and reliability. Less smoothing is required here, and the default parameters (e.g., ADX length = 14, RSI length = 14) perform well.
• Long-Term (Daily, Weekly): Position traders tracking major trends can disable smoothing for immediate raw readings, since higher-timeframe noise is minimal. Adjust lookback lengths (e.g., increase adxLength, rsiLength) if desired for slower signals.
Tip: If you keep smoothing off, stick to timeframes of 1 h or higher to avoid excessive signal “chatter.”
---
6. How Scoring Works
A. Individual Indicator Scores
Each sub-indicator is assigned one of three discrete scores:
• +1 if it indicates a bullish condition (e.g., RSI above its dynamically calculated upper bound).
• 0 if it is neutral (e.g., RSI between upper and lower bounds).
• –1 if it indicates a bearish condition (e.g., RSI below its dynamically calculated lower bound).
Examples of individual score assignments:
• ADX/DMI:
• +1 if ADX ≥ adxThreshold and +DI > –DI (strong bullish trend)
• –1 if ADX ≥ adxThreshold and –DI > +DI (strong bearish trend)
• 0 if ADX < adxThreshold (trend strength below threshold)
• RSI:
• +1 if RSI > RSI_upperBound
• –1 if RSI < RSI_lowerBound
• 0 otherwise
• ATR (as part of Market Activity):
• +1 if ATR > (ATR_MA + stdev(ATR))
• –1 if ATR < (ATR_MA – stdev(ATR))
• 0 otherwise
Each of the four main categories shares this same +1/0/–1 logic across their sub-components.
B. Category Scores
Once each sub-indicator reports +1, 0, or –1, these are summed within their categories as follows:
• Trend Score = (ADX score) + (MA slope score) + (Ichimoku differential score)
• Momentum Score = (RSI score) + (Stochastic %K score) + (MACD histogram score)
• Price Action Score = (Highest-High/Lowest-Low score) + (Heikin-Ashi doji score) + (Candle range score)
• Market Activity Raw Score = (BBW score) + (ATR score) + (KC width score) + (Volume score)
Each category’s summed value can range between –3 and +3 (for Trend, Momentum, and Price Action), and between –4 and +4 for Market Activity raw.
C. Market Activity State and Dynamic Weight Adjustments
Rather than contributing directly to the netScore like the other three categories, Market Activity determines how much weight to assign to Trend, Momentum, and Price Action:
1. Compute Market Activity Raw Score by summing BBW, ATR, KCW, and Volume individual scores (each +1/0/–1).
2. Bucket into High, Medium, or Low Activity:
• High if raw Score ≥ 2 (volatile market).
• Low if raw Score ≤ –2 (calm market).
• Medium otherwise.
3. Apply Hysteresis (if enabled): The state only flips after two consecutive bars register the same high/low/medium label.
4. Set Category Weights:
• High Activity: Trend = 50 %, Momentum = 35 %, Price Action = 15 %.
• Low Activity: Trend = 25 %, Momentum = 20 %, Price Action = 55 %.
• Medium Activity: Use the trader’s base weight inputs (e.g., Trend = 40 %, Momentum = 30 %, Price Action = 30 % by default).
D. Calculating the Net Score
5. Normalize Base Weights (so that the sum of Trend + Momentum + Price Action always equals 100 %).
6. Determine Current Weights based on the Market Activity State (High/Medium/Low).
7. Compute Each Category’s Contribution: Multiply (categoryScore) × (currentWeight).
8. Sum Contributions to get the raw netScore (a floating-point value that can exceed ±3 when scores are strong).
9. Smooth the netScore over two bars (if smoothing is enabled) to reduce noise.
10. Apply Hysteresis to the Final Zone:
• If the smoothed netScore ≥ +2, the bar is classified as “Bullish.”
• If the smoothed netScore ≤ –2, the bar is classified as “Bearish.”
• Otherwise, it is “Sideways.”
• To prevent rapid flips, the script requires two consecutive bars in the new zone before officially changing the displayed zone (if hysteresis is on).
E. Thresholds for Zone Classification
• BULLISH: netScore ≥ +2
• BEARISH: netScore ≤ –2
• SIDEWAYS: –2 < netScore < +2
---
7. Role of Volatility (Market Activity State) in Scoring
Volatility acts as a dynamic switch that shifts which category carries the most influence:
1. High Activity (Volatile):
• Detected when at least two sub-scores out of BBW, ATR, KCW, and Volume equal +1.
• The script sets Trend weight = 50 % and Momentum weight = 35 %. Price Action weight is minimized at 15 %.
• Rationale: In volatile markets, strong trending moves and momentum surges dominate, so those signals are more reliable than nuanced candle patterns.
2. Low Activity (Calm):
• Detected when at least two sub-scores out of BBW, ATR, KCW, and Volume equal –1.
• The script sets Price Action weight = 55 %, Trend = 25 %, and Momentum = 20 %.
• Rationale: In quiet, sideways markets, subtle price-action signals (breakouts, doji patterns, small-range candles) are often the best early indicators of a new move.
3. Medium Activity (Balanced):
• Raw Score between –1 and +1 from the four volatility metrics.
• Uses whatever base weights the trader has specified (e.g., Trend = 40 %, Momentum = 30 %, Price Action = 30 %).
Because volatility can fluctuate rapidly, the script employs hysteresis on Market Activity State: a new High or Low state must occur on two consecutive bars before weights actually shift. This avoids constant back-and-forth weight changes and provides more stability.
---
8. Scoring Example (Hypothetical Scenario)
• Symbol: Bitcoin on a 1-hour chart.
• Market Activity: Raw volatility sub-scores show BBW (+1), ATR (+1), KCW (0), Volume (+1) → Total raw Score = +3 → High Activity.
• Weights Selected: Trend = 50 %, Momentum = 35 %, Price Action = 15 %.
• Trend Signals:
• ADX strong and +DI > –DI → +1
• Fast MA above Slow MA → +1
• Ichimoku Senkou A > Senkou B → +1
→ Trend Score = +3
• Momentum Signals:
• RSI above upper bound → +1
• MACD histogram positive → +1
• Stochastic %K within neutral zone → 0
→ Momentum Score = +2
• Price Action Signals:
• Highest High/Lowest Low check yields 0 (close not near extremes)
• Heikin-Ashi doji reading is neutral → 0
• Candle range slightly above upper bound but trend is strong, so → +1
→ Price Action Score = +1
• Compute Net Score (before smoothing):
• Trend contribution = 3 × 0.50 = 1.50
• Momentum contribution = 2 × 0.35 = 0.70
• Price Action contribution = 1 × 0.15 = 0.15
• Raw netScore = 1.50 + 0.70 + 0.15 = 2.35
• Since 2.35 ≥ +2 and hysteresis is met, the final zone is “Bullish.”
Although the netScore lands at 2.35 (Bullish), smoothing might bring it slightly below 2.00 on the first bar (e.g., 1.90), in which case the script would wait for a second consecutive reading above +2 before officially classifying the zone as Bullish (if hysteresis is enabled).
---
9. Correlation Between Categories
The four categories—Trend Strength, Momentum, Price Action, and Market Activity—often reinforce or offset one another. The script takes advantage of these natural correlations:
• Bullish Alignment: If ADX is strong and pointed upward, fast MA is above slow MA, and Ichimoku is positive, that usually coincides with RSI climbing above its upper bound and the MACD histogram turning positive. In such cases, both Trend and Momentum categories generate +1 or +2. Because the Market Activity State is likely High (given the accompanying volatility), Trend and Momentum weights are at their peak, so the netScore quickly crosses into Bullish territory.
• Sideways/Consolidation: During a low-volatility, sideways phase, ADX may fall below its threshold, MAs may flatten, and RSI might hover in the neutral band. However, subtle price-action signals (like a small breakout candle or a Heikin-Ashi candle with a slight bias) can still produce a +1 in the Price Action category. If Market Activity is Low, Price Action’s weight (55 %) can carry enough influence—even if Trend and Momentum are neutral—to push the netScore out of “Sideways” into a mild bullish or bearish bias.
• Opposing Signals: When Trend is bullish but Momentum turns negative (for example, price continues up but RSI rolls over), the two scores can partially cancel. Market Activity may remain Medium, in which case the netScore lingers near zero (Sideways). The trader can then wait for either a clearer momentum shift or a fresh price-action breakout before committing.
By dynamically recognizing these correlations and adjusting weights, the indicator ensures that:
• When Trend and Momentum align (and volatility supports it), the netScore leaps strongly into Bullish or Bearish.
• When Trend is neutral but Price Action shows an early move in a low-volatility environment, Price Action’s extra weight in the Low Activity State can still produce actionable signals.
---
10. Market Activity State & Its Role (Detailed)
The Market Activity State is not a direct category score—it is an overarching context setter for how heavily to trust Trend, Momentum, or Price Action. Here’s how it is derived and applied:
1. Calculate Four Volatility Sub-Scores:
• BBW: Compare the current band width to its own moving average ± standard deviation. If BBW > (BBW_MA + stdev), assign +1 (high volatility); if BBW < (BBW_MA × 0.5), assign –1 (low volatility); else 0.
• ATR: Compare ATR to its moving average ± standard deviation. A spike above the upper threshold is +1; a contraction below the lower threshold is –1; otherwise 0.
• KCW: Same logic as ATR but around the KCW mean.
• Volume: Compare current volume to its volume MA ± standard deviation. Above the upper threshold is +1; below the lower threshold is –1; else 0.
2. Sum Sub-Scores → Raw Market Activity Score: Range between –4 and +4.
3. Assign Market Activity State:
• High Activity: Raw Score ≥ +2 (at least two volatility metrics are strongly spiking).
• Low Activity: Raw Score ≤ –2 (at least two metrics signal unusually low volatility or thin volume).
• Medium Activity: Raw Score is between –1 and +1 inclusive.
4. Hysteresis for Stability:
• If hysteresis is enabled, a new state only takes hold after two consecutive bars confirm the same High, Medium, or Low label.
• This prevents the Market Activity State from bouncing around when volatility is on the fence.
5. Set Category Weights Based on Activity State:
• High Activity: Trend = 50 %, Momentum = 35 %, Price Action = 15 %.
• Low Activity: Trend = 25 %, Momentum = 20 %, Price Action = 55 %.
• Medium Activity: Use trader’s base weights (e.g., Trend = 40 %, Momentum = 30 %, Price Action = 30 %).
6. Impact on netScore: Because category scores (–3 to +3) multiply by these weights, High Activity amplifies the effect of strong Trend and Momentum scores; Low Activity amplifies the effect of Price Action.
7. Market Context Tooltip: The dashboard includes a tooltip summarizing the current state—e.g., “High activity, trend and momentum prioritized,” “Low activity, price action prioritized,” or “Balanced market, all categories considered.”
---
11. Category Weights: Base vs. Dynamic
Traders begin by specifying base weights for Trend Strength, Momentum, and Price Action that sum to 100 %. These apply only when volatility is in the Medium band. Once volatility shifts:
• High Volatility Overrides:
• Trend jumps from its base (e.g., 40 %) to 50 %.
• Momentum jumps from its base (e.g., 30 %) to 35 %.
• Price Action is reduced to 15 %.
Example: If base weights were Trend = 40 %, Momentum = 30 %, Price Action = 30 %, then in High Activity they become 50/35/15. A Trend score of +3 now contributes 3 × 0.50 = +1.50 to netScore; a Momentum +2 contributes 2 × 0.35 = +0.70. In total, Trend + Momentum can easily push netScore above the +2 threshold on its own.
• Low Volatility Overrides:
• Price Action leaps from its base (30 %) to 55 %.
• Trend falls to 25 %, Momentum falls to 20 %.
Why? When markets are quiet, subtle candle breakouts, doji patterns, and small-range expansions tend to foreshadow the next swing more effectively than raw trend readings. A Price Action score of +3 in this state contributes 3 × 0.55 = +1.65, which can carry the netScore toward +2—even if Trend and Momentum are neutral or only mildly positive.
Because these weight shifts happen only after two consecutive bars confirm a High or Low state (if hysteresis is on), the indicator avoids constantly flipping its emphasis during borderline volatility phases.
---
12. Dominant Category Explained
Within the dashboard, a label such as “Trend Dominant,” “Momentum Dominant,” or “Price Action Dominant” appears when one category’s absolute weighted contribution to netScore is the largest. Concretely:
• Compute each category’s weighted contribution = (raw category score) × (current weight).
• Compare the absolute values of those three contributions.
• The category with the highest absolute value is flagged as Dominant for that bar.
Why It Matters:
• Momentum Dominant: Indicates that the combined force of RSI, Stochastic, and MACD (after weighting) is pushing netScore farther than either Trend or Price Action. In practice, it means that short-term sentiment and speed of change are the primary drivers right now, so traders should watch for continued momentum signals before committing to a trade.
• Trend Dominant: Means ADX, MA slope, and Ichimoku (once weighted) outweigh the other categories. This suggests a strong directional move is in place; trend-following entries or confirming pullbacks are likely to succeed.
• Price Action Dominant: Occurs when breakout/breakdown patterns, Heikin-Ashi candle readings, and range expansions (after weighting) are the most influential. This often happens in calmer markets, where subtle shifts in candle structure can foreshadow bigger moves.
By explicitly calling out which category is carrying the most weight at any moment, the dashboard gives traders immediate insight into why the netScore is tilting toward bullish, bearish, or sideways.
---
13. Oscillator Plot: How to Read It
The “Net Score” oscillator sits below the dashboard and visually displays the smoothed netScore as a line graph. Key features:
1. Value Range: In normal conditions it oscillates roughly between –3 and +3, but extreme confluences can push it outside that range.
2. Horizontal Threshold Lines:
• +2 Line (Bullish threshold)
• 0 Line (Neutral midline)
• –2 Line (Bearish threshold)
3. Zone Coloring:
• Green Background (Bullish Zone): When netScore ≥ +2.
• Red Background (Bearish Zone): When netScore ≤ –2.
• Gray Background (Sideways Zone): When –2 < netScore < +2.
4. Dynamic Line Color:
• The plotted netScore line itself is colored green in a Bullish Zone, red in a Bearish Zone, or gray in a Sideways Zone, creating an immediate visual cue.
Interpretation Tips:
• Crossing Above +2: Signals a strong enough combined trend/momentum/price-action reading to classify as Bullish. Many traders wait for a clear crossing plus a confirmation candle before entering a long position.
• Crossing Below –2: Indicates a strong Bearish signal. Traders may consider short or exit strategies.
• Rising Slope, Even Below +2: If netScore climbs steadily from neutral toward +2, it demonstrates building bullish momentum.
• Divergence: If price makes a higher high but the oscillator fails to reach a new high, it can warn of weakening momentum and a potential reversal.
---
14. Comments and Their Necessity
Every sub-indicator (ADX, MA slope, Ichimoku, RSI, Stochastic, MACD, HH/LL, Heikin-Ashi, Candle Range, BBW, ATR, KCW, Volume) generates a short comment that appears in the detailed dashboard. Examples:
• “Strong bullish trend” or “Strong bearish trend” for ADX/DMI
• “Fast MA above slow MA” or “Fast MA below slow MA” for MA slope
• “RSI above dynamic threshold” or “RSI below dynamic threshold” for RSI
• “MACD histogram positive” or “MACD histogram negative” for MACD Hist
• “Price near highs” or “Price near lows” for HH/LL checks
• “Bullish Heikin Ashi” or “Bearish Heikin Ashi” for HA Doji scoring
• “Large range, trend confirmed” or “Small range, trend contradicted” for Candle Range
Additionally, the top-row comment for each category is:
• Trend: “Highly Bullish,” “Highly Bearish,” or “Neutral Trend.”
• Momentum: “Strong Momentum,” “Weak Momentum,” or “Neutral Momentum.”
• Price Action: “Bullish Action,” “Bearish Action,” or “Neutral Action.”
• Market Activity: “Volatile Market,” “Calm Market,” or “Stable Market.”
Reasons for These Comments:
• Transparency: Shows exactly how each sub-indicator contributed to its category score.
• Education: Helps traders learn why a category is labeled bullish, bearish, or neutral, building intuition over time.
• Customization: If, for example, the RSI comment says “RSI neutral” despite an impending trend shift, a trader might choose to adjust RSI length or thresholds.
In the detailed dashboard, hovering over each comment cell also reveals a tooltip with additional context (e.g., “Fast MA above slow MA” or “Senkou A above Senkou B”), helping traders understand the precise rule behind that +1, 0, or –1 assignment.
---
15. Real-Life Example (Consolidated)
• Instrument & Timeframe: Bitcoin (BTCUSD), 1-hour chart.
• Current Market Activity: BBW and ATR both spike (+1 each), KCW is moderately high (+1), but volume is only neutral (0) → Raw Market Activity Score = +2 → State = High Activity (after two bars, if hysteresis is on).
• Category Weights Applied: Trend = 50 %, Momentum = 35 %, Price Action = 15 %.
• Trend Sub-Scores:
1. ADX = 25 (above threshold 20) with +DI > –DI → +1.
2. Fast MA (20-period) sits above Slow MA (50-period) → +1.
3. Ichimoku: Senkou A > Senkou B → +1.
→ Trend Score = +3.
• Momentum Sub-Scores:
4. RSI = 75 (above its moving average +1 stdev) → +1.
5. MACD histogram = +0.15 → +1.
6. Stochastic %K = 50 (mid-range) → 0.
→ Momentum Score = +2.
• Price Action Sub-Scores:
7. Price is not within 1 % of the 20-period high/low and slope = positive → 0.
8. Heikin-Ashi body is slightly larger than stdev over last 5 bars with haClose > haOpen → +1.
9. Candle range is just above its dynamic upper bound but trend is already captured, so → +1.
→ Price Action Score = +2.
• Calculate netScore (before smoothing):
• Trend contribution = 3 × 0.50 = 1.50
• Momentum contribution = 2 × 0.35 = 0.70
• Price Action contribution = 2 × 0.15 = 0.30
• Raw netScore = 1.50 + 0.70 + 0.30 = 2.50 → Immediately classified as Bullish.
• Oscillator & Dashboard Output:
• The oscillator line crosses above +2 and turns green.
• Dashboard displays:
• Trend Regime “BULLISH,” Trend Score = 3, Comment = “Highly Bullish.”
• Momentum Regime “BULLISH,” Momentum Score = 2, Comment = “Strong Momentum.”
• Price Action Regime “BULLISH,” Price Action Score = 2, Comment = “Bullish Action.”
• Market Activity State “High,” Comment = “Volatile Market.”
• Weights: Trend 50 %, Momentum 35 %, Price Action 15 %.
• Dominant Category: Trend (because 1.50 > 0.70 > 0.30).
• Overall Score: 2.50, posCount = (three +1s in Trend) + (two +1s in Momentum) + (two +1s in Price Action) = 7 bullish signals, negCount = 0.
• Final Zone = “BULLISH.”
• The trader sees that both Trend and Momentum are reinforcing each other under high volatility. They might wait one more candle for confirmation but already have strong evidence to consider a long.
---
• .
---
Disclaimer
This indicator is strictly a technical analysis tool and does not constitute financial advice. All trading involves risk, including potential loss of capital. Past performance is not indicative of future results. Traders should:
• Always backtest the “Market Zone Analyzer ” on their chosen symbols and timeframes before committing real capital.
• Combine this tool with sound risk management, position sizing, and, if possible, fundamental analysis.
• Understand that no indicator is foolproof; always be prepared for unexpected market moves.
Goodluck
-BullByte!
---

Heikin-Ashi Mean Reversion Oscillator [Alpha Extract]The Heikin-Ashi Mean Reversion Oscillator combines the smoothing characteristics of Heikin-Ashi candlesticks with mean reversion analysis to create a powerful momentum oscillator. This indicator applies Heikin-Ashi transformation twice - first to price data and then to the oscillator itself - resulting in smoother signals while maintaining sensitivity to trend changes and potential reversal points.
🔶 CALCULATION
Heikin-Ashi Transformation: Converts regular OHLC data to smoothed Heikin-Ashi values
Component Analysis: Calculates trend strength, body deviation, and price deviation from mean
Oscillator Construction: Combines components with weighted formula (40% trend strength, 30% body deviation, 30% price deviation)
Double Smoothing: Applies EMA smoothing and second Heikin-Ashi transformation to oscillator values
Signal Generation: Identifies trend changes and crossover points with overbought/oversold levels
Formula:
HA Close = (Open + High + Low + Close) / 4
HA Open = (Previous HA Open + Previous HA Close) / 2
Trend Strength = Normalized consecutive HA candle direction
Body Deviation = (HA Body - Mean Body) / Mean Body * 100
Price Deviation = ((HA Close - Price Mean) / Price Mean * 100) / Standard Deviation * 25
Raw Oscillator = (Trend Strength * 0.4) + (Body Deviation * 0.3) + (Price Deviation * 0.3)
Final Oscillator = 50 + (EMA(Raw Oscillator) / 2)
🔶 DETAILS Visual Features:
Heikin-Ashi Candlesticks: Smoothed oscillator representation using HA transformation with vibrant teal/red coloring
Overbought/Oversold Zones: Horizontal lines at customizable levels (default 70/30) with background highlighting in extreme zones
Moving Averages: Optional fast and slow EMA overlays for additional trend confirmation
Signal Dashboard: Real-time table showing current oscillator status (Overbought/Oversold/Bullish/Bearish) and buy/sell signals
Reference Lines: Middle line at 50 (neutral), with 0 and 100 boundaries for range visualization
Interpretation:
Above 70: Overbought conditions, potential selling opportunity
Below 30: Oversold conditions, potential buying opportunity
Bullish HA Candles: Green/teal candles indicate upward momentum
Bearish HA Candles: Red candles indicate downward momentum
MA Crossovers: Fast EMA above slow EMA suggests bullish momentum, below suggests bearish momentum
Zone Exits: Price moving out of extreme zones (above 70 or below 30) often signals trend continuation
🔶 EXAMPLES
Mean Reversion Signals: When the oscillator reaches extreme levels (above 70 or below 30), it identifies potential reversal points where price may revert to the mean.
Example: Oscillator reaching 80+ levels during strong uptrends often precedes short-term pullbacks, providing profit-taking opportunities.
Trend Change Detection: The double Heikin-Ashi smoothing helps identify genuine trend changes while filtering out market noise.
Example: When oscillator HA candles change from red to teal after oversold readings, this confirms potential trend reversal from bearish to bullish.
Moving Average Confirmation: Fast and slow EMA crossovers on the oscillator provide additional confirmation of momentum shifts.
Example: Fast EMA crossing above slow EMA while oscillator is rising from oversold levels provides strong bullish confirmation signal.
Dashboard Signal Integration: The real-time dashboard combines oscillator status with directional signals for quick decision-making.
Example: Dashboard showing "Oversold" status with "BUY" signal when HA candles turn bullish provides clear entry timing.
🔶 SETTINGS
Customization Options:
Calculation: Oscillator period (default 14), smoothing factor (1-50, default 2)
Levels: Overbought threshold (50-100, default 70), oversold threshold (0-50, default 30)
Moving Averages: Toggle display, fast EMA length (default 9), slow EMA length (default 21)
Visual Enhancements: Show/hide signal dashboard, customizable table position
Alert Conditions: Oversold bounce, overbought reversal, bullish/bearish MA crossovers
The Heikin-Ashi Mean Reversion Oscillator provides traders with a sophisticated momentum tool that combines the smoothing benefits of Heikin-Ashi analysis with mean reversion principles. The double transformation process creates cleaner signals while the integrated dashboard and multiple confirmation methods help traders identify high-probability entry and exit points during both trending and ranging market conditions.

Momentum Fusion v1Momentum Fusion v1
Overview
Momentum Fusion v1 (MFusion) is a multi-oscillator indicator that combines several components to analyze market momentum and trend strength. It incorporates modified versions of classic indicators such as PVI (Positive Volume Index), NVI (Negative Volume Index), MFI (Money Flow Index), RSI, Stochastic, and Bollinger Bands Oscillator. The indicator displays a histogram that changes color based on momentum strength and includes "FUSION🔥" signal labels when extreme values are reached.
Indicator Settings
Parameters:
EMA Length – Smoothing period for the moving average (default: 255).
Smoothing Period – Internal calculation smoothing parameter (default: 15).
BB Multiplier – Standard deviation multiplier for Bollinger Bands (default: 2.0).
Show verde / marron / media lines – Toggles the display of auxiliary lines.
Show FUSION🔥 label – Enables/disables signal labels.
Indicator Components
1. PVI (Positive Volume Index)
Formula:
pvi := volume > volume ? nz(pvi ) + (close - close ) / close * sval : nz(pvi )
Description:
PVI increases when volume rises compared to the previous bar and accounts for price percentage change. The stronger the price movement with increasing volume, the higher the PVI value.
2. NVI (Negative Volume Index)
Formula:
nvi := volume < volume ? nz(nvi ) + (close - close ) / close * sval : nz(nvi )
Description:
NVI tracks price movements during declining volume. If the price rises on low volume, it may indicate a "stealth" trend.
3. Money Flow Index (MFI)
Formula:
100 - 100 / (1 + up / dn)
Description:
An oscillator measuring money flow strength. Values above 80 suggest overbought conditions, while values below 20 indicate oversold conditions.
4. Stochastic Oscillator
Formula:
k = 100 * (close - lowest(low, length)) / (highest(high, length) - lowest(low, length))
Description:
A classic stochastic oscillator showing price position relative to the selected period's range.
5. Bollinger Bands Oscillator
Formula:
(tprice - BB midline) / (upper BB - lower BB) * 100
Description:
Indicates the price position relative to Bollinger Bands in percentage terms.
Key Lines & Histogram
1. Verde (Green Line)
Calculation:
verde = marron + oscp (normalized PVI)
Interpretation:
Higher values indicate stronger bullish momentum. A FUSION🔥 signal appears when the value reaches 750+.
2. Marron (Brown Line)
Calculation:
marron = (RSI + MFI + Bollinger Osc + Stochastic / 3) / 2
Interpretation:
A composite oscillator combining multiple indicators. Higher values suggest overbought conditions.
3. Media (Red Line)
Calculation:
media = EMA of marron with smoothing period
Interpretation:
Acts as a signal line for trend confirmation.
4. Histogram
Calculation:
histo = verde - marron
Colors:
Bright green (>100) – Strong bullish momentum.
Light green (>0) – Moderate bullish momentum.
Orange (<0) – Bearish momentum.
Red (<-100) – Strong bearish momentum.
Signals & Alerts
1. FUSION🔥 (Strong Momentum)
Condition:
verde >= 750
Visualization:
A "FUSION🔥" label appears below the chart.
Alert:
Can be set to trigger notifications when the condition is met.
2. Background Aura
Condition:
verde > 850
Visualization:
The chart background turns teal, indicating extreme momentum.
Usage Recommendations
FUSION🔥 Signal – Can be used as a long entry point when confirmed by other indicators.
Histogram:
1. Green bars – Potential long entry.
2. Red/orange bars – Potential short entry.
3. Media & Marron Crossover – Can serve as an additional trend filter.
4. Suitable for a 5-15 minute time frame
Conclusion
Momentum Fusion v1 is a powerful tool for momentum analysis, combining multiple indicators into a unified system. It is suitable for:
Trend traders (catching strong movements).
Scalpers (identifying short-term impulses).
Swing traders (filtering entry points).
The indicator features customizable settings and visual signals, making it adaptable to various trading styles.

Laplace Momentum Percentile ║ BullVision 🔬 Overview
Laplace Momentum Percentile ║ BullVision is a custom-built trend analysis tool that applies Laplace-inspired smoothing to price action and maps the result to a historical percentile scale. This provides a contextual view of trend intensity, with optional signal refinement using a Kalman filter.
This indicator is designed for traders and analysts seeking a normalized, scale-independent perspective on market behavior. It does not attempt to predict price but instead helps interpret the relative strength or weakness of recent movements.
⚙️ Key Concepts
📉 Laplace-Based Smoothing
The core signal is built using a Laplace-style weighted average, applying an exponential decay to price values over a specified length. This emphasizes recent movements while still accounting for historical context.
🎯 Percentile Mapping
Rather than displaying the raw output, the filtered signal is converted into a percentile rank based on its position within a historical lookback window. This helps normalize interpretation across different assets and timeframes.
🧠 Optional Kalman Filter
For users seeking additional smoothing, a Kalman filter is included. This statistical method updates signal estimates dynamically, helping reduce short-term fluctuations without introducing significant lag.
🔧 User Settings
🔁 Transform Parameters
Transform Parameter (s): Controls the decay rate for Laplace weighting.
Calculation Length: Sets how many candles are used for smoothing.
📊 Percentile Settings
Lookback Period: Defines how far back to calculate the historical percentile ranking.
🧠 Kalman Filter Controls
Enable Kalman Filter: Optional toggle.
Process Noise / Measurement Noise: Adjust the filter’s responsiveness and tolerance to volatility.
🎨 Visual Settings
Show Raw Signal: Optionally display the pre-smoothed percentile value.
Thresholds: Customize upper and lower trend zone boundaries.
📈 Visual Output
Main Line: Smoothed percentile rank, color-coded based on strength.
Raw Line (Optional): The unsmoothed percentile value for comparison.
Trend Zones: Background shading highlights strong upward or downward regimes.
Live Label: Displays current percentile value and trend classification.
🧩 Trend Classification Logic
The indicator segments percentile values into five zones:
Above 80: Strong upward trend
50–80: Mild upward trend
20–50: Neutral zone
0–20: Mild downward trend
Below 0: Strong downward trend
🔍 Use Cases
This tool is intended as a visual and contextual aid for identifying trend regimes, assessing historical momentum strength, or supporting broader confluence-based analysis. It can be used in combination with other tools or frameworks at the discretion of the trader.
⚠️ Important Notes
This script does not provide buy or sell signals.
It is intended for educational and analytical purposes only.
It should be used as part of a broader decision-making process.
Past signal behavior should not be interpreted as indicative of future results.
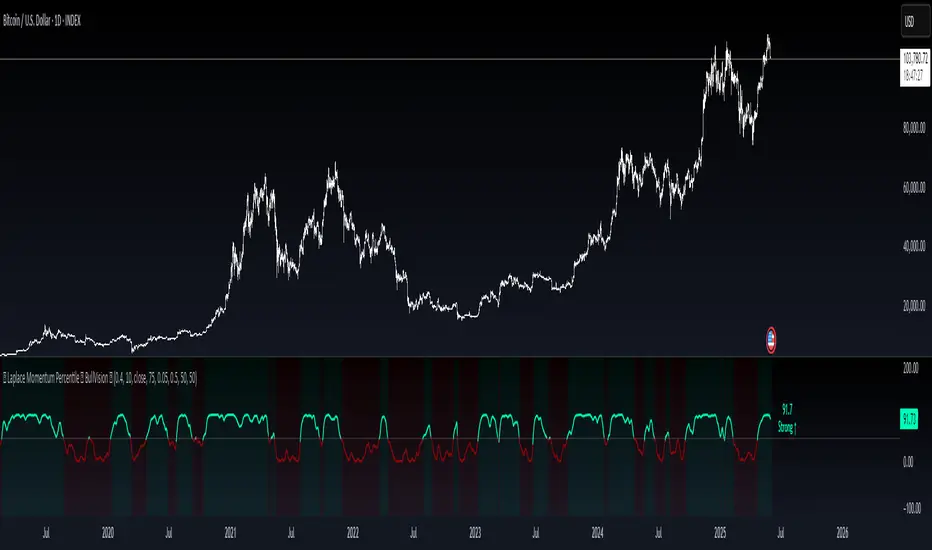
Enhanced Stock Ticker with 50MA vs 200MADescription
The Enhanced Stock Ticker with 50MA vs 200MA is a versatile Pine Script indicator designed to visualize the relative position of a stock's price within its short-term and long-term price ranges, providing actionable bullish and bearish signals. By calculating normalized indices based on user-defined lookback periods (defaulting to 50 and 200 bars), this indicator helps traders identify potential reversals or trend continuations. It offers the flexibility to plot signals either on the main price chart or in a separate lower pane, leveraging Pine Script v6's force_overlay functionality for seamless integration. The indicator also includes a customizable ticker table, visual fills, and alert conditions for automated trading setups.
Key Features
Dual Lookback Indices: Computes short-term (default: 50 bars) and long-term (default: 200 bars) indices, normalizing the closing price relative to the high/low range over the specified periods.
Flexible Signal Plotting: Users can toggle between plotting crossover signals (triangles) on the main price chart (location.abovebar/belowbar) or in the lower pane (location.top/bottom) using the Plot Signals on Main Chart option.
Crossover Signals: Generates bullish (Golden Cross) and bearish (Death Cross) signals when the short or long index crosses above 5 or below 95, respectively.
Visual Enhancements:
Plots short-term (blue) and long-term (white) indices in a separate pane with customizable lookback periods.
Includes horizontal reference lines at 0, 20, 50, 80, and 100, with green and red fills to highlight overbought/oversold zones.
Dynamic fill between indices (green when short > long, red when long > short) for quick trend visualization.
Displays a ticker and legend table in the top-right corner, showing the symbol and lookback periods.
Alert Conditions: Supports alerts for bullish and bearish crossovers on both short and long indices, enabling integration with TradingView's alert system.
Technical Innovation: Utilizes Pine Script v6's force_overlay parameter to plot signals on the main chart from a non-overlay indicator, combining the benefits of a separate pane and chart-based signals in a single script.
Technical Details
Calculation Logic:
Uses confirmed bars (barstate.isconfirmed) to calculate indices, ensuring reliability by avoiding real-time bar fluctuations.
Short-term index: (close - lowest(low, lookback_short)) / (highest(high, lookback_short) - lowest(low, lookback_short)) * 100
Long-term index: (close - lowest(low, lookback_long)) / (highest(high, lookback_long) - lowest(low, lookback_long)) * 100
Signals are triggered using ta.crossover() and ta.crossunder() for indices crossing 5 (bullish) and 95 (bearish).
Signal Plotting:
Main chart signals use force_overlay=true with location.abovebar/belowbar for precise alignment with price bars.
Lower pane signals use location.top/bottom for visibility within the indicator pane.
Plotting is controlled by boolean conditions (e.g., bullishLong and plot_on_chart) to ensure compliance with Pine Script's global scope requirements.
Performance Considerations: Optimized for efficiency by calculating indices only on confirmed bars and using lightweight plotting functions.
How to Use
Add to Chart:
Copy the script into TradingView's Pine Editor and add it to your chart.
Configure Settings:
Short Lookback Period: Adjust the short-term lookback (default: 50 bars) to match your trading style (e.g., 20 for shorter-term analysis).
Long Lookback Period: Adjust the long-term lookback (default: 200 bars) for broader market context.
Plot Signals on Main Chart: Check this box to display signals on the price chart; uncheck to show signals in the lower pane.
Interpret Signals:
Golden Cross (Bullish): Green (long) or blue (short) triangles indicate the index crossing above 5, suggesting a potential buying opportunity.
Death Cross (Bearish): Red (long) or white (short) triangles indicate the index crossing below 95, signaling a potential selling opportunity.
Set Alerts:
Use TradingView's alert system to create notifications for the four alert conditions: Long Index Valley, Long Index Peak, Short Index Valley, and Short Index Peak.
Customize Visuals:
The ticker table displays the symbol and lookback periods in the top-right corner.
Adjust colors and styles via TradingView's settings if desired.
Example Use Cases
Swing Trading: Use the short-term index (e.g., 50 bars) to identify short-term reversals within a broader trend defined by the long-term index.
Trend Confirmation: Monitor the fill between indices to confirm whether the short-term trend aligns with the long-term trend.
Automated Trading: Leverage alert conditions to integrate with bots or manual trading strategies.
Notes
Testing: Always backtest the indicator on your chosen market and timeframe to validate its effectiveness.
Optional Histogram: The script includes a commented-out histogram for the index difference (index_short - index_long). Uncomment the plot(index_diff, ...) line to enable it.
Compatibility: Built for Pine Script v6 and tested on TradingView as of May 27, 2025.
Acknowledgments
This indicator was inspired by the need for a flexible tool that combines lower-pane analysis with main chart signals, made possible by Pine Script's force_overlay feature. Share your feedback or suggestions in the comments below, and happy trading!

Mean Reversion Bundle [ActiveQuants]The Mean Reversion Bundle indicator is a powerful and versatile toolkit designed for traders who specialize in mean reversion strategies . This comprehensive bundle integrates eight key technical indicators renowned for their ability to identify potential price reversals, overbought/oversold conditions, and market exhaustion points. By consolidating Moving Averages (Fast & Slow) , Bollinger Bands , RSI (with Divergence) , Stochastic , Keltner Channels , Standard Pivot Points , ATR , and the Choppiness Index into a single, efficient script, it significantly streamlines chart analysis and empowers robust strategy development.
This bundle operates on the core principle of mean reversion: prices tend to revert to their historical average or mean over time . The included indicators provide multiple perspectives to assess these potential turning points:
Dynamic Support/Resistance: Moving Averages, Bollinger Bands, Keltner Channels, Pivot Points.
Momentum Oscillators: RSI, Stochastic.
Overbought/Oversold Conditions: RSI, Stochastic, Bollinger Bands.
Volatility Assessment: ATR, Bollinger Bands, Keltner Channels.
Market Condition Filter: Choppiness Index (Range vs. Trend).
Reversal Signals: RSI Divergence, Bollinger Band recovery.
By enabling users to selectively activate, extensively customize, and visualize these tools ( often with multi-timeframe capabilities ), the Mean Reversion Bundle facilitates a nuanced and layered approach to identifying high-probability mean reversion setups.
█ KEY FEATURES
All-in-One Mean Reversion Suite: Access eight distinct mean reversion indicators within a single TradingView script slot, saving valuable indicator space.
Modular Design: Easily toggle each indicator (Fast MA, Slow MA, Bollinger Bands, RSI, Stochastic, Keltner Channels, Pivot Points, ATR, Choppiness Index) On or Off through the intuitive settings menu to tailor your analysis.
Deep Customization: Fine-tune a wide array of parameters for every indicator, including lengths, sources, MA types, colors, line styles, levels, and specific calculation methods to precisely match your trading strategy and the asset's characteristics.
Multi-Timeframe (MTF) Capability: Configure most indicator components to analyze data from a different timeframe than your main chart, providing crucial higher-level context for mean reversion signals (e.g., daily RSI on an hourly chart).
Integrated Alert System: Pre-built alert conditions for critical mean reversion events such as:
- Price Crossover/Crossunder (Fast MA)
- Price Crossover/Crossunder (Slow MA)
- Lower Bollinger Band Recovery
- Upper Bollinger Band Recovery
- Bullish RSI Divergence
- Bearish RSI Divergence
Set up these alerts directly through TradingView's alert creation dialog. (See section on "█ SETTING UP ALERTS " for more details).
Advanced MA & RSI Smoothing: Option to apply a secondary smoothing MA or even Bollinger Bands directly to the Fast MA, Slow MA, and RSI lines for refined signal generation.
Sophisticated Pivot Points Module: Includes multiple Pivot Point types (Traditional, Fibonacci, Woodie, Classic, DM, Camarilla) with flexible timeframes (Daily to Decennially) and dynamic drawing of historical levels.
RSI Divergence Detection: Automatically plots potential bullish and bearish divergences between price and the RSI, a classic reversal signal.
█ USER INPUTS
The settings panel is organized into distinct sections for each of the 8 core indicator components:
Fast MA & Slow MA: On/Off, MA Type, Source, Length, Color, Line Width, Smoothing Type (None, MA, or MA + BBs), Smoothing Length, BB StdDev (if smoothing with BBs), Timeframe, Wait TF Close.
Bollinger Bands: On/Off, Length, Basis MA Type, Source, StdDev Multiplier, Offset, Colors, Timeframe, Wait TF Close.
RSI: On/Off, Source, Length, Overbought/Middle/Oversold Levels, Color, Line Width, Smoothing Type (None, MA, or MA + BBs), Smoothing Length, BB StdDev (if smoothing with BBs), Plot Divergence, Divergence Lookback Left/Right, Timeframe, Wait TF Close.
Stochastic: On/Off, %K Length, %K Smoothing, %D Smoothing, Overbought/Middle/Oversold Levels, Colors, Timeframe, Wait TF Close.
Keltner Channels: On/Off, Length, Multiplier, Source, Use Exponential MA (for basis), Bands Style (ATR, TR, Range), ATR Length, Colors, Timeframe, Wait TF Close.
Pivot Points: On/Off, Type, Pivots Timeframe (Anchor), Number of Pivots Back, Use Daily-based Values, Show Labels, Show Prices, Labels Position, Line Width, Line Style, and individual color/visibility toggles for P, S1-S5, R1-R5.
ATR: On/Off, Length, Smoothing Type, Color, Timeframe, Wait TF Close.
Choppiness Index: On/Off, Length, Offset, Upper/Middle/Lower Band Levels, Color, Timeframe, Wait TF Close.
█ SETTING UP ALERTS
The Mean Reversion Bundle comes with several pre-configured alert conditions to notify you of potential trading opportunities. To set up an alert:
Click the " Alert " button (clock icon) on TradingView's right-hand toolbar or top panel.
In the " Condition " dropdown, select " Mean Reversion Bundle ".
A second dropdown will appear, allowing you to choose from the specific alert conditions built into the script (e.g., " Price Crossover (Fast MA) ", " Bullish RSI Divergence ", " Lower Bollinger Band Recovery ").
You can also create more complex alerts by selecting one of the indicator's plotted lines (e.g., " RSI ", " Stochastic %K ", " Bollinger Band Basis ") in the first condition box, then choosing a comparison (e.g., " Crossing Down ", " Greater Than "), and then selecting another value or plotted line from the indicator in the third box.
Choose your preferred " Trigger " option:
- " Only Once ": The alert triggers the first time the condition is met, even on an unclosed (intra-bar) candle. The alert then deactivates.
- " Once Per Bar Close ": (Recommended for most mean reversion signals) The alert triggers only after the current bar closes if the condition was true on that closed bar. This ensures signals are based on confirmed price action and allows the alert to re-trigger on subsequent bars if the condition remains true.
- Other options like " Once Per Bar " or " Once Per Minute " are also available for different needs.
Customize the alert name, message, and notification preferences.
Click " Create ".
█ STRATEGY EXAMPLES
The following examples are for illustrative purposes only to demonstrate how indicators in this bundle can be combined for mean reversion strategies. They are not financial advice. Always conduct thorough backtesting and research.
1. Bollinger Band Reversal with RSI Confirmation
Goal: Identify potential reversals when price touches an outer Bollinger Band and RSI shows overbought/oversold conditions.
Setup: Enable Bollinger Bands (e.g., 20,2), RSI (e.g., 14), and optionally the Choppiness Index.
Entry (Long):
- Price touches or briefly closes below the Lower Bollinger Band.
- RSI is in the oversold region (e.g., below 30) or shows bullish divergence.
- Optional Filter: Choppiness Index > 61.8 (indicating a ranging market favorable for BB mean reversion).
- Enter on a confirming candle (e.g., price closes back inside the Lower Band, or a bullish candle pattern forms).
Entry (Short): Reverse logic for Upper Bollinger Band and overbought RSI (e.g., above 70) or bearish divergence.
Management: Stop-loss beyond the recent swing low/high or a multiple of ATR. Target the Bollinger Band basis line or the opposite band.
2. Stochastic Oversold/Overbought with Pivot Point Support/Resistance
Goal: Trade bounces from key Pivot Point levels when confirmed by Stochastic extremes.
Setup: Enable Stochastic (e.g., 14,3,3), Pivot Points (e.g., Daily Traditional), and Fast MA (e.g., 9 EMA) for short-term trend context.
Entry (Long):
- Price approaches a significant Pivot Support level (S1, S2).
- Stochastic %K and %D lines are in the oversold region (e.g., below 20) and ideally show a bullish crossover (%K crosses above %D).
- Optional Filter: Price is above the Fast MA, or the Fast MA starts to slope up.
- Enter on signs of price rejection at the Pivot level.
Entry (Short): Reverse logic for Pivot Resistance levels (R1, R2) and overbought Stochastic (e.g., above 80) with a bearish crossover.
Management: Stop-loss below the Pivot Support (for longs) or above Pivot Resistance (for shorts). Target the next Pivot level or a fixed risk-reward ratio.
3. RSI Divergence at Keltner Channel Extremes
Goal: Capitalize on weakening momentum (divergence) as price tests the outer Keltner Channel bands.
Setup: Enable RSI (with Divergence plotting enabled), Keltner Channels (e.g., 20,2 EMA basis, ATR 10), and ATR (for stop placement).
Entry (Long):
- Price is testing or near the Lower Keltner Channel band.
- A Bullish RSI Divergence is plotted (price makes a lower low, but RSI makes a higher low).
- Enter once the divergence is confirmed and price shows signs of turning up.
Entry (Short):
- Price is testing or near the Upper Keltner Channel band.
- A Bearish RSI Divergence is plotted (price makes a higher high, but RSI makes a lower high).
- Enter once divergence is confirmed and price shows signs of turning down.
Management: Place stop-loss based on ATR (e.g., 1.5x ATR below entry for longs) or beyond the Keltner Channel. Target could be the Keltner basis line or a measured move.
█ CONCLUSION
The Mean Reversion Bundle offers a sophisticated yet user-friendly suite of tools essential for traders focusing on mean reversion. By consolidating these powerful indicators, providing extensive customization , multi-timeframe analysis , and integrated alerts , this bundle simplifies the analytical workflow and aids in the development of more robust and nuanced trading strategies. Whether identifying potential exhaustion points, confirming overbought/oversold conditions, or finding precise entry near dynamic support/resistance, this bundle is a versatile asset for your technical analysis toolkit.
█ IMPORTANT NOTES
⚠ Parameter Optimization: The default settings are starting points. Always adjust indicator parameters (lengths, multipliers, levels) based on the specific asset, its volatility, and the timeframe you are trading. Thorough backtesting is crucial.
⚠ Multi-Timeframe Dynamics: Using the " Timeframe " input can be very powerful. If " Wait TF Close " is enabled (default), signals from higher timeframes will only update upon the close of that higher timeframe bar. Disabling it may lead to signals changing intra-bar.
⚠ Confluence is Key: Avoid relying on a single indicator. The strength of this bundle lies in combining signals from multiple indicators to build a confluence case for a trade.
⚠ Chart Clarity: While many tools are available, only enable those pertinent to your current strategy to maintain a clear and actionable chart.
⚠ Signal Confirmation: Indicator signals are typically finalized on bar close. Be cautious when acting on intra-bar signals, as they can change before the bar is complete. Using " Once Per Bar Close " for alerts is generally recommended for mean reversion signals.
█ RISK DISCLAIMER
Trading involves a substantial risk of loss and is not suitable for all investors. The Mean Reversion Bundle indicator is provided for educational and informational purposes only . It does NOT constitute financial advice or a recommendation to buy or sell any asset. Indicator signals identify potential patterns based on historical data but do not guarantee future price movements or profitability. Always conduct your own thorough research, utilize multiple sources of information, and implement robust risk management practices before making any trading decisions. Past performance is not indicative of future results.
📊 Happy trading! 🚀

MA Dispersion+MA Dispersion+ — read the “breathing space” between your moving-averages
Get instant feedback on trend strength, volatility expansion and mean-reversion — across any timeframe.
MA Dispersion+ turns the humble moving-average stack into a single, easy-to-read oscillator that tells you at a glance whether price is coiling or fanning out.
🧩 What it does
Plugs into your favourite MA setup
• Pick the classic 5 / 20 / 50 / 200 lengths or disable any combination with one click.
• Choose the MA engine you trust — SMA, EMA, RMA, VWMA or WMA.
• Works on any timeframe thanks to TradingView’s security() engine.
Measures “spread”
For every bar it calculates the absolute distance of each selected MA from their average.
The tighter the stack, the lower the value; the wider the fan, the higher the value.
Adds professional-grade controls
• Weighting — let short-term MAs dominate (Inverse Length), keep everything equal, or dial in your own custom weights.
• Normalisation — convert the raw distance into a percentage of price, ATR multiples, or scale by the MAs’ own mean so you can compare symbols of any price or volatility.
🔍 How traders use it
Trend confirmation – rising dispersion while price breaks out = momentum is genuine.
Volatility squeeze – dispersion parking near zero warns that a big move is loading.
Multi-TF outlook – drop one pane per timeframe (e.g. 5 m, 1 h, 1 D) and see which layer of the market is driving.
Mean-reversion plays – spikes that fade quickly often coincide with exhaustion and snap-backs.
⚙️ Quick-start
Add MA Dispersion+ to your chart.
Set the pane’s timeframe in the first input.
Tick the MA lengths you actually use.
(Optional) Pick a weighting scheme and a normaliser.
Repeat the indicator for as many timeframes as you like — each instance keeps its own settings.
✨ Why you’ll love it
Zero clutter – one orange line tells you what four separate MAs whisper.
Configurable yet bullet-proof – all lengths are hard-coded constants, so Pine never complains.
Context aware – normalisation lets you compare BTC’s $60 000 chaos with EURUSD’s four--decimals calm.
Lightweight – no labels, no drawings, no background processing — perfect for mobile and multi-pane layouts.
Give MA Dispersion+ a try and let your charts breathe — you’ll never look at moving-average ribbons the same way again.
Happy trading!
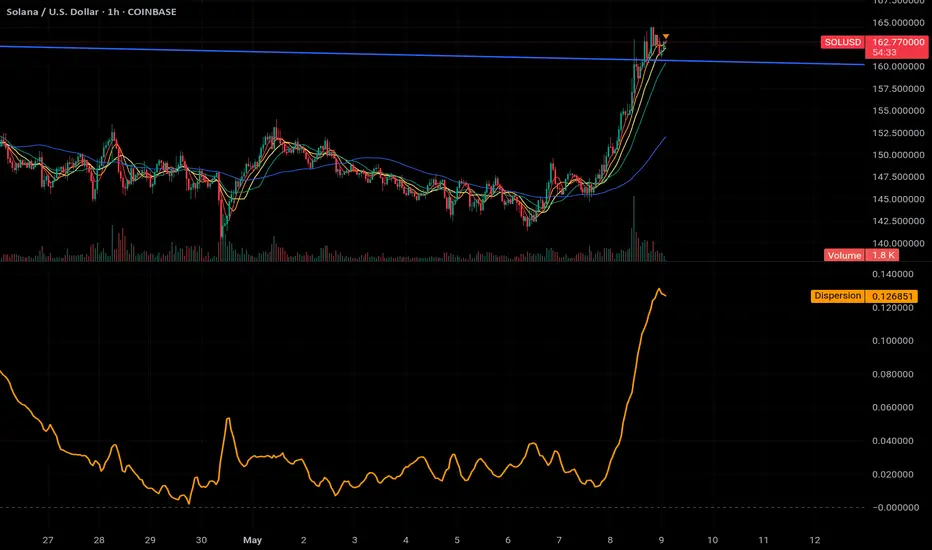
SynchroTrend Oscillator (STO) [PhenLabs]📊 SynchroTrend Oscillator
Version: PineScript™ v5
📌 Description
The SynchroTrend Oscillator (STO) is a multi-timeframe synchronization tool that combines trend information from three distinct timeframes into a single, easy-to-interpret oscillator ranging from -100 to +100.
This indicator solves the common problem of having to analyze multiple timeframe charts separately by consolidating trend direction and strength across different time horizons. The STO helps traders identify when markets are truly synchronized across timeframes, potentially indicating stronger trend conditions and higher probability trading opportunities.
Using either Moving Average crossovers or RSI analysis as the trend definition metric, the STO provides a comprehensive view of market structure that adapts to various trading strategies and market conditions.
🚀 Points of Innovation
Triple-timeframe synchronization in a single view eliminates chart switching
Dual trend detection methods (MA vs Price or RSI) for flexibility across different markets
Dynamic color intensity that automatically increases with signal strength
Scaled oscillator format (-100 to +100) for intuitive trend strength interpretation
Customizable signal thresholds to match your risk tolerance and trading style
Visual alerts when markets reach full synchronization states
🔧 Core Components
Trend Scoring System: Calculates a binary score (+1, -1, or 0) for each timeframe based on selected metrics, providing clear trend direction
Multi-Timeframe Synchronization: Combines and scales trend scores from all three timeframes into a single oscillator
Dynamic Visualization: Adjusts color transparency based on signal strength, creating an intuitive visual guide
Threshold System: Provides customizable levels for identifying potentially significant trading opportunities
🔥 Key Features
Triple Timeframe Analysis: Synchronizes three user-defined timeframes (default: 60min, 15min, 5min) into one view
Dual Trend Detection Methods: Choose between Moving Average vs Price or RSI-based trend determination
Adjustable Signal Smoothing: Apply EMA, SMA, or no smoothing to the oscillator output for your preferred signal responsiveness
Dynamic Color Intensity: Colors become more vibrant as signal strength increases, helping identify strongest setups
Customizable Thresholds: Set your own buy/sell threshold levels to match your trading strategy
Comprehensive Alerts: Six different alert conditions for crossing thresholds, zero line, and full synchronization states
🎨 Visualization
Oscillator Line: The main line showing the synchronized trend value from -100 to +100
Dynamic Fill: Area between oscillator and zero line changes transparency based on signal strength
Threshold Lines: Optional dotted lines indicating buy/sell thresholds for visual reference
Color Coding: Green for bullish synchronization, red for bearish synchronization
📖 Usage Guidelines
Timeframe Settings
Timeframe 1: Default: 60 (1 hour) - Primary higher timeframe for trend definition
Timeframe 2: Default: 15 (15 minutes) - Intermediate timeframe for trend definition
Timeframe 3: Default: 5 (5 minutes) - Lower timeframe for trend definition
Trend Calculation Settings
Trend Definition Metric: Default: “MA vs Price” - Method used to determine trend on each timeframe
MA Type: Default: EMA - Moving Average type when using MA vs Price method
MA Length: Default: 21 - Moving Average period when using MA vs Price method
RSI Length: Default: 14 - RSI period when using RSI method
RSI Source: Default: close - Price data source for RSI calculation
Oscillator Settings
Smoothing Type: Default: SMA - Applies smoothing to the final oscillator
Smoothing Length: Default: 5 - Period for the smoothing function
Visual & Threshold Settings
Up/Down Colors: Customize colors for bullish and bearish signals
Transparency Range: Control how transparency changes with signal strength
Line Width: Adjust oscillator line thickness
Buy/Sell Thresholds: Set levels for potential entry/exit signals
✅ Best Use Cases
Trend confirmation across multiple timeframes
Finding high-probability entry points when all timeframes align
Early detection of potential trend reversals
Filtering trade signals from other indicators
Market structure analysis
Identifying potential divergences between timeframes
⚠️ Limitations
Like all indicators, can produce false signals during choppy or ranging markets
Works best in trending market conditions
Should not be used in isolation for trading decisions
Past performance is not indicative of future results
May require different settings for different markets or instruments
💡 What Makes This Unique
Combines three timeframes in a single visualization without requiring multiple chart windows
Dynamic transparency feature that automatically emphasizes stronger signals
Flexible trend definition methods suitable for different market conditions
Visual system that makes multi-timeframe analysis intuitive and accessible
🔬 How It Works
1. Trend Evaluation:
For each timeframe, the indicator calculates a trend score (+1, -1, or 0) using either:
MA vs Price: Comparing close price to a moving average
RSI: Determining if RSI is above or below 50
2. Score Aggregation:
The three trend scores are combined and then scaled to a range of -100 to +100
A value of +100 indicates all timeframes show bullish conditions
A value of -100 indicates all timeframes show bearish conditions
Values in between indicate varying degrees of alignment
3. Signal Processing:
The raw oscillator value can be smoothed using EMA, SMA, or left unsmoothed
The final value determines line color, fill color, and transparency settings
Threshold levels are applied to identify potential trading opportunities
💡 Note:
The SynchroTrend Oscillator is most effective when used as part of a comprehensive trading strategy that includes proper risk management techniques. For best results, consider using the oscillator in conjunction with support/resistance levels, price action analysis, and other complementary indicators that align with your trading style.

Machine Learning RSI ║ BullVisionOverview:
Introducing the Machine Learning RSI with KNN Adaptation – a cutting-edge momentum indicator that blends the classic Relative Strength Index (RSI) with machine learning principles. By leveraging K-Nearest Neighbors (KNN), this indicator aims at identifying historical patterns that resemble current market behavior and uses this context to refine RSI readings with enhanced sensitivity and responsiveness.
Unlike traditional RSI models, which treat every market environment the same, this version adapts in real-time based on how similar past conditions evolved, offering an analytical edge without relying on predictive assumptions.
Key Features:
🔁 KNN-Based RSI Refinement
This indicator uses a machine learning algorithm (K-Nearest Neighbors) to compare current RSI and price action characteristics to similar historical conditions. The resulting RSI is weighted accordingly, producing a dynamically adjusted value that reflects historical context.
📈 Multi-Feature Similarity Analysis
Pattern similarity is calculated using up to five customizable features:
RSI level
RSI momentum
Volatility
Linear regression slope
Price momentum
Users can adjust how many features are used to tailor the behavior of the KNN logic.
🧠 Machine Learning Weight Control
The influence of the machine learning model on the final RSI output can be fine-tuned using a simple slider. This lets you blend traditional RSI and machine learning-enhanced RSI to suit your preferred level of adaptation.
🎛️ Adaptive Filtering
Additional smoothing options (Kalman Filter, ALMA, Double EMA) can be applied to the RSI, offering better visual clarity and helping to reduce noise in high-frequency environments.
🎨 Visual & Accessibility Settings
Custom color palettes, including support for color vision deficiencies, ensure that trend coloring remains readable for all users. A built-in neon mode adds high-contrast visuals to improve RSI visibility across dark or light themes.
How It Works:
Similarity Matching with KNN:
At each candle, the current RSI and optional market characteristics are compared to historical bars using a KNN search. The algorithm selects the closest matches and averages their RSI values, weighted by similarity. The more similar the pattern, the greater its influence.
Feature-Based Weighting:
Similarity is determined using normalized values of the selected features, which gives a more refined result than RSI alone. You can choose to use only 1 (RSI) or up to all 5 features for deeper analysis.
Filtering & Blending:
After the machine learning-enhanced RSI is calculated, it can be optionally smoothed using advanced filters to suppress short-term noise or sharp spikes. This makes it easier to evaluate RSI signals in different volatility regimes.
Parameters Explained:
📊 RSI Settings:
Set the base RSI length and select your preferred smoothing method from 10+ moving average types (e.g., EMA, ALMA, TEMA).
🧠 Machine Learning Controls:
Enable or disable the KNN engine
Select how many nearest neighbors to compare (K)
Choose the number of features used in similarity detection
Control how much the machine learning engine affects the RSI calculation
🔍 Filtering Options:
Enable one of several advanced smoothing techniques (Kalman Filter, ALMA, Double EMA) to adjust the indicator’s reactivity and stability.
📏 Threshold Levels:
Define static overbought/oversold boundaries or reference dynamically adjusted thresholds based on historical context identified by the KNN algorithm.
🎨 Visual Enhancements:
Select between trend-following or impulse coloring styles. Customize color palettes to accommodate different types of color blindness. Enable neon-style effects for visual clarity.
Use Cases:
Swing & Trend Traders
Can use the indicator to explore how current RSI readings compare to similar market phases, helping to assess trend strength or potential turning points.
Intraday Traders
Benefit from adjustable filters and fast-reacting smoothing to reduce noise in shorter timeframes while retaining contextual relevance.
Discretionary Analysts
Use the adaptive OB/OS thresholds and visual cues to supplement broader confluence zones or market structure analysis.
Customization Tips:
Higher Volatility Periods: Use more neighbors and enable filtering to reduce noise.
Lower Volatility Markets: Use fewer features and disable filtering for quicker RSI adaptation.
Deeper Contextual Analysis: Increase KNN lookback and raise the feature count to refine pattern recognition.
Accessibility Needs: Switch to Deuteranopia or Monochrome mode for clearer visuals in specific color vision conditions.
Final Thoughts:
The Machine Learning RSI combines familiar momentum logic with statistical context derived from historical similarity analysis. It does not attempt to predict price action but rather contextualizes RSI behavior with added nuance. This makes it a valuable tool for those looking to elevate traditional RSI workflows with adaptive, research-driven enhancements.
