Combo Backtest 123 Reversal & RSI HistoAlert This is combo strategies for get a cumulative signal.
First strategy
This System was created from the Book "How I Tripled My Money In The
Futures Market" by Ulf Jensen, Page 183. This is reverse type of strategies.
The strategy buys at market, if close price is higher than the previous close
during 2 days and the meaning of 9-days Stochastic Slow Oscillator is lower than 50.
The strategy sells at market, if close price is lower than the previous close price
during 2 days and the meaning of 9-days Stochastic Fast Oscillator is higher than 50.
Second strategy
This simple indicator modified RSI
WARNING:
- For purpose educate only
- This script to change bars colors.
Pengayun

VWMA with kNN Machine Learning: MFI/ADXThis is an experimental strategy that uses a Volume-weighted MA (VWMA) crossing together with Machine Learning kNN filter that uses ADX and MFI to predict, whether the signal is useful. k-nearest neighbours (kNN) is one of the simplest Machine Learning classification algorithms: it puts input parameters in a multidimensional space, and then when a new set of parameters are given, it makes a prediction based on plurality vote of its k neighbours.
Money Flow Index (MFI) is an oscillator similar to RSI, but with volume taken into account. Average Directional Index (ADX) is an indicator of trend strength. By putting them together on two-dimensional space and checking, whether nearby values have indicated a strong uptrend or downtrend, we hope to filter out bad signals from the MA crossing strategy.
This is an experiment, so any feedback would be appreciated. It was tested on BTC/USDT pair on 5 minute timeframe. I am planning to expand this strategy in the future to include more moving averages and filters.

RSI Strategy w/ Trailing SL / TP Optimized for Crypto [Strategy]This strategy is designed to use the RSI and EMA filters. A 200 period EMA is used for short / long filters, and the 50 period EMA is used to determine the direction of the short term trend.
In addition, the script uses "rate of change" for the fast EMA (trend), volume , RSI (momentum), and price (volatility) and only takes trades when all are in optimal conditions.
I.E., the EMA is in an uptrend, the volume is increasing, price is in an uptrend, and the RSI is in an uptrend, so we will place a Long trade.
This strategy uses EMAs as a trailing stop loss and take profit. As this is a trend following strategy, the idea is to maximize profits when correct and minimize losses when
wrong.
It was designed specifically using crypto pairs, and was optimized for the 10 minute chart.
My goal was to get the best use out of the RSI indicator. I was originally an MACD fanboy, but have recently converted.
Want to help me improve this code or strategy? Have suggestions for improvement? Leave them in the comments below.
Thanks for using my script! I hope it works well for you and good luck in the markets.
If you have any questions, please leave them in the comments and I'll do my best to respond.
This script does not repaint as it only relies on close data to make a decision to enter a trade.
How to use this strategy:
___________________________
Enable Long Entries? - Used to enable or disable the strategy from executing long entries.
Enable Short Entries? - Used to enable or disable the strategy from executing short entries.
How Many Bars To Look Back for Hi/Lo: - This is used for the Stop Loss and Take Profit targets. An integer of bars is used to look back and calculate the values.
RSI Length (Rec: 8) - The length of the RSI
Source - The RSI Source
Use Slow EMA? - If checked, a 200 period EMA will be used to filter entries long or short (only take shorts when the price is below, long when above). In addition, the script will close any trades that cross the 200 period EMA. By default this is disabled.
EMA Slow - the period of the Slow EMA (200 by default)
EMA Slow Src - what to use to calculate the Slow EMA (high by default)
EMA Fast - The Fast EMA (50 period) is used to calculate the direction of the short term trend. This also factored into the Rates of Change.
EMA Fast Src - what to use to calculate the Fast EMA
ATR Length - If used, the ATR length is used to calculate the Stop Loss and Take Profit targets.
SL Multiplier - The distance away from the initial value to multiply the Stop Loss
TP Multiplier - The distance away from the initial value to multiply the Take Profit.
Use EMA as SL / TP? - If true (default) a 3 period EMA is used to calculate Stop Loss and Take Profit targets. Else, an ATR is used to calculate these values.
Stop Loss / Take Profit Offset - Default: 3 - this is used to shift the EMA / ATR Stop Loss and Take Profit lines to the right X bars. This is to ensure that they are hit properly and not exceeded.
Short Len Vol - Use to calculate the volume of the short length, used in rate of change calculations
Long Len - Use to calculate the volume of the long length, used in rate of change calculations
RSI Long Entry Val - Minimum RSI crossover value to enter a trade Long. If the RSI is below this value, trade entries are not valid.
RSI Long Cutoff Threshold - Long entry RSI value cutoff to no longer enter trades. If the RSI is above this value, trades entries are not valid.
RSI Short Entry Val - Minimum RSI crossover value to enter a trade Short. If the RSI is above this value, trade entries are not valid.
RSI Short Cutoff Threshold - Short entry RSI value cutoff to no longer enter trades. If the RSI is below this value, trades entries are not valid.
ROC Fast EMA - Calculates the rate of change between the Fast Ema now and 'X' bars ago. For a long entry, a positive value is needed, and for a short entry, a negative value is needed.
ROC Price - Calculates the rate of change between the most recent price close and 'X' bars ago. For a long entry, a positive value is needed, and for a short entry, a negative value is needed.
ROC RSI - Calculates the rate of change between the RSI now and 'X' bars ago. For a long entry, a positive value is needed, and for a short entry, a negative value is needed.
Use Close for SL - Default = Off - If checked, when a candle hits the stop loss, the trade will close on the next candle. If unchecked, the trade will remain open until the candle closes at or beyond the stop loss lines.
Custom Message Boxes - Primarily used for bots, but can be used to also insert your own messages for your trading alerts.

How to use Leverage and Margin in PineScriptEn route to being absolutely the best and most complete trading platform out there, TradingView has just closed 2 gaps in their PineScript language.
It is now possible to create and backtest a strategy for trading with leverage.
Backtester now produces Margin Calls - so recognizes mid-trade drawdown and if it is too big for the broker to maintain your trade, some part of if will be instantly closed.
New additions were announced in official blogpost , but it lacked code examples, so I have decided to publish this script. Having said that - this is purely educational stuff.
█ LEVERAGE
Let's start with the Leverage. I will discuss this assuming we are always entering trades with some percentage of our equity balance (default_qty_type = strategy.percent_of_equity), not fixed order quantity.
If you want to trade with 1:1 leverage (so no leverage) and enter a trade with all money in your trading account, then first line of your strategy script must include this parameter:
default_qty_value = 100 // which stands for 100%
Now, if you want to trade with 30:1 leverage, you need to multipy the quantity by 30x, so you'd get 30 x 100 = 3000:
default_qty_value = 3000 // which stands for 3000%
And you can play around with this value as you wish, so if you want to enter each trade with 10% equity on 15:1 leverage you'd get default_qty_value = 150.
That's easy. Of course you can modify this quantity value not only in the script, but also afterwards in Script Settings popup, "Properties" tab.
█ MARGIN
Second newly released feature is Margin calculation together with Margin Calls. If the market goes against your trades and your trading account cannot maintain mid-trade drawdown - those trades will be closed in full or partly. Also, if your trading account cannot afford to open more trades (pyramiding those trades), Margin mechanism will prevent them from being entered.
I will not go into details about how Margin calculation works, it was all explainged in above mentioned blogpost and documentation .
All you need to do is to add two parameters to the opening line of your script:
margin_long = 1./30*50, margin_short = 1./30*50
Whereas "30" is a leverage scale as in 30:1, and "50" stands for 50% of Margin required by your broker. Personally the Required Margin number I've met most often is 50%, so I'm using value 50 here, but there are literally 1000+ brokers in this world and this is individual decision by each of them, so you'd better ask yourself.
--------------------
Please note, that if you ever encounter a strategy which triggers Margin Call at least once, then it is probably a very bad strategy. Margin Call is a last resort, last security measure - all the risks should be calculated by the strategy algorithm before it is ever hit. So if you see a Margin Call being triggred, then something is wrong with risk management of the strategy. Therefore - don't use it!

PMax on Rsi w/T3 *Strategy*Profit Maximizer Indicator on RSI with Tillson T3 Moving Average:
PMax uses ATR calculation inside, for this reason users couldn't manage to use PMax on RSI because RSI indicator doesn't have High and Low values in bars, but ATR needs that values. So I personally calculate RSI in a different way to have High and Low values of RSI wrt price bars.
IMPORTANT:
Because of the sudden movements and divergences on RSI , this indicator must firstly optimized for the charts before using. Optimization can be held by users for the meaningful parameters for each chart.
3 parameters are critical when optimizing:
First: Multiplier
Second: Tillson T3 Length
Third: T3 Volume Factor
Says, Kıvanç Özbilgiç. Here's the strategy version for you to backtest & optimize properly.
Enjoy.

Scalper Helper System===========================================================================
===========================================================================
Description
===========================================================================
===========================================================================
Scalper Helper System combines a series of trade strategies which have been learned and honed in the Jim of All Trades channel.
Paixy has contributed candlestick combination rules, Jonas has shared his deep understanding of Stochastic.
Jim himself has taught clearly on the merits of RSI.
This system attempts to formulate all the notes and rules I have made over the past months.
The system searches for 10 - 15 rules which are divided into bullets and bombs. Bombs relate to momentum, so these signals may not be pinpoint accurate, but they are more often leading to bigger moves.
This initial version is released mainly only to the JOAT community to help continue the development of the idea and to help find
continued improvements.
Special thanks to FiendishFeather for his strategy work, (check out his work to learn how to apply any trading strategy to his back testing harness), and the date filtering snippet and the tip to show this option at the top.
===========================================================================
===========================================================================
The strategy decisions are based on the following general rules:
===========================================================================
===========================================================================
BULLETs are hint to the idea of firing a small sized position into the market, BOMBs are hints to go all in - however this does not mean proper risk management should be forgotten.
Without risk management this and any strategy will lead to failure.
Without risk management this and any strategy will lead to failure.
Without risk management this and any strategy will lead to failure.
Without risk management this and any strategy will lead to failure.
===========================================================================
Bullet1 uses the value of the stochastic and checks for buy/sell cross over on 5m, 8m and 13m chart.
These values should be calculated on a ratio basis ideally.
Bullet2 measures divergence between the printed Stochastic signals.
Bullet3 has been decommissioned.
Bullet4 is an RSI divergence and value indicator.
Bullet5 has been decommissioned.
Bullet6 uses the history of the stochastic buy and sell signals
Bullet7 uses the Scalper Helper Trends for entries by attempting to see how the overall trend is changing. More refinement is needed here.
Bullet8 uses the Scalper Helper Trends on multiple timeframes for entries.
Bullet9 strict buy/sell signals from Stochastic RSI
Bomb1 relies on the Fast, Medium and Slow MA's being correctly lined up as well as the Stochastic, this hints at a more imminent move and so the strategy suggests a quicker entry.
Bomb2 relies on the Fast, Medium and Slow MA's NOT being correctly lined up as well as the Stochastic, and therefore has the luxury of suggesting Limit orders near the local high/low.
Bomb3 looks for two or more Stochastics signals in the same direction and then performs a divergence calculation.
Bomb4 looks a change in the Stochastics signals direction and then performs a divergence calculation.
===========================================================================
===========================================================================
Configuration settings:
===========================================================================
===========================================================================
Users can chose to show mainly buy and/or sell signals and can select a level of strictness. Enabling strict rules will force a multi timeframe comparison of Stochastic analysis.
Users can try different levels for long and short targets for profit and stop loss. This is important because the market does not behave the same going up as it does going down.
The RSI conditional check makes the strategy more selective. This discernment can be applied to bullets or bombs in order to validate entry and exits.
During the bull run and perhaps even in ranging markets, the RSI overbought levels is usually 70-80, but in the bear market we are seeing in Crypto now, a value of 60 is more useful. Try for yourself to see what works for you and feedback in the comments.
An additional indicator, Scalper Helper Trends is recommended to get a quick view on the trend condition (rally, base, down) by viewing the MACD from multiple time frames. Further research is required to know which larger timeframes work best here.
For the 15min chart, 15m, 30m, 45m, 60m, 120m, 240m, 360m, 960m would work well. Note it is not possible to go higher than 1000 at this time.
Whether you use the Scalper Helper trends or not for your own visual confirmation, it is possible to allow this indicator to attempt to read it for you. More research is required to best model the reading of this. For now, it will simply measure the gradient of the number of up versus down colors.
The system can also find entries off the Scalper Helper Trends - but really this, by design is not the best use of Scalper Helper Trends. Although you may prove me wrong so the option is given for you to find buy/sells with your own testing.
Users can chose to use some engulfing candle arrangements to trigger exits and define the length of the 200MA and decide if this should play a part in the filtering of the signals. Similarly, a check can be made to ensure that the first two candles after a signal are behaving as we would expect with the "Wait for 2 closing in the direction of the signal" option. This has a lot of value on the 1min chart.
When Revenge trade is set to true you may re-enter a trade in the same direction as the last one when the last one was stopped out, otherwise you would only be looking for trades in the other direction. We all should not revenge trade, and indeed I have only seen a few cases when it has increased the profitability, however this option remains for now.
The flip opens a new trade in the reverse direction when a signal is given to close a trade, but does not apply to scenarios where stop losses or take profit closed the trade.

3 EMA + Stochastic RSI + ATR 3ESRA
v0.2a
Coded by Vaida Bogdan
3ESRA consists of a 3 EMA cross + a close above (for longs) the quickest EMA
or below (for shorts). Note that I've deactivated the RSI Cross Over/Under
(you can modify the code and activate it). The strategy also uses a stop loss
that's at 1 ATR distance from the entry price and a take profit that's at
4 times the ATR distance from the entry price.
Relative Volume & RSI PopThis is a basic idea/script designed to take a breakout trade by taking advantage of volume spikes when price/strength is extended (either long or short).
The script only utilises two indicators, the Relative Volume (RV) and the Relative Strength Index (RSI). The script allows the user to select a RSI value between 69 up to 100 for a long trade and between 35 down to 0 for short trade and then pair this with RV from 0 - 10. The period for both the RSI and RV can also be amended by the user but I found in most cases there was no benefit gained by changing away from normal "14" period lookback. The script typically only has small draw downs as the script is designed to exit the trade when the RSI returns back to "normalised" level, therefore the trades are generally quite short. The exit condition for a long trade is when RSI crosses back below 69 (which is why you cannot enter a long below this value) and for a short the, trade will close when RSI crosses back above 35 (which is why you cannot enter a short above this value). These exit values are locked.
By allowing RSI value to go all the way up to "100" on the long side and "0" on the short side this in effect is a way of eliminating the script from taking either longs or shorts if lets say you wanted to back test the script for long only spikes or short only spike. E.G. By setting RSI upper value to "75" the RV to "1" and RSI lower value to "0" then no short trades will not be taken in your back test as the RSI never really gets down to zero.
I put this together with meme stocks in mind and back tested it on day charts for AMC and then a few trending style stocks too. It typically worked best as long only and with RSI settings between 71 - 75 and RV at 1 or 1.5. I also found it had okay results on some lower 1hr timeframe futures markets and weekly time frames too (albeit trades were few and far between on weekly timeframe).
The beauty of such a basic script you could easily set up a trading view screener to look for these opportunities everyday and perhaps even add in an ADX filter on the screener to see if the trend is increasing. Then use this script to run a back test on the stocks that you've selected from the screener.

MACd+200EMAIndicator used:
MACD default values.
EMA 200
How the script works:
When MACD line Crosses the signal line below the 0 histogram value while candles are above 200EMA a buy signal generated .
When signal line Crosses the MACD line below above 0 histogram value while candles are below 200EMA a buy signal generated .
Default SL and TP:
By default I have set TP =20 pips and SL=20pips
How to manage the trades:
You can manage the trades according to your own rules.
This script shows only the BUY and SELL signal generation and EXIT points when the trade reach 20 pips profit or loss

Know Sure Thing and EMA Strategy by JLXThis is a simple strategy based in Know Sure Thing indicator and an Exponential moving average,
Rules are as follow:
- You can go long when the KST cross signal bellow 0 and price closes above the target EMA
- You can go short when the KST cross signal above 0 and price closes bellow the target EMA
I include a trailing stop loss, default its 0.5%
Hope you enjoy it

Combo Backtest 123 Reversal & RSI based on ROC This is combo strategies for get a cumulative signal.
First strategy
This System was created from the Book "How I Tripled My Money In The
Futures Market" by Ulf Jensen, Page 183. This is reverse type of strategies.
The strategy buys at market, if close price is higher than the previous close
during 2 days and the meaning of 9-days Stochastic Slow Oscillator is lower than 50.
The strategy sells at market, if close price is lower than the previous close price
during 2 days and the meaning of 9-days Stochastic Fast Oscillator is higher than 50.
Second strategy
This is the new-age indicator which is version of RSI calculated upon
the Rate-of-change indicator.
The name "Relative Strength Index" is slightly misleading as the RSI
does not compare the relative strength of two securities, but rather
the internal strength of a single security. A more appropriate name
might be "Internal Strength Index." Relative strength charts that compare
two market indices, which are often referred to as Comparative Relative Strength.
And in its turn, the Rate-of-Change ("ROC") indicator displays the difference
between the current price and the price x-time periods ago. The difference can
be displayed in either points or as a percentage. The Momentum indicator displays
the same information, but expresses it as a ratio.
WARNING:
- For purpose educate only
- This script to change bars colors.

Godtrix's Crypto HA+RSI+EMA+ATH+DCA Strategy 3.0New Updates is here! Upgrade from previous version 2.0 (Please avoid using v2.0 as it's outdated.)
Great stability, Repaint bug fixes, and New features!
==================
| Introduction: |
==================
This is a Long Term Strategy, using compounding profit method, it can generate high returns, but it also risk for losses, this can be overcome if you set Stop Loss to over 25% for bitcoin & 60% for Altcoins.
Best profit plan with this strategy is you trade on Future leverage while you hold on to your coin, so that when price goes up, your coin value goes up, and at the same time, you trade with your leverage to earn even more, easily doubling up your total profit.
Benefits:
Fully customizable and you can easily personalized it and FINE TUNE it according to the market or coin you trading on.
The strategy is based on REAL PRACTICAL trading skills, so it works in real-world.
I fixed the "repainting" issue so the backtest it shows you IS ACCURATE when you run for real-time.
We all know one indicator is not going to help you win your trades, so this strategy combines ALL three: EMA for long+short term trend, HA for short term trend, RSI for entry/exit
This strategy is designed for LONG trade (Buy low, Sell high), not for SHORT trade.
This is not day trading, it is more to mid-term trading, where there's only few trades per month
Mainly is coded to work with 3Commas bot auto trading, so you only need to key in your Bot ID & Email Token.
Bot trading NOTE:
- You need to replace the Alert Message with this: {{strategy.order.alert_message}}
- And you'll need the Bot's webhook Url set with the Alert too.
- One Alert will work for both Buy and Sell Order
- If you using other Bot service, you can enter Custom Command in Input Settings too, it works on any bot service.
Lastly,
regarding the setting advice, I would say you try playing with different settings and your objective is to achieve a backtest result that has:
1) Profitable is > 80%
2) Losing trades is nearly 0 or below 25% of your winning trades. Trick is using far stop loss %
3) Net Profit be almost same or more than "Buy & Hold Profit"
==================
| Latest Updates: |
==================
=| Tidy Up Codings |=
- Group input fields so it'll be easier to understand and find the settings
- Upgrade code for obsolete 'transp' options
=| Repaint Issues |=
- Previous v2.0's RSI has repaint issue, creating false result against real-time data. I've fixed this.
- Also done fine-tuning other parts of the codes to prevent possible repaint issues.
=| Bot System |=
- Improved Custom Bot system, so that you're able to set dynamic order size/quantity with my custom keyword: and
Base Order Example:
{ 'message_type': 'bot', 'bot_id': 1234567, 'email_token': 'abcdefgh-1234-1234-1234', 'base_order': , 'delay_seconds': 0, 'pair': 'USDT_BTC'}
=| EMA Downtrend Exit |=
- Added option for you to decide whether to close position when detected EMA Long term downtrend.
=| EMA 2 (short term) is removed |=
- After several test, I've decided to remove this because it doesn't contribute to improving the results.
=| Heikin Ashi System |=
- Improved the chart display, now you'll see the HA candle 'shadowed' behind, so you'll see both actual price candle and HA candle at same time.
- Added the system that detect the HA candle sizes to decide specifically when it's suitable for Entry and Exit.
>> For "Entry/Exit Range"
- This means after HA is valid for Entry or Exit, how many following bars are allowed to stay valid so it will match other requirements to be completely fulfilled for Entry or Exit.
>> For "Crossing Interval"
- This means after detected HA line crossover, how many HA intervals is allow to Entry or Exit
>> For "Reversed Exit"
- This function let's you decide whether to close position if after HA bull (green candle) changed into HA Bear (red candle)
=| RSI A Entry |=
- Added option to avoid Entry during NTZ (No trade Zone)
- Also added the option to avoid next same condition RSI A entry too soon
=| RSI B Entry |=
- This function is for Entry if RSI is going very low, mostly due to bigger price drops in short time, it's good for buying DIP, however we'll never be able to know when a DIP ends, so do more test on this settings before put into real use.
- Added "avoid" options to help avoid getting Entry at "false" DIP, more like a short & fast pullback which causes RSI to drop very low but actually the price is near ATH or Recent High.
- Added option for Entry with Trailing Price Lower Buy combine with a limit order that grabs low price, so whichever it fulfill first.
=| New: Avoid Entry |=
- Well, it's a pain if you bought at the top, so I've added two options that will avoid buying near ATH and Recent High.
=| Time-limit Removed |=
- Sorry that I've missed look on the script policy which I'm not allowed to put a time-limit for public scripts.
=| System Improvements |=
- HA condition detection is optimized and bug fixed
- RSI values now reads accurately on each bar despite using higher timeframe, especially when moving to next interval
=| New: Dollar Cost Averaging (DCA) Orders |=
- Although DCA strategy is not appealing for Long term strategy, but I've added it for your extra options and flexibilities.
- The settings are quite straight-forward and standard, so I won't be explaining here.
=| New: Backtest Start & End Date |=
- This is very good function when you need more accurate result starting at specific date & time.
- Also if you set the date & time for your real trading starts, it'll much result the same as your actual trading records, which helps you to see clearer and make future decisions.
Any found bugs or flaws, please feel free to PM me, I can't get notifications from comments here below, so I'll not able to reply you the soonest possible, still not sure how to turn on notification for comments, anyone who knows can PM and teach me, lol... Thanks in advance!
Well, this is free version, hope it helps! Feedbacks are all welcome :)
(To Moderators: I've fully use the "f_security()" guideline, but instead of creating a separate function, I apply directly on all security() function. Please don't ban my script before fully check if I've truly fixed repaint. Thank you.)
BITSTAMP:BTCUSD COINBASE:BTCUSD COINBASE:ETHUSD BINANCE:BNBUSDT

Take America Back Version 1.0So basically, the when the price goes down a little, it buys, and when it goes up a little it buys. The only indicators are account balances, and the price, that’s it. Now I wish that Pine Script had a function or variable in which I could recall the balances of specific portions of the portfolio, but it doesn’t. So, I had to improvise. Now for this to work accurately, all of the money needs to be in the “base” side before the bot can begin. Now, the thing about this is that it does not re-invest the amount that is “saved” to all but guarantee the balance will go up. However, as this goes up it will not add up as quickly in order to allow more wiggle room so that the bot does not work itself into a corner. If you want to keep some of your base, enter how much you want to keep it in the initial “saved” setting, as long as you allow at least enough to be equal to the default quantity value. Also, I recommend you setting the pyramiding setting to the result of the base value divided by the default quantity value. The default quantity value is how much you invest, measured in the base currency.
This would have been sooooo much easier if pine script could allow me to recall specific balances, but maybe a future one will.
Finally, THIS is why I made this program, I wanted to create something that would prevent the little ones from being stepped on by the big players who don't always play fair.
Besides, cryptocurrencies were made in response to the 2008 financial meltdown that caused a global recession. This decentralized currency is not just the money of the banks, the corporations, or the governments, but the money of the people. Use this tool to level the massive wealth inequality in my country and take America Back.
I will post more links and updates later once my reputation score goes up. I will discuss more about what influenced me to make this program and as some advise and possible future improvements as well.

Combo Backtest 123 Reversal & Reverse Engineering RSI This is combo strategies for get a cumulative signal.
First strategy
This System was created from the Book "How I Tripled My Money In The
Futures Market" by Ulf Jensen, Page 183. This is reverse type of strategies.
The strategy buys at market, if close price is higher than the previous close
during 2 days and the meaning of 9-days Stochastic Slow Oscillator is lower than 50.
The strategy sells at market, if close price is lower than the previous close price
during 2 days and the meaning of 9-days Stochastic Fast Oscillator is higher than 50.
Second strategy
Reverse Engineering RSI, by Giorgos Siligardos
The related article is copyrighted material from
Stocks & Commodities.
WARNING:
- For purpose educate only
- This script to change bars colors.
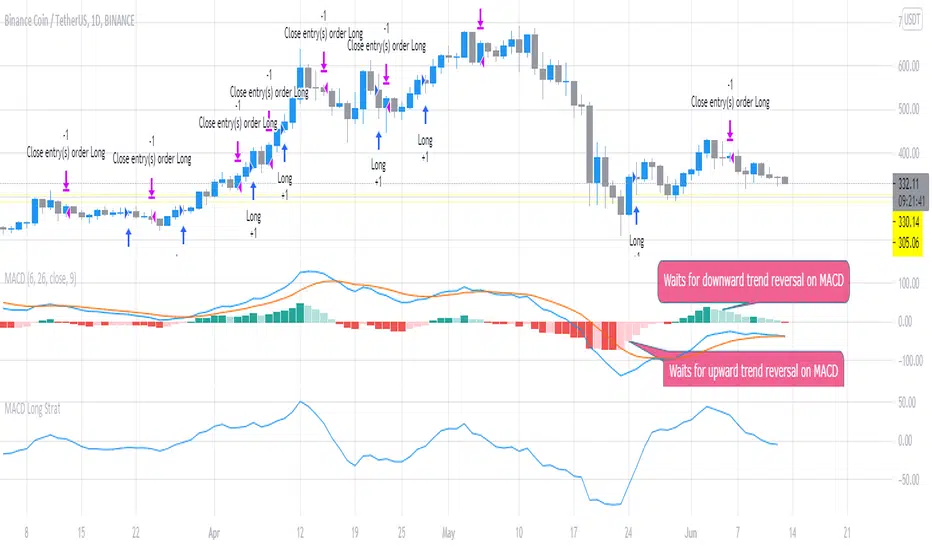
MACD Long StratFirst script I've written, but the concept is pretty simple. This uses the MACD with settings fast_SMA = 6 and slow SMA=16 and uses the distance between the 2 (histogram) to look for potential trend reversals to flag potential entries for Long trades. It waits for the confirmation looking backward 2 x timeframes (to reduce false calls slightly). You can adjust it to open / close quicker (1 timeframe instread of 2) but backtesting shows 2 timeframe delay is best to avoid false signals.
The script suggests Long entry points based on this criteria and uses the converse (reducing histogram / SMA difference delayed by 2 timeframes) to suggest exit or trade close points for downward reversal. It was originally written looking at 1m scalps but backtesting shows this is even more effective on higher timeframes (1D).
StocasticRSI EMAs ATR StrategyA scalping based strategy thats works well with EUR/USD 30 minute time frame.
This strategy uses stochasticRSI for trade entry. Uses two exponential moving averages for trend detection. The strategy uses Average True Range for stop loss and for two profit targets.
We only trade with the trend if the 50 period exponential moving averages is above the 200 period exponential moving averages. StocasticRSI must cross below 30 level by default for a long entry if the rend is up. Likewise with a short entry the stochasticRSI must crossover above 70 level and if the trend is down.
This script does not trail your stop loss as I have noticed it does not give me good results. Stop loss is a fix stoploss based on Average True Range and so are the profit targets.
This script has risk management, it risk a certain percent of the inputed capital amount in the setting. See settings for more details.
Green line is 50 period exponential moving averages and red line is the the 200 period exponential moving average. Blue line is stoploss for short trade and black line stop loss for buy trade.
Since this is a scalping strategy be caution with the commission and slippage. I have inputed 1 for commission and 1 for sllipage.
Many Thanks,
Honest Trader

EmperorBTC's VWAP StrategyEmperorBTC's VWAP Indicator & Strategy
v2.1
coded by Bogdan Vaida
This indicator was created after EmperorBTC's conditions.
Good timeframes for it: 30', 15', 5'
To convert from strategy to study switch the commented lines in the beginning
and at the end of the script and vice versa.
What this indicator does is to check if:
o Pivot Point was crossed
o Stoch-RSI and VWAP were crossed in current or previous candle
o Candle (or previous candle) close is in the trend direction
If all these are true then it will go long or short based on direction.

Maximized Scalping On Trend (by Coinrule)" The trend is your friend. " This is one of the most famous and valuable teachings that experienced traders can give to newbies. There is a reason for that.
No matter your views about where the price moves, what matters is where the price heads to . The market is always right, and ultimately it decides who gets the profit and who has to take a loss.
The purpose of this strategy is to spot when it's the most suitable time to buy an asset profiting from a potential short-term price increase. The strategy tends to open trades frequently, closing them on average in one and a half days.
ENTRY
The buy order is placed on assets that present strong momentum when it's more likely that it is about to increase further in the short term.
To capture momentum on the asset, the rule strategy requires:
the MA50 greater than the MA100
the RSI greater than 50
The rule, then, places the order when
The price crosses above the MA9.
EXIT
This strategy comes with a stop loss and a take profit which adapt dynamically to market conditions.
The trade is closed in profit when the RSI is greater than 70 , as the trend could experience a pull-back.
Alternatively, the trade is closed when the RSI is lower than 30 , being this a sign of weakening of the trend.
Pro tip : The 1-hour time frame has proven to return the best results on average. The strategy can also work well in the 15-min time frame if you want to increase the trades' frequency.
The strategy assumes each order to trade 30% of the available capital and opens a trade at a time. A trading fee of 0.1% is taken into account.

Combo Backtest 123 Reversal & Relative Volatility Index This is combo strategies for get a cumulative signal.
First strategy
This System was created from the Book "How I Tripled My Money In The
Futures Market" by Ulf Jensen, Page 183. This is reverse type of strategies.
The strategy buys at market, if close price is higher than the previous close
during 2 days and the meaning of 9-days Stochastic Slow Oscillator is lower than 50.
The strategy sells at market, if close price is lower than the previous close price
during 2 days and the meaning of 9-days Stochastic Fast Oscillator is higher than 50.
Second strategy
The RVI is a modified form of the relative strength index (RSI).
The original RSI calculation separates one-day net changes into
positive closes and negative closes, then smoothes the data and
normalizes the ratio on a scale of zero to 100 as the basis for the
formula. The RVI uses the same basic formula but substitutes the
10-day standard deviation of the closing prices for either the up
close or the down close. The goal is to create an indicator that
measures the general direction of volatility. The volatility is
being measured by the 10-days standard deviation of the closing prices.
WARNING:
- For purpose educate only
- This script to change bars colors.

Сalculation a position size based on riskThis is an example how to calculate position size based on risk and stop loss for educational purpose .

Combo Backtest 123 Reversal & Relative Momentum Index This is combo strategies for get a cumulative signal.
First strategy
This System was created from the Book "How I Tripled My Money In The
Futures Market" by Ulf Jensen, Page 183. This is reverse type of strategies.
The strategy buys at market, if close price is higher than the previous close
during 2 days and the meaning of 9-days Stochastic Slow Oscillator is lower than 50.
The strategy sells at market, if close price is lower than the previous close price
during 2 days and the meaning of 9-days Stochastic Fast Oscillator is higher than 50.
Second strategy
The Relative Momentum Index (RMI) was developed by Roger Altman. Impressed
with the Relative Strength Index's sensitivity to the number of look-back
periods, yet frustrated with it's inconsistent oscillation between defined
overbought and oversold levels, Mr. Altman added a momentum component to the RSI.
As mentioned, the RMI is a variation of the RSI indicator. Instead of counting
up and down days from close to close as the RSI does, the RMI counts up and down
days from the close relative to the close x-days ago where x is not necessarily
1 as required by the RSI). So as the name of the indicator reflects, "momentum" is
substituted for "strength".
WARNING:
- For purpose educate only
- This script to change bars colors.

EMA RSI ATR Hidden Div Strat - 1 MinHey there!
Hereby I present you the EMA RSI Lowest Low Hidden Divergence strategy, which I discovered on a youtube channel.
He has tested the strategy hundreds of times manually, herewith I try to automate the whole thing.
Since I use the strategy with a bot, it can only enter long positions for now. But in the future I will add the possibility to trade short positions.
The strategy was tested with BTC/ USDT in 1m chart (8 days). The values must be adjusted depending on the timeframe and coin.
-----------------------------------------------------------------------------------
How does the strategy work?
First of all, we need a bullish hidden divergence.
Once this is detected, the following parameters are checked:
The 50 EMA must cross the 250 EMA .
Then, the candle must close above the 50 EMA .
The K line of the RSI STOCH indicator need to crosses the D line.
If the next candle closes above the 50 EMA , a long position is opened.
The stop loss is determined with the "lowest low/highest high lookback".
The profit factor is multiplied by the value of the lowest low/highest high lookback.
The results of the strategy are without commissions and levers.
If you have any questions or feedback, please let me know in the comments.
In the future I will add other types of stop loss / take profits. (ATR; %; eg.)
I wish you good luck with the strategy!

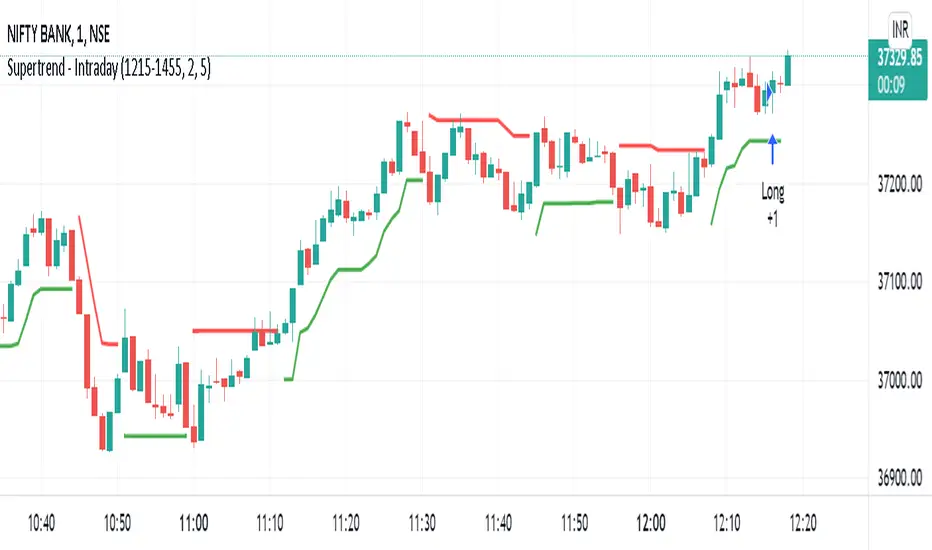
Supertrend - IntradaySupertrend Intraday Strategy
Basic supertrend strategy purpose built for intraday trading. Users can define intraday session during which the strategy will run.
Position is reversed when signal changes by using double quantity. Once the intraday session is over & if the position is open; it is squared off.
Parameters:
Intraday Session - Defines the duration for which the strategy should execute.
Multiplier
ATR Period