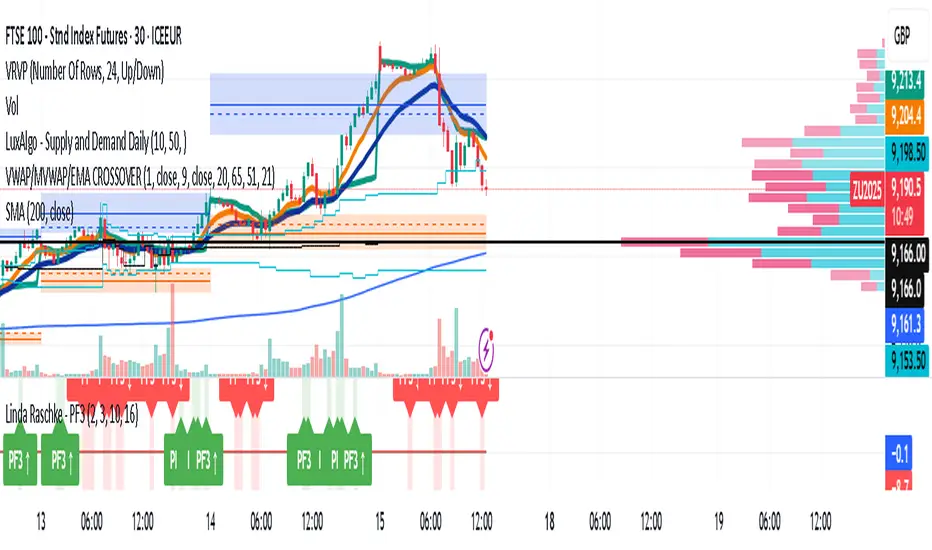
Linda Raschke - PF3This is PF3 indicator where there are confluence agreement of 3 oscillators. Means the market is giving its most!
Pengayun
BB next+2This indicator extends the standard Bollinger Bands by allowing you to project future Bollinger Bands based on assumed closing prices for the next trading day (+1) and the day after (+2).
Key Features:
Plots standard Bollinger Bands (supports SMA, EMA, etc.)
Allows manual input of assumed closing prices for the next trading day (+1) and the day after (+2)
Displays projected Bollinger Bands (basis, upper, and lower) based on the input values
Option to restrict display to the latest bar or confirmed bars only
New RSI📌 New RSI
The New RSI is a modern, enhanced version of the classic RSI created in 1978 — redesigned for today’s fast-moving markets, where algorithmic trading and AI dominate price action.
This indicator combines:
Adaptive RSI: Adjusts its calculation length in real time based on market volatility, making it more responsive during high volatility and smoother during calm periods.
Dynamic Bands: Upper and lower bands calculated from historical RSI volatility, helping you spot overbought/oversold conditions with greater accuracy.
Trend & Regime Filters: EMA and ADX-based detection to confirm signals only in favorable market conditions.
Volume Confirmation: Signals appear only when high trading volume supports the move — green volume for bullish setups and red volume for bearish setups — filtering out weak and unreliable trades.
💡 How it works:
A LONG signal appears when RSI crosses above the lower band and the volume is high with a bullish candle.
A SHORT signal appears when RSI crosses below the upper band and the volume is high with a bearish candle.
Trend and higher timeframe filters (optional) can help improve precision and adapt to different trading styles.
✅ Best Use Cases:
Identify high-probability reversals or pullbacks with strong momentum confirmation.
Avoid false signals by trading only when volume validates the move.
Combine with your own support/resistance or price action strategy for even higher accuracy.
⚙️ Fully Customizable:
Adjustable RSI settings (length, volatility adaptation, smoothing)
Dynamic band sensitivity
Volume threshold multiplier
Higher timeframe RSI filter
Color-coded background for market regime visualization
This is not just another RSI — it’s a complete, next-gen momentum tool designed for traders who want accuracy, adaptability, and confirmation in every signal.
BTC/Dominance RSI by Sajad BagheriTitle: "BTC/Dominance RSI by Sajad Bagheri"
Description: "Combines BTC Price RSI (Red) and BTC Dominance RSI (Green) to detect trend conflicts and overbought/oversold conditions."
Category: Oscillators
Tags: #BTC, #Dominance, #RSI, #Bitcoin
Access: Public/Private

BTC/Dominance RSI by Sajad BagheriTitle: "BTC/Dominance RSI by Sajad Bagheri"
Description: "Combines BTC Price RSI (Red) and BTC Dominance RSI (Green) to detect trend conflicts and overbought/oversold conditions."
Category: Oscillators
Tags: #BTC, #Dominance, #RSI, #Bitcoin
Access: Public/Private
Cnagda Trading ToolCnagda Trading Tools - complete set of intraday trading
1. Trendline breakout based On ATR.
2. Live RSI, volume/candle average 20 Periods, trend direction last 34 periods, and some useful dashboard features.
3. Ma Scalp Line provide trend support and resistance + Where Line More Flat Previous Time You Also Use That Range As Support And Resistance
4. RSI based POC ( Point Of Control) indicate high Volume Area like fixed Range Volume profile
5. London session breakout with buy/sell Signal and NewYork session opening half hour range breakout with Buy/sell signal
Ma Scalp Buy And Sell Signal For Short term Scalping ( 5 Min Timeframe) Based on Ema And Wma Crossover
I hope these tools will improve your trading, but you should trade only after proper research, this indicator is not responsible for any loss.

Wolf Exit Oscillator Enhanced
# Wolf Exit Oscillator Enhanced
## What it is (quick take)
**Wolf Exit Oscillator Enhanced** is a clean, rules-first **exit timing tool** built on the **True Strength Index (TSI)** with two optional safeguards:
1. **Signal-line crossover** (to avoid bailing on shallow dips), and
2. **EMA confirmation** (price-based “is the trend actually weakening/strengthening?” check).
Use it to standardize when you **take profits, cut losers, or scale out**—especially after momentum runs hot or cold.
> Works best **paired** with:
>
> * **ABS NR — Fail-Safe Confirm (v4.2.2)** for entries
> * **ABS Companion Oscillator — Trend / Exhaustion / New Trend** for trend/exhaustion context
---
## How to use it (operational workflow)
1. **Set your bands**
* `exitHigh` and `exitLow` mark “overcooked” zones on the TSI scale (default: +60 / –60).
* Above `exitHigh` = momentum stretched **up** (good place to **exit shorts** or **take long profits**).
* Below `exitLow` = momentum stretched **down** (good place to **exit longs** or **take short profits**).
2. **Choose strictness**
* **Base mode**: the moment TSI crosses out of a band, you get an exit signal.
* **Add Signal-Line Cross** (`enableSignalX = true`): require TSI to cross its signal in the same direction → **fewer, cleaner exits**.
* **Add EMA Filter** (`enableEMAFilter = true`): also require **price** to confirm (e.g., long exit only if price < EMA). This avoids bailing during healthy trends.
3. **Execute with structure**
* **Full exit** when a signal fires, or
* **Scale out** (e.g., 50% on first signal, remainder on trail/secondary signal), or
* **Move stop** to lock gains once an exit signal prints.
4. **Alerts**
* Set to **“Once per bar close”** to avoid intrabar flip-flop.
* Use the two provided alert names for automation (see “Alerts” below).
---
## Signals & visuals
* **TSI line** (solid) and **Signal line** (dashed) with optional **histogram** (TSI − Signal).
* **Horizontal bands** at `exitHigh` and `exitLow`.
* **Labels**:
* **Exit Long** appears when long-side momentum breaks down (below `exitLow`, plus any enabled filters).
* **Exit Short** appears when short-side momentum breaks down (above `exitHigh`, plus any enabled filters).
**Alerts (stable names):**
* **WolfExit — Exit Long**
* **WolfExit — Exit Short**
---
## Non-repainting behavior (what to expect)
* The oscillator is computed with **EMAs on current timeframe**—no higher-timeframe lookahead, no repaint.
* **Intrabar**: TSI/Signal can fluctuate; use **bar-close evaluation** (and alert setting “Once per bar close”) to lock signals.
* If you enable the EMA filter, that check is also evaluated at bar close.
---
## Every input explained (and how changing it alters behavior)
### Momentum engine (TSI)
* **TSI Long EMA Length (`tsiLongLen`, default 25)**
Higher = smoother, slower momentum; fewer signals. Lower = twitchier, more signals.
* **TSI Short EMA Length (`tsiShortLen`, default 13)**
Fine-tunes responsiveness on top of the long length. Lower short → snappier TSI.
* **TSI Signal Line Length (`tsisigLen`, default 7)**
Higher = slower signal line (harder to cross) → fewer signals. Lower = easier crosses → more signals.
### Thresholds (the bands)
* **Exit Threshold High (`exitHigh`, default +60)**
Raise to demand **stronger** overbought before signaling short exits / long profit-takes. Lower to trigger sooner.
* **Exit Threshold Low (`exitLow`, default −60)**
Raise (toward 0) to trigger **earlier** on longs; lower (more negative) to wait for deeper downside stretch.
### Confirmation layers
* **Require Signal Line Crossover (`enableSignalX`, default true)**
On = TSI must cross its signal (same direction as exit) → **filters out shallow wiggles**. Off = faster, more frequent exits.
* **Enable EMA Confirmation Filter (`enableEMAFilter`, default true)**
On = require **price < EMA** for **Exit Long** and **price > EMA** for **Exit Short**.
* **EMA Exit Confirmation Length (`exitEMALen`, default 50)**
Higher = **trendier** filter (harder to flip) → fewer exits; Lower = more reactive → more exits.
### Visuals
* **Show Histogram (`showHist`)**
On = quick visual for TSI–Signal spread (helps spot weakening momentum before a cross).
* **Plot Exit Signals (`showSignals`)**
Toggle labels if you only want the lines/bands with alerts.
---
## Tuning recipes (quick, practical)
* **Strong trend days (avoid premature exits)**
* Keep **`enableSignalX = true`** and **`enableEMAFilter = true`**
* Increase **`exitEMALen`** (e.g., 80)
* Consider raising **`exitHigh`** to 65–70 (and lowering **`exitLow`** to −65/−70)
* **Choppy/range days (exit faster, take the cash)**
* **`enableEMAFilter = false`** (don’t wait for price filter)
* **`enableSignalX`** optional; try off for quicker responses
* Bring bands closer to **±50** to take profits earlier
* **Scalping / lower timeframes**
* Shorten **TSI lengths** a bit (e.g., 21/9/5)
* Consider **`exitHigh=55 / exitLow=-55`**
* Keep **histogram on** to visualize momentum flip risk
* **Swing trading / higher timeframes**
* Lengthen **TSI** (e.g., 35/21/9) and **`exitEMALen`** (e.g., 100)
* Wider bands (±65 to ±75) to catch bigger moves before exiting
---
## Playbooks (how to actually trade it)
* **Entry from ABS NR FS, exit with Wolf**
* Take entries from **ABS NR — Fail-Safe Confirm** (triangle).
* Use **Wolf Exit** to scale out: 50% on first exit label, trail remainder with price/EMA or your stop logic.
* **Pyramid & protect**
* Add on re-accelerations (TSI pulls back toward zero without breaching the opposite band).
* The first **Exit** signal → take partial, raise stop to last higher low / lower high.
* **Mean-reversion fade management**
* When fading with ABS NR (KC band pokes + stretched |Z|), target the first opposite **Exit** signal as your “don’t overstay” cue.
---
## Suggested starting points
* **Day trading (5–15m):**
* TSI: **25 / 13 / 7** (default)
* Bands: **+60 / −60**
* Confirmations: **SignalX = on**, **EMA Filter = on**, **EMA Len = 50**
* Alerts: **Once per bar close**
* **Scalping (1–3m):**
* TSI: **21 / 9 / 5**
* Bands: **±55**
* Confirmations: **SignalX = on**, **EMA Filter = off** (optional for speed)
* **Swing (1h–D):**
* TSI: **35 / 21 / 9**
* Bands: **+65 / −65** (or ±70)
* Confirmations: **SignalX = on**, **EMA Filter = on**, **EMA Len = 100**
---
## Best-practice pairings
* **Entries:** **ABS NR — Fail-Safe Confirm (v4.2.2)**
* Take ABS triangles; let Wolf standardize exits so you’re not guessing.
* **Context:** **ABS Companion Oscillator**
* Prefer holding longer when the companion stays above (for longs) or below (for shorts) its neutral band and **no EXH tag** prints.
* If companion flags **EXH** against your position, tighten stops; Wolf’s next exit signal becomes high priority.
---
## Notes & disclaimers
* This is an **exit signal tool**, not a strategy or broker.
* Signals are strongest when aligned with your **entry logic** and a **risk framework** (position sizing, stops, partials).
* All evaluations are **current timeframe**; no higher-timeframe lookahead is used.
* Markets change—tune the bands and confirmations per symbol/timeframe.
---
**Tip:** Keep your alerts simple—one for **Exit Long**, one for **Exit Short**, **Once per bar close**. Use partial exits on the first signal, and let your stop/trailing logic handle the rest.

Parabolic Stoch SAR VisualizerParabolic Stoch SAR Visualizer — Momentum-Driven Trend Precision Tool
Overview:
Parabolic Stoch SAR Visualizer is a thoughtfully engineered hybrid indicator that blends momentum oscillation and trend-following mechanics into one robust system. By applying a custom Parabolic SAR calculation directly on a double-smoothed stochastic oscillator (rather than on price), it generates cleaner signals with enhanced trend detection and fewer false positives than typical Parabolic RSI or standard SAR variants.
Unique Functionality:
Momentum smoothing : The base stochastic %K undergoes double smoothing via consecutive simple moving averages, significantly cutting down random noise and erratic swings common in raw stochastic readings. This stabilizes momentum tracking, isolating true price strength and weakness.
Custom Parabolic SAR on smoothed momentum : Traditional SAR algorithms operate on price data, acting as trailing stops. This indicator repurposes SAR to work on smoothed stochastic values, effectively converting it into a momentum-driven directional filter. This yields a more adaptive and responsive trend signal focused on genuine momentum shifts instead of price noise.
Bounded SAR range and adjustable acceleration : SAR values are mathematically restricted between 0 and 100, aligning with the stochastic scale to prevent distortions. Traders can customize acceleration parameters (start, increment, max) to fine-tune trend sensitivity relative to market volatility or specific strategies.
Signal clarity through filterin g: Minimum bar spacing and minimum SAR movement thresholds between plotted dots reduce chart clutter, highlighting only meaningful trend changes and filtering out insignificant fluctuations.
Enhanced visuals : The oscillator line smoothly transitions its color gradient between defined uptrend and downtrend hues, intuitively signaling momentum strength. Parabolic SAR dots are offset from the oscillator line with multi-layered glow effects, making trend flips easy to spot at a glance.
Trading Application:
Trend identification : Momentum-based SAR dots offer precise marking of trend shifts, helping traders avoid false breakouts and premature trades.
Entry and exit timing : Combining the double-smoothed stochastic oscillator and SAR dots creates a reliable framework to confirm momentum shifts and optimal trade entries or exits.
Customizable for volatility regimes : Adjustable acceleration and filtering parameters allow scalpers to increase signal sensitivity, while swing traders can dial back noise for smoother trend recognition.
Visual clarity for fast decisions : Gradient color coding and glowing SAR dots facilitate immediate momentum assessment without complex analysis, empowering quicker, more confident trade actions.
Advantages over Parabolic RSI and similar indicators:
Parabolic RSI’s direct application of SAR on RSI often results in noisy, choppy signals prone to whipsaws. This indicator’s double-smoothed stochastic foundation delivers a cleaner, steadier signal.
Applying SAR to smoothed momentum rather than price transforms it into a directional filter that better captures true market strength with reduced lag.
Adaptive plotting thresholds and enhanced visuals minimize clutter and ambiguity, improving trader focus and execution speed.

Relative Volatility Mass [SciQua]The ⚖️ Relative Volatility Mass (RVM) is a volatility-based tool inspired by the Relative Volatility Index (RVI) .
While the RVI measures the ratio of upward to downward volatility over a period, RVM takes a different approach:
It sums the standard deviation of price changes over a rolling window, separating upward volatility from downward volatility .
The result is a measure of the total “volatility mass” over a user-defined period, rather than an average or normalized ratio.
This makes RVM particularly useful for identifying sustained high-volatility conditions without being diluted by averaging.
────────────────────────────────────────────────────────────
╭────────────╮
How It Works
╰────────────╯
1. Standard Deviation Calculation
• Computes the standard deviation of the chosen `Source` over a `Standard Deviation Length` (`stdDevLen`).
2. Directional Separation
• Volatility on up bars (`chg > 0`) is treated as upward volatility .
• Volatility on down bars (`chg < 0`) is treated as downward volatility .
3. Rolling Sum
• Over a `Sum Length` (`sumLen`), the upward and downward volatilities are summed separately using `math.sum()`.
4. Relative Volatility Mass
• The two sums are added together to get the total volatility mass for the rolling window.
Formula:
RVM = Σ(σ up) + Σ(σ down)
where σ is the standard deviation over `stdDevLen`.
╭────────────╮
Key Features
╰────────────╯
Directional Volatility Tracking – Differentiates between volatility during price advances vs. declines.
Rolling Volatility Mass – Shows the total standard deviation accumulation over a given period.
Optional Smoothing – Multiple MA types, including SMA, EMA, SMMA (RMA), WMA, VWMA.
Bollinger Band Overlay – Available when SMA is selected, with adjustable standard deviation multiplier.
Configurable Source – Apply RVM to `close`, `open`, `hl2`, or any custom source.
╭─────╮
Usage
╰─────╯
Trend Confirmation: High RVM values can confirm strong trending conditions.
Breakout Detection: Spikes in RVM often precede or accompany price breakouts.
Volatility Cycle Analysis: Compare periods of contraction and expansion.
RVM is not bounded like the RVI, so absolute values depend on market volatility and chosen parameters.
Consider normalizing or using smoothing for easier visual comparison.
╭────────────────╮
Example Settings
╰────────────────╯
Short-term volatility detection: `stdDevLen = 5`, `sumLen = 10`
Medium-term trend volatility: `stdDevLen = 14`, `sumLen = 20`
Enable `SMA + Bollinger Bands` to visualize when volatility is unusually high or low relative to recent history.
╭───────────────────╮
Notes & Limitations
╰───────────────────╯
Not a directional signal by itself — use alongside price structure, volume, or other indicators.
Higher `sumLen` will smooth short-term fluctuations but reduce responsiveness.
Because it sums, not averages, values will scale with both volatility and chosen window size.
╭───────╮
Credits
╰───────╯
Based on the Relative Volatility Index concept by Donald Dorsey (1993).
TradingView
SciQua - Joshua Danford

SMT Oscillator: Smarter Money Divergence Detector [PhenLabs]📊Phenlabs - SMT Oscillator: Smarter Money Divergence Detector
Version: PineScript™v6
📌Description
The SMT Oscillator is a sophisticated tool designed to identify smart money divergence between two correlated assets. By analyzing the momentum and volume-weighted price action of a primary and secondary symbol, traders can spot subtle shifts in market dynamics that often precede significant price movements. This indicator is built to provide a clearer, more filtered view of inter-market relationships, solving the common problem of false signals and market noise. Its primary purpose is to equip traders with a quantifiable edge in detecting potential reversals or continuations that are not obvious on a standard price chart.
🚀Points of Innovation
Dual-Symbol Divergence Core: Directly compares momentum (RSI or MACD) between two user-selected symbols to pinpoint true SMT divergence.
Volume-Weighted Analysis: Integrates volume delta into the divergence calculation, giving more weight to moves backed by significant market participation.
Entropy Filter for Noise Reduction: Employs an entropy calculation to filter out low-quality signals during choppy or consolidating market conditions.
Predictive Forecast Line: Utilizes a linear regression model to project the oscillator’s future trajectory, offering a forward-looking glimpse of potential momentum shifts.
Customizable Signal Sensitivity: Allows fine-tuning of overbought and oversold levels to adapt to different market volatilities and trading styles.
Integrated Signal Alerts: Provides built-in alerts for bullish/bearish zero crosses and overbought/oversold conditions.
🔧Core Components
Momentum Engine: The user can select either RSI or MACD as the underlying engine for the divergence calculation, allowing for flexibility in analysis.
Normalization Function: Price data from both symbols is normalized using percentage change to ensure a true “apples-to-apples” comparison, regardless of their nominal price differences.
Divergence Calculator: The core algorithm that subtracts the secondary symbol’s momentum from the primary’s and normalizes the result using the combined standard deviation.
Smoothing Mechanism: An Exponential Moving Average (EMA) is applied to the raw oscillator output to reduce choppiness and provide a clearer signal line.
🔥Key Features
Multi-Asset Comparison: Go beyond single-asset analysis by comparing correlated pairs like ES/NQ or BTC/ETH to uncover hidden trading opportunities.
Heatmap Visualization: An optional heatmap mode provides an intuitive visual representation of divergence strength, making it easier to gauge market sentiment at a glance.
Configurable Lookback and Timeframe: Adjust the lookback period and analysis timeframe to suit your specific strategy, from short-term scalping to long-term trend analysis.
Signal Markers: Visual markers are plotted directly on the chart for bullish and bearish zero-line crossovers, providing clear entry and exit signals.
🎨Visualization
SMT Oscillator Line: The primary visual element, colored blue for bullish (positive) divergence and orange for bearish (negative) divergence.
Zero Line: A solid horizontal line at the zero level, indicating the equilibrium point between the two assets. Crossovers of this line signal a shift in relative strength.
Overbought/Oversold Zones: Dotted lines at the +80 and -80 levels (customizable) that highlight extreme divergence readings, often indicating potential exhaustion points.
Forecast Line: A predictive line that plots the anticipated path of the oscillator, giving traders an advanced warning of potential changes in momentum.
📖Usage Guidelines
Setting Categories
Primary Symbol
Default: (Chart Symbol)
Description: The main asset you are analyzing. Leave blank to use the symbol currently on your chart.
Secondary Symbol
Default: CME_MINI:ES1! (used with NASDAQ futures due to inherent heavy correlation
Description: The asset to compare against the primary symbol.
Lookback Period
Default: 14
Range: 8-100
Description: Controls the calculation window for momentum (RSI/MACD). Higher values result in a smoother, less sensitive oscillator.
Divergence Type
Default: RSI
Options: RSI, MACD
Description: Choose the momentum indicator to use for the divergence calculation.
Enable Volume Weighting
Default: true
Description: When enabled, gives more weight to divergence signals that are accompanied by significant volume.
✅Best Use Cases
Identifying high-probability reversal points by spotting divergence in overbought or oversold territory.
Confirming the strength of a trend by observing sustained positive or negative divergence.
Pairs trading by taking a long position on the outperforming asset and a short position on the underperforming one during a divergence.
Risk management by recognizing when a current trend is losing its underlying momentum.
⚠️Limitations
Requires Correlated Assets: The indicator’s effectiveness is highly dependent on the selection of two assets with a known correlation (e.g., ES and NQ).
Not a Standalone System: Divergence signals should be used in conjunction with other forms of analysis (price action, market structure) and not as a complete trading system.
Lagging by Nature: As it is based on moving averages and past price data, the oscillator is inherently lagging and may not capture all rapid price changes.
💡What Makes This Unique
Combined Momentum & Volume: Unlike standard oscillators, it fuses momentum with volume delta for a more robust “Smart Money” perspective.
Noise-Filtering Mechanism: The proprietary entropy filter is a unique feature designed to weed out insignificant market chatter and focus on high-conviction signals.
🔬How It Works
Data Normalization:
The script first normalizes the price data of the two selected symbols into percentage changes. This ensures that the comparison is fair, regardless of the difference in their price scales.
Momentum Calculation:
It then calculates the chosen momentum value (either RSI or MACD histogram) for each of the normalized price series.
Divergence Computation:
The core of the indicator lies in subtracting the momentum of the secondary symbol from the primary one. This raw divergence is then optionally weighted by volume and filtered for market noise (entropy) to produce the final oscillator value.
💡Note:
For best results, use this indicator on adequate timeframes to filter out market noise. Always confirm signals with price action analysis before entering a trade.

RSI Z-score | Lemniscuss🧠 Introducing RSI Z-Score (RSI-Z) by Lemniscuss
🛠️ Overview
RSI Z-Score (RSI-Z) is a momentum-based market condition detector that transforms the classic Relative Strength Index (RSI) into a standardized volatility framework.
By applying Z-Score normalization to the RSI, this tool allows traders to identify statistically significant deviations in momentum — cutting through noise and highlighting high-probability turning points.
RSI-Z is optimized for trend inflection detection and overextension spotting, providing both visual clarity and actionable trade signals with dynamic labeling and optional bar coloring.
🔍 How It Works
1️⃣ RSI Foundation
The system starts with a standard RSI calculation on a user-defined source and length (default: 45).
2️⃣ Z-Score Normalization
The RSI values are standardized by subtracting their mean and dividing by the standard deviation over the same lookback.
This converts RSI into a statistical measure — revealing how many standard deviations current momentum is from its mean.
3️⃣ Threshold Logic
Two customizable thresholds define actionable zones:
• Long Threshold → Signals bullish momentum shifts when crossed upward
• Short Threshold → Signals bearish momentum shifts when crossed downward
4️⃣ Signal State Tracking
A state variable locks in a bias (Long / Short / Neutral) until an opposing trigger appears, ensuring clear and consistent market bias mapping.
✨ Key Features
🔹 Statistically Driven Momentum Detection — Moves beyond fixed RSI overbought/oversold levels by using standard deviations for adaptive accuracy.
🔹 Customizable Thresholds — Fine-tune long/short triggers for different volatility environments.
🔹 Clear Visual Feedback — Candle coloring and signal labels make trade setups instantly recognizable.
🔹 Overlay-Friendly — Works directly on your main chart or in a separate pane.
⚙️ Custom Settings
• Source: Price stream for RSI calculation (default: close)
• RSI Length: Lookback period for RSI & Z-Score (default: 45)
• Long Threshold: Z-score value for bullish signal (default: 1)
• Short Threshold: Z-score value for bearish signal (default: -1.9)
• Long/Cash Signal Labels: Toggle for "Long"/"Short" markers
• Bar Coloring: Toggle for trend-based candle coloring
📌 Trading Applications
✅ Trend Reversals → Spot statistically significant shifts in momentum before traditional RSI signals trigger
✅ Overextension Monitoring → Identify when momentum has deviated too far from the mean
✅ Mean Reversion Setups → Use extreme Z-score values as potential reversion points
✅ Bias Confirmation → Combine with trend tools for higher conviction entries/exits
📌 Conclusion
RSI-Z by Lemniscuss offers a clean, statistics-backed upgrade to the classic RSI.
By framing momentum in standard deviation terms, it empowers traders to separate normal fluctuations from truly significant market moves — making it a valuable tool for both trend traders and mean reversion specialists.
🔹 Summary Highlights
1️⃣ Statistical upgrade to RSI for higher-quality signals
2️⃣ Threshold-based, customizable long/short triggers
3️⃣ Visual candle coloring & signal labels for clarity
4️⃣ Adaptable to trend, swing, or intraday strategies
📌 Disclaimer: Past performance is not indicative of future results. No indicator guarantees profitability — always test and manage risk appropriately.

Minimalist RSI - Nasdaq (14) with Volume Filter and AlertsDescription:
This indicator shows the standard RSI (period 14) adapted for Nasdaq, with a clean and minimalist design. It adds visual levels for overbought (75) and oversold (25), plus an optional centerline 50 to better interpret momentum.
It incorporates a high volume visual filter to confirm signals and avoid false entries in low-interest conditions. Buy and sell signals are based on RSI crosses in extreme zones, optionally filtered by volume to improve reliability.
You can enable automatic alerts to receive notifications when important signals occur.
How to use:
Watch the RSI and its position relative to overbought/oversold zones and the 50 line.
Wait for high volume confirmation for greater reliability (you can disable this filter if preferred).
Use buy and sell signals alongside your price action and overall context analysis to make decisions.
Set alerts to not miss opportunities.
Important Notice:
This indicator is a support tool, not a complete strategy. Trading involves risks and no guarantees. Always use risk management and test the indicator on a demo before using it live.
Personal note:
This is my first script and I would love to receive constructive feedback to improve and offer better tools to the community. Thanks for trying it!
Motivational phrase:
“No risk, no reward.”
RSI Momentum Divergence Zones [ChartPrime]⯁ OVERVIEW
RSI Momentum Divergence Zones is a hybrid oscillator and chart overlay tool that detects RSI-based momentum divergences and projects them as key zones on the chart. By combining RSI divergence logic with horizontal level plotting, this indicator reveals high-probability support and resistance areas where price has historically reacted to hidden or classic divergences.
⯁ KEY FEATURES
Momentum-Based RSI Source:
Instead of the classic RSI input, this tool uses the momentum of price as the RSI source:
rsiSrc = ta.mom(close, 10)
This emphasizes acceleration and deceleration of price moves, sharpening divergence signals and making them more responsive to early shifts in momentum.
Automatic Divergence Detection (Optional):
When enabled, the indicator continuously scans for:
— Bullish Divergence : Price makes a Lower Low while RSI forms a Higher Low
— Bearish Divergence : Price makes a Higher High while RSI forms a Lower High
It ensures divergence is valid by checking the spacing between pivots (min 5, max 50 bars).
Divergence Labels & Markers (RSI Pane + Chart):
When a valid divergence is detected:
— On RSI pane:
Labels appear at HL/LH points (“Bull” / “Bear”)
Colored lines show pivot structures
— On price chart:
Labels (“▲ Bull” / “Bear ▼”) mark price pivot that triggered the divergence
Lines highlight the exact price level at the divergence origin
Divergence Zones / Levels (Toggleable):
The indicator projects horizontal zones across the chart based on confirmed divergence points.
These levels dynamically extend as long as price respects them, and auto-expire once broken.
They act as S/R levels created by market imbalance caused by divergence reactions.
Dynamic Zone Extension Logic:
Once plotted, divergence levels will extend to the right:
— If price respects the level, the zone keeps growing
— If broken in the opposite direction, the level stops extending and turns dashed (visually showing break)
Zone Layering and Limit Control:
You can limit the number of simultaneous zones shown on the chart (e.g., 10 most recent).
Old zones automatically expire and are removed to keep the chart clean and focused.
Color Customization and Intensity:
Different colors for bullish and bearish zones let you easily distinguish trend direction.
Background fill, line width, and transparency are all adjustable.
Clean Zone Management with Arrays:
Behind the scenes, the script uses custom divLevel type arrays to manage plotted levels, ensuring they stay up-to-date, extend correctly, and delete once invalidated.
⯁ USAGE
Use bullish divergence zones as potential demand areas and bearish ones as supply zones.
Combine RSI pane labels with price-level zones to confirm strength of reversal.
Watch for price approaching a divergence level to anticipate reactions or breakouts.
Use divergence levels as trade triggers, stop-loss guides, or take-profit markers.
Limit signal count using the “Qty Divergence Zones” setting to reduce chart clutter.
Enable divergence detection only when you want to focus on key structural zones — ideal for swing or positional setups.
⯁ CONCLUSION
RSI Momentum Divergence Zones blends oscillator divergence logic with price action structure to uncover hidden strength or weakness in the market. With flexible zone plotting and clean visual signals, this tool empowers traders to identify where momentum turns into structure — turning hidden signals into tradable edges.

EMA Deviation with Min/Max Levelshis indicator visualizes the percentage deviation of the closing price from its Exponential Moving Average (EMA), helping traders identify overbought and oversold conditions. It dynamically tracks the minimum and maximum deviation levels over a user-defined lookback period, highlighting extreme zones with color-coded signals:
• 🔵 Normal deviation range
• 🔴 Near historical maximum — potential sell zone
• 🟢 Near historical minimum — potential buy zone
Use it to spot price extremes relative to trend and anticipate possible reversals or mean reversion setups.

✨Smart Option MACD: Bullish, Bearish, Neutral Logic by AKM ✨The **Smart Option MACD: Bullish, Bearish, Neutral Logic by AKM** is an advanced indicator designed for TradingView, tailored for option traders on indices like NIFTY. It automates options trend scanning by applying MACD analysis to both Call (CE) and Put (PE) options near the ATM (At-The-Money) strike, providing actionable market states—Bullish, Bearish, or Neutral—using distinct logic for both strikes and overall market context.
***
### Core Features
- **Option Selection Logic:** The script dynamically calculates ATM, CE, and PE strike prices based on the underlying index spot price and customizable user inputs for expiry, strike distance, and OTM/ITM shift.
- **MACD on Option Prices:** For both CE and PE symbols, the indicator computes the MACD (Moving Average Convergence Divergence) and Signal lines. It uses standard MACD settings: 12-period EMA (fast), 26-period EMA (slow), and 9-period Signal.
- **Strike Status Classification:**
- AZL 🔼: Indicates MACD > 0 for that option, signifying positive momentum.
- BZL 🔽: Indicates MACD 0 & crossover up), PE is bearish (MACD<0 & crossover down).
- **Bearish:** PE is bullish & crossover up, CE is bearish & crossover down.
- **Neutral:** All other scenarios—including mixed or undefined signals.
***
### Table Output
A real-time table is displayed on the chart (top-right) with key option and market details:
- Spot price
- ATM Strike
- CE/PE strike status (momentum + crossover logic)
- Option prices
- Overall market state, color-coded for clarity
***
### How to Use This Indicator
- **Entry Signal:** Use the Bullish/Bearish status for directional trades or option strategies. Bullish calls for buying or selling upward momentum options; Bearish favors downside trades. Neutral advises caution or range-bound trades.
- **Customizability:** Expiry, strike width, OTM/ITM offset, and chart resolution are user-controlled, allowing adaptation to different market contexts.
- **Best Practice:** Use alongside price action, support/resistance zones and other indicators to confirm options momentum, as MACD is powerful yet not infallible.
***
### Who Is It For?
- **Option traders** who want to automate trend/momentum detection for CE/PE strikes instead of manual chart switching.
- **Index traders** (NIFTY, BANKNIFTY...) seeking systematic edge in intraday/positional strategies tied to option momentum.
- **Technical analysts** interested in visual, rule-based signals combining options data and classic MACD logic.
***
The Smart Option MACD indicator streamlines multi-strike, multi-option momentum analysis and presents clear actionable logic directly on your chart for enhanced decision-making. Use it as a core part of your TradingView toolkit for options-focused market views.

Multi-Timeframe RSIRSI Divergence (Time-Based Engine)
This script is a powerful and highly customizable tool designed to automatically detect and display RSI divergences from up to three independent, user-defined timeframes directly on your chart. It eliminates the need to manually switch between timeframes to find these critical trading signals, allowing you to see long-term and short-term divergences all in one place.
The engine is built to be flexible, supporting both regular (reversal) divergences and hidden (trend-continuation) divergences. It's designed for traders who rely on divergence analysis as a core part of their strategy.
Key Features
Multi-Timeframe (MTF) Analysis: Configure and display divergences from up to three different timeframes simultaneously (e.g., show 4-Hour, Daily, and Weekly divergences on your 1-Hour chart). Each timeframe operates independently with its own settings.
Regular & Hidden Divergence: The script can detect both standard regular divergences that signal potential reversals and hidden divergences that suggest a trend may continue.
Configurable Pivot Strength: You have full control over the sensitivity of pivot detection. The 'Left Strength' and 'Right Strength' settings allow you to define what qualifies as a significant price pivot, filtering out market noise.
Bar Count Filter: Refine your signals by setting the minimum and maximum number of bars allowed between two pivots. This ensures you only see divergences that fit your specific strategic timeframe.
Dedicated Alerts: Each of the three timeframes has its own "Enable Alerts" toggle. When a new divergence line is drawn on the chart for a specific timeframe, a corresponding alert can be triggered, ensuring you never miss a potential setup.
Full Visual Customization: Tailor the look and feel of the indicator to your preference. Each timeframe has unique color settings for its bullish and bearish lines, allowing for easy visual identification. You can also toggle the visibility of various chart markers to keep your view clean.
How to Use
1. Add the indicator to your chart.
2. Open the Settings panel.
3. For each timeframe you wish to use (1, 2, or 3), check the "Enable Timeframe" box.
4. Select the desired Timeframe, RSI Length, and Pivot Strength for each active engine.
5. Adjust the Min/Max Bars filter to match your trading style.
6. If you want to receive notifications, check the "Enable Alerts" box for the desired timeframe(s). Then, create an alert using TradingView's alert manager, selecting the indicator and choosing the "Any alert() function call" option.

RSI (14) with Auto Zone Colors — Overbought/Oversold HighlighterThis indicator plots the Relative Strength Index (RSI 14) with dynamic color changes for instant visual clarity:
✅ Green line in overbought zone (≥70)
✅ Red line in oversold zone (≤30)
✅ White line in neutral range (30–70)
Includes reference lines at 70, 50, and 30 for quick decision-making. Perfect for spotting momentum extremes, divergences, and potential reversal points without squinting at numbers. Works on any timeframe.

Global Bond Yields Monitor [MarktQuant]Global Bond Yields Monitor
The Global Bond Yields Monitor is designed to help users track and compare government bond yields across major economies. It provides an at-a-glance view of short- and long-term interest rates for multiple countries, enabling users to observe shifts in global fixed-income markets.
Key Features:
Multi-Country Coverage: Includes major advanced and emerging economies such as the United States, China, Japan, Germany, United Kingdom, Canada, Australia, and more.
Multiple Maturities: Displays yields for the 2-year, 5-year, 10-year, and 30-year maturities (20-year for Russia).
Dynamic Yield Data: Plots real-time yields for the selected country directly from TradingView’s data sources.
Weekly Change Tracking: Calculates and displays the yield change from one week ago ( ) for each maturity.
Table Visualization: Option to display a compact data table showing current yields and weekly changes, color-coded for easier interpretation.
Visual Yield Curve Comparison: Plots yield lines for short- and long-term maturities, with shaded areas between curves for visual clarity.
Customizable Display: Choose table placement and whether to show or hide the weekly change table.
Use Cases
This script is intended for analysts, traders, and investors who want to monitor shifts in sovereign bond markets. Changes in yields can reflect adjustments in monetary policy expectations, inflation outlook, or broader macroeconomic trends.
❗Important Note❗
This indicator is for market monitoring and educational purposes only. It does not generate trading signals, and it should not be interpreted as financial advice. All data is sourced from TradingView’s available market feeds, and accuracy may depend on the source data.

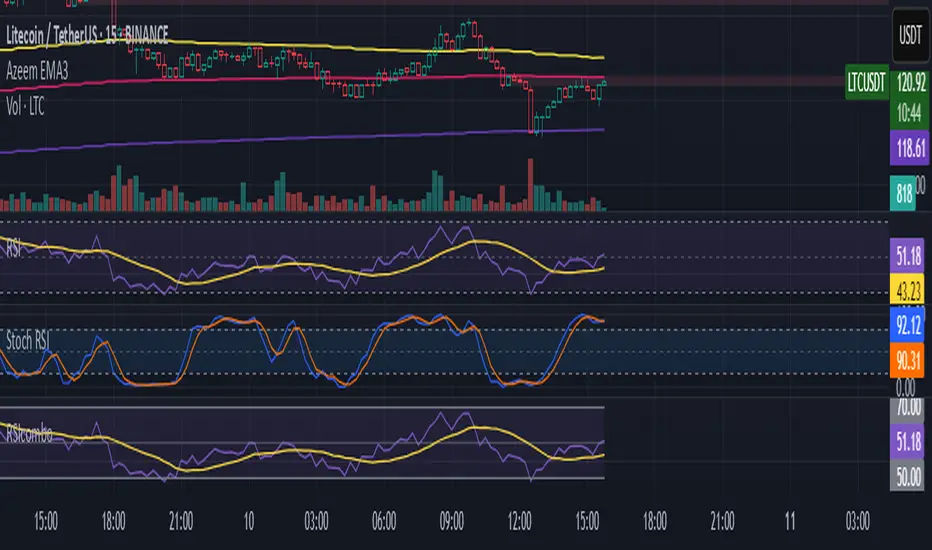
RSI/Stoch RSI ComboIt shows both rsi and stoch rsi as one indicator. You need to select which one using checkbox.
Smart Money Proxy IndexOverview
The Smart Money Proxy Index (SMPI) is an educational tool that attempts to identify potential institutional-style behavior patterns using publicly available market data. This comprehensive tool combines multiple institutional analysis techniques into a single, easy-to-read 0-100 oscillator.
Important Disclaimer
This is an educational proxy indicator that analyzes volume and price patterns. It cannot identify actual institutional trading activity and should not be interpreted as tracking real "smart money." Use for educational purposes and combine with other analysis methods.
Inspiration & Methodology
This indicator is inspired by MAPsignals' Big Money Index (BMI) methodology but uses publicly available price and volume data with original calculations. This is an independent educational interpretation designed to teach smart money concepts to retail traders.
What It Analyzes
SMPI tracks potential "smart money" activity by combining:
Block Trading Detection - Identifies unusual volume surges with significant price impact
Money Flow Analysis - Volume-weighted price pressure using Money Flow Index
Accumulation/Distribution Patterns - Modified On-Balance Volume signals
Institutional Control Proxy - End-of-day positioning and control analysis
Key Features
– Multi-Component Analysis - Combines 4 different institutional detection methods
– BMI-Style 0-100 Scale - Familiar oscillator range with clear extreme levels
– Professional Visualization - Dynamic colors, gradient fills, and clean data table
– Comprehensive Alerts - Buy/sell signals plus divergence detection
– Fully Customizable - Adjust all parameters, colors, and display options
– Non-Repainting Signals - All alerts use confirmed data for reliability
– Educational Focus - Designed to teach institutional flow concepts
How to Interpret
Above 80: Potential smart money distribution phase (bearish pressure)
Below 20: Potential smart money accumulation phase (bullish opportunity)
Signal Generation: Buy signals when crossing above 20, sell signals when crossing below 80
Divergences: Price vs SMPI divergences can signal potential trend changes
Volume Confirmation: Higher volume ratios strengthen signal reliability
Best Practices
Timeframes: Works best on higher timeframes for institutional behavior analysis
Confirmation: Combine with other technical analysis tools and market context
Volume: Pay attention to volume confirmation in the data table
Context: Consider overall market conditions and fundamental factors
Risk Management: Not recommended as standalone trading system
Customizable Parameters
Block Volume Threshold: Sensitivity for unusual volume detection (default: 2.5x average)
SMPI Smoothing Period: Index calculation smoothing (default: 25 bars)
Extreme Levels: Overbought/oversold thresholds (default: 80/20)
Money Flow Length: MFI calculation period (default: 14)
Visual Options: Colors, signals, and display preferences
Available Alerts
Buy Signal: SMPI crosses above oversold level (20)
Sell Signal: SMPI crosses below overbought level (80)
Extreme Levels: Alerts when reaching overbought/oversold zones
Divergence Detection: Bullish and bearish price vs SMPI divergences
Educational Purpose & Limitations
This indicator is designed as an educational proxy for understanding institutional flow concepts. It analyzes publicly available price and volume data to identify potential smart money behavior patterns.
Cannot access actual institutional transaction data
Signals may be slower than day-trading indicators (intentionally designed for institutional timeframes)
Should be used in conjunction with other analysis methods
Past performance does not guarantee future results
What Makes This Different
Unlike simple volume or momentum indicators, SMPI combines multiple institutional analysis techniques into one comprehensive tool. The multi-component approach provides a more robust view of potential smart money activity.

MACD-V (Volatility-Normalised Momentum) — Spiroglou, 2022Volatility-normalized MACD per Alex Spiroglou (2022):
MACD-V = (EMA12 − EMA26) / ATR26 × 100, so momentum is expressed in ATR units and stays comparable across assets/timeframes.
What you get
• Trend-colored line: green when price ≥ EMA200, red otherwise.
• Guides: ±50 / ±100 / 0; Extremes: ±140 (editable).
• Regime shading: OB ≥ +140 shaded red; OS ≤ −140 shaded green.
• Clean, on-curve markers: small circles on the MACD-V line at the four edge events — OB (enter ≥ +threshold), OBX (cross back down), OS (enter ≤ −threshold), OSX (cross back up).
• Text labels are off by default; optional toggle only for OB/OBX.
• Signal & histogram: EMA(9) of MACD-V and (MACD-V − Signal) columns.
• Alerts: OB/OS entries & exits included.
How to use
• Favor longs when MACD-V > 0 (ideally > +50); respect OB for possible exhaustion.
• Favor shorts when MACD-V < 0 (ideally < −50); respect OS for possible exhaustion.
• Because it’s ATR-normalized, thresholds transfer well across symbols and timeframes.

SMI Base-Trigger Bullish Re-acceleration (Higher High)Description
What it does
This indicator highlights a two-step bullish pattern using Stochastic Momentum Index (SMI) plus an ATR distance filter:
1. Base (orange) – Marks a momentum “reset.” A base prints when SMI %K crosses up through %D while %K is below the Base level (default -70). The base stores the base price and starts a waiting window.
2. Trigger (green) – Confirms momentum and price strength. A trigger prints only if, before the timeout window ends:
• SMI %K crosses up through %D again,
• %K is above the Trigger level (default -60),
• Close > Base Price, and
• Price has advanced at least Min ATR multiple (default 1.0× the 14-period ATR) above the base price.
A dashed green line connects the base to the trigger.
Why it’s useful
It seeks a bullish divergence / reacceleration: momentum recovers from deeply negative territory, then price reclaims and exceeds the base by a volatility-aware margin. This helps filter out weak “oversold bounces.”
Signals
• Base ▲ (orange): Potential setup begins.
• Trigger ▲ (green): Confirmation—momentum and price agree.
Inputs (key ones)
• %K Length / EMA Smoothing / %D Length: SMI construction.
• Base when %K < (default -70): depth required for a valid reset.
• Trigger when %K > (default -60): strength required on confirmation.
• Base timeout (days) (default 100): maximum look-ahead window.
• ATR Length (default 14) and Min ATR multiple (default 1.0): price must exceed the base by this ATR-scaled distance.
How traders use it (example rules)
• Entry: On the Trigger.
• Risk: A common approach is a stop somewhere between the base price and a multiple of ATR below trigger; or use your system’s volatility stop.
• Exits: Your choice—trend MA cross, fixed R multiple, or structure-based levels.
Notes & tips
• Works best on liquid symbols and mid-to-higher timeframes (reduce noise).
• Increase Min ATR multiple to demand stronger price confirmation; tighten or widen Base/Trigger levels to fit your market.
• This script plots signals only; convert to a strategy to backtest entries/exits.

Clean Multi-Indicator Alignment System
Overview
A sophisticated multi-indicator alignment system designed for 24/7 trading across all markets, with pure signal-based exits and no time restrictions. Perfect for futures, forex, and crypto markets that operate around the clock.
Key Features
🎯 Multi-Indicator Confluence System
EMA Cross Strategy: Fast EMA (5) and Slow EMA (10) for precise trend direction
VWAP Integration: Institution-level price positioning analysis
RSI Momentum: 7-period RSI for momentum confirmation and reversal detection
MACD Signals: Optimized 8/17/5 configuration for scalping responsiveness
Volume Confirmation: Customizable volume multiplier (default 1.6x) for signal validation
🚀 Advanced Entry Logic
Initial Full Alignment: Requires all 5 indicators + volume confirmation
Smart Continuation Entries: EMA9 pullback entries when trend momentum remains intact
Flexible Time Controls: Optional session filtering or 24/7 operation
🎪 Pure Signal-Based Exits
No Forced Closes: Positions exit only on technical signal reversals
Dual Exit Conditions: EMA9 breakdown + RSI flip OR MACD cross + EMA20 breakdown
Trend Following: Allows profitable trends to run their full course
Perfect for Swing Scalping: Ideal for multi-session position holding
📊 Visual Interface
Real-Time Status Dashboard: Live alignment monitoring for all indicators
Color-Coded Candles: Instant visual confirmation of entry/exit signals
Clean Chart Display: Toggle-able EMAs and VWAP with professional styling
Signal Differentiation: Clear labels for entries, X-crosses for exits
🔔 Alert System
Entry Notifications: Separate alerts for buy/sell signals
Exit Warnings: Technical breakdown alerts for position management
Mobile Ready: Push notifications to TradingView mobile app
Market Applications
Perfect For:
Gold Futures (GC): 24-hour precious metals trading
NASDAQ Futures (NQ): High-volatility index scalping
Forex Markets: Currency pairs with continuous operation
Crypto Trading: 24/7 cryptocurrency momentum plays
Energy Futures: Oil, gas, and commodity swing trades
Optimal Timeframes:
1-5 Minutes: Ultra-fast scalping during high volatility
5-15 Minutes: Balanced approach for most markets
15-30 Minutes: Swing scalping for trend following
🧠 Smart Position Management
Tracks implied position direction
Prevents conflicting signals
Allows trend continuation entries
State-aware exit logic
⚡ Scalping Optimized
Fast-reacting indicators with shorter periods
Volume-based confirmation reduces false signals
Clean entry/exit visualization
Minimal lag for time-sensitive trades
Configuration Options
All parameters fully customizable:
EMA Lengths: Adjustable from 1-30 periods
RSI Period: 1-14 range for different market conditions
MACD Settings: Fast (1-15), Slow (1-30), Signal (1-10)
Volume Confirmation: 0.5-5.0x multiplier range
Visual Preferences: Colors, displays, and table options
Risk Management Features
Clear visual exit signals prevent emotion-based decisions
Volume confirmation reduces false breakouts
Multi-indicator confluence improves signal quality
Optional time filtering for session-specific strategies
Best Use Cases
Futures Scalping: NQ, ES, GC during active sessions
Forex Swing Trading: Major pairs during overlap periods
Crypto Momentum: Bitcoin, Ethereum trend following
24/7 Automated Systems: Algorithmic trading implementation
Multi-Market Scanning: Portfolio-wide signal monitoring
