TEDong OBV MACD OSC ==> ProfitHi, Folg,
OBV MACD OSC gives a Buy signal when the OBV value crosses up its EMA and a Sell signal when it crosses down its EMA.
Cross over markers Directional bgcolor, where RED for bearish (S) and GREEN for bullish (B)
If you include volume analyses in your trading strategy, automating OBV MACD OSC will give buy signals whenever volume and price are rising altogether.
DONATE/TIP
BTC: 13nhMN2H4LoRi4VMcPcyR96jitxrH3uivB
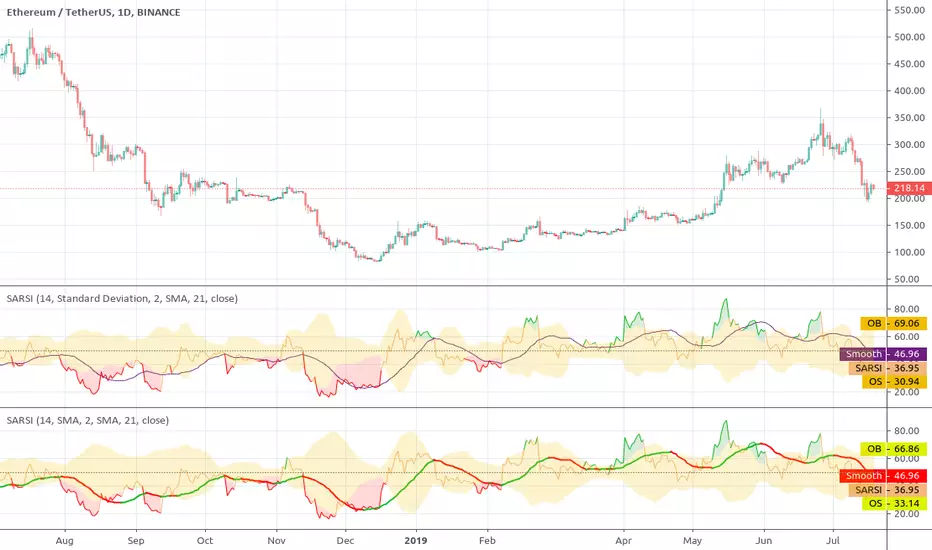
Overbought-oversold
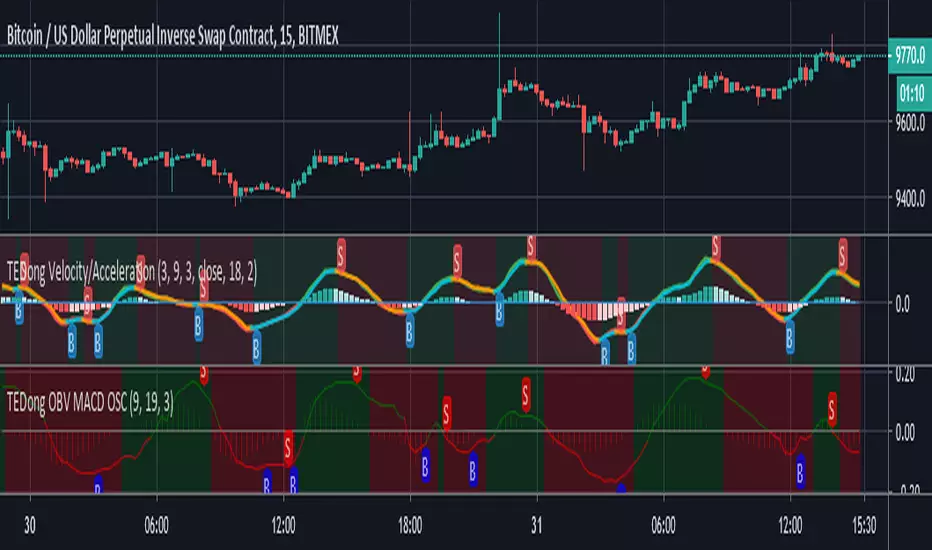
TEDong Velocity/Acceleration: Physics Newton LawHi Folg,
In physics, equations of motion are equations that describe the behavior of a physical system in terms of its motion as a function of time.
Kinematics motion is simpler as it concerns only variables derived from the positions of objects, and time. In circumstances of constant acceleration, these simpler equations of motion are usually referred to as the SUVAT equations, arising from the definitions of kinematic quantities: displacement (s), initial velocity (u), final velocity (v), acceleration (a), and time (t).
A differential equation of motion, usually identified as some physical law and applying definitions of physical quantities, is used to set up an equation for the problem. Solving the differential equation will lead to a general solution with arbitrary constants, the arbitrariness corresponding to a family of solutions. A particular solution can be obtained by setting the initial values, which fixes the values of the constants. To state this formally, in general an equation of motion M is a function of the position r of the object, its velocity (the first time derivative of r, v = dr/dt
), and its acceleration (the second derivative of r, a = d2r/dt2), and time t.
The following indikator is called TEDong Velocity/Acceleration, with alert LONG/BUY and SHORT/Sell.
DONATE/TIP
BTC: 13nhMN2H4LoRi4VMcPcyR96jitxrH3uivB


DBT MoMo v.4DBT MOMO
Introduction: The MoMo is a TradingView indicator designed to evaluate momentum and give the user signals according to momentum shifts, strength, extensions, traps, and divergence. It’s an all in one oscillator that will make reading price action near term and long term much easier.
Part One: Strength
The MoMo consist of two major parts. A 3-candle back formula and a 24-candle back formula. The 3-candle back is called the Price Line (the histogram on the MoMo). The 24-candle back is called the Trend Line (the line on the MoMo). Both lines are placed into a range from 20 to -20. It can go higher than 20 or lower than -20, but this is extremely rare and short lived.
A positive number indicates a bullish bias, a negative number indicates a bearish bias. When the Price or Trend line are ascending while below 0 this indicates that the bearish momentum is weakening. When the Price or Trend line are descending while above 0 this indicates that the bullish momentum is weakening.
In a strong trend the Trend Line will likely flatten out around 15 or -15. While the Trend Line is flat the Price Line will likely shift rapidly, this can lead to bull and bear traps, we will discuss this in the Trap section.
A rare, but powerful signal from the MoMo is when the Price and Trend Lines “pinch” and begin to move in the same direction. If this is happening the trader should be looking to follow the direction of these lines.
Part Two: Extensions
When both Price and Trend Lines are above 10 or below -10 this will begin to signal an extension.
Purple: Indicates the bears are extended to the downside and a pullback or trend reversal upward is likely.
Gold: Indicates the bulls are extended to the upside and a pullback or trend reversal downward is likely.
When only the Trend Line is above 10 the MoMo will shade the upper range red. This indicates the Trend is becoming bullish or entering an extension. If the Trend Line cannot maintain above 10 for long and breaks below 10 this indicates it’s an extension and trend will most likely continue downward.
When only the Trend Line is below -10 the MoMo will shade the upper range green. This indicates the Trend is becoming bearish or entering an extension. If the Trend Line cannot maintain below -10 for long and breaks above -10 this indicates it’s an extension and trend will most likely continue upward.
When the green or purple shading have turned off take the lowest point, this is considered a support level or a local bottom.
When the red or gold shading have turned off take the highest point, this is considered a resistance level or a local top.
The trader can preemptively trade the purple or gold warnings but be warned these warnings can go on for a long time if the trend is very strong. It is the same mentality of an overbought or oversold RSI, except the MoMo extensions have a much higher strike rate.
To avoid preemptively trading these extensions the trader should wait for confirmation on the Price Line and on price action. The Price Line (histogram) should be moving upward during a purple extension to begin showing a bottom. The Price Line (histogram) should be moving downward during the gold extension to begin showing a top.
Part Three: Traps
The relation between the Price Line and Trend Line can create trading signals for bull and bear traps. When the Trend Line is flattened out around 15 or -15, indicating a strong trend is in place, and the Price Line is rapidly moving towards the midline this may indicate a trap is forming.
When the Trend Line is flat around 15 and the Price Line begins moving towards 0, if the Price Line reaches 0 or close to 0 and the Trend Line is still flat, a trap has begone. Once the Price Line shifts from decreasing (red) to increasing (green) the trap is playing out. Therefore, the trader should look to exit short positions or enter long positions.
When the Trend Line is flat around -15 and the Price Line begins moving towards 0, if the Price Line reaches 0 or close to 0 and the Trend Line is still flat, a trap has begone. Once the Price Line shifts from increasing (green) to decreasing (red) the trap is playing out. Therefore, the trader should look to exit long positions or enter short positions.
Part Four: Divergences
The MoMo is exceptional at finding divergences with the Price Line and occasionally the Trend Line.
To find a divergence with the MoMo the trader must look for when the histogram is not following price action completely.
Bullish Divergence: Price makes a lower low, MoMo makes a higher low.
Bearish Divergence: Price makes a higher high, MoMo makes a lower high.
Hidden Bull Divergence: Price makes a higher low, MoMo makes a lower low.
Hidden Bear Divergence: Price makes a lower high, MoMo makes a higher high.
For Access or Questions: Private message us. Thank you.

TEDong Bonga RSI ADXHey!
RSI ADX best indikator!
The logic is pretty simple:
value > 20: Oversold, next price action will follow that bullish trend, BUY signal is generated
value > 70: Overbought, next price action will follow that bearish trend, SELL signal is generated
If you have sny doubt just comment!
Custom RSI [Mr_Orange]This is my custom RSI script, which is basically a normal RSI chart. Except it has build in alerts, based on the RSI strategy indicator, and I like the colors better.
* Buy signal is based on RSI crossunder from overbought to neutral zone
* Sell signal is based on RSI crossover from oversold to neutral zone
Both oversold and overbought can be adjusted. Future functionality will also include RSI rise and fall %
Thanks for checking it out! If you think it is worth something:
- BTC: 1NrG3Sy2VW8u4wWHucj1CQjKQ6hXYwbSyX
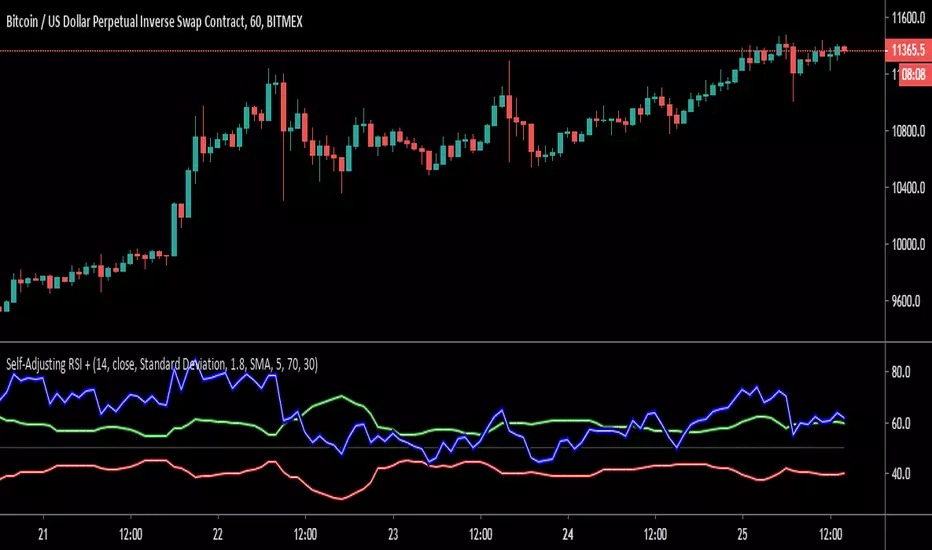
Self-Adjusting RSI +Here is an open source (no request needed!) version of the Self-Adjusting RSI by David Sepiashvili.
Published in Stocks & Commodities V. 24:2 (February, 2006): The Self-Adjusting RSI
David Sepiashvili's article, "The Self-Adjusting RSI," presents a technique to adjust the traditional RSI overbought and oversold thresholds so as to ensure that 70-80% of RSI values lie between the two thresholds. Sepiashvili presents two algorithms for adjusting the thresholds. One is based on standard deviation, the other on a simple moving average of the RSI.
This script allows you to choose between plotting the Self-Adjusting bands or the traditional bands. You can also plot a smoothed RSI (SMA or EMA) and change the theme color for dark or light charts.
If you find this code useful, please pass it forward by sharing open source!
Thank you to all of the open source heroes out there!
"If I have seen a little further it is by standing on the shoulders of Giants."
NIBIRU STOCHASTICThe Nibiru Stochastic oscillator is a tweaked version of one of the most popular trading tools - Stochastic Oscillator. It features:
K/D cross signals
Automatically adjusting overbought and oversold zones based on current trend situation
Color change based on trend
Price source selection
Use the link below or PM me to gain access to the indicator.

Dynamic Momentum IndexThis indicator was originally developed by Tushar S. Chande and Stanley Kroll. They described it in their book The New Technical Trader (1994).
The period for DMI calculation depends on the market volatility. DMI uses a longer period as volatility decreases and a shorter period as volatility increases, making it more responsive to changing prices than RSI which uses a fixed period. That's why the indicator is called "dynamic". You can specify the DMI period bounds (defaults are 5 and 30) in the indicator settings.
The calculation is based on the standard deviation of prices. The authors used a custom volatility index to adjust RSI period - the similar concept was used in the original VIDYA (yes, it was based on the standard deviation).
Source code on request

Self-Adjusting RSIThis indicator was originally developed by David Sepiashvili (Stocks & Commodities V. 24:2 (February, 2006): The Self-Adjusting RSI ).
The author presented a technique to adjust the traditional RSI overbought and oversold thresholds so as to ensure that 70-80% of RSI values lie between the two thresholds.
He used two algorithms for adjusting:
Standard Deviation-based
Simple Moving Average-based
Easy and straightforward. But this is not a true way.
Source code on request
ATR and RSI Buy / Sell Signal Beta 1.0This has been a long time coming for me.
I need to clean it up and add inputs for others to customize it that's why its protected.
This is configured for US securities.
Goal: Signal when to enter a trade on either side
Method: ATR and 2 RSI signals using:
3 Minute Chart Resolution
MUST have an active (can be hidden) BUILT-IN ATR ; length = 4 and set to RMA smoothing
MUST add the script; THEN go to the scripts settings and change the source to ATR. TV does not allow this to be set to default (that I know of)
I have default settings how I use them but you can modify:
ATR period (Length) =4
ATR multiplier = 0.9 (can edit by 0.1 increments.
The 1st Length/offset/resolution is defaulted to the 1 minute RSI.
The 2nd Length/offset/resolution is defaulted to the 3 minute RSI.
1)
OVERBOUGHT or OVERSOLD
*Please understand I use a length of 4 for this script, that is why the RSI OB/OS limits are so high/low.
Overbought conditions will light yellow if the 1m RSI > 90 and the 3min RSI > 85 and the time is between 09:42am and 16:00
Oversold conditions will light yellow if the 1m RSI < 10 and the 3min RSI < 10 and the time is between 09:42am and 16:00
The script ensures that if it is OB/OS under these conditions than it will not signal a buy or sell.
2)ATR
The script identifies reversals via the close breaking past the previous ATR on the preceding candle. ATR will not move UP on a short and will not move down on a long. It trails the last candle it was not broken.
The script plots labels up and down to identify the start of a reversal. Each start will have an accompanying line to display the continuation of the trend in one direction.
The script displays the value of the STOP as it trails price action. One could continue to mirror this value if you chose to. I use the fib tool for my targets and manage it as P/A demands.
3) RSI SIGNALLING
The script identifies a trend by analyzing BOTH RSI (1m and 3m) measures and requires that the current bar's readouts for BOTH measures are either greater or lower than the preceding candle.
The script also requires that both measures are above or below 50 to signal a trend.
The script will plot the trend as arrows up or down, it will display a (-) when the these conditions are not met.
Requirements to signal a BUY (LIME GREEN) or SELL (BRIGHT RED):
**Ensure your chart candle colors are faded so you can see the signal.**
**Precision is set to 0; remember TV rounds up or down for the visual measure but uses the exact measure for the script**
During the first 12 minutes:
----------------------------------
There are no OB/OS conditions as informed in section 1.
ATR stop line must be present OR the current bar close is higher than the ATR stop of the preceding candle whether it is a long or short stop signal. Quick whips are accounted for.
The current bar close MUST be higher or lower than the preceding candle's HIGH or LOW.
The script MUST identify the RSI signalling as detailed above in section 3.
The candle will light LIME or BRIGHT RED when these conditions are met and will not deceive the statements I have made.
It is important to understand that the signal may become null if the conditions do not persist through the final close of the candle. This means that a snapshot of the indicator does not accurately represent
what it will display at different times during each countdown of EACH 3 minute candle. Sometimes it signals to go long and once RSI gets too high it no longer signals. This is a good thing. Limits FOMO entries.
@ 09:42 until 16:00
-----------------------------------
OB/OS yellow candles will now occur as detailed in section 1.
Candles MUST clear the HIGH or LOW of the TWO preceding candles.
Candles MUST be trending as defined in section 3.
Candles MUST conform the conditions of the ATR stop.
I want to thank;
@pinescripters
@freedom_trader_
and I will even thank the manual lol
I have manually back tested this because I am working on the proper coding to have TV do it for me.
My strategy requires me to cover 25% of my position at 0.5 of the TV ATR 4 length RMA indicator.
Once the first target is hit than the STOP is moved to break-even.
If the target is not hit than my maximum loss is also 0.5 of the TV ATR 4 length RMA indicator.
I tested 3 full days, always on the 3min chart.
I tested 96 trades. All occurring immediately upon signal.
85 were wins and 9 were losses, 88.5% profitable.
Please understand that my intend is to cover enough quickly to cover commission costs and limit losses.
The remaining 75% of my position are sold off in the following pattern unless P/A demands that I override the FIB tool. Let them run when you can.
Position ENTRY
25% cover @ 0.5 x ATR
25% of remaining position cover @ 1.75 x ATR
25% of remaining position cover @ 2.5 x ATR
25% of remaining position cover @ 3.5 x ATR (APX 40% of the initial position)
I will further back test in the near future with an expanded risk.

Double & Triple Bollinger Bands by Atilla YurtsevenThere are many traders use Bollinger Bands . The defaults are 20 SMA ( simple moving average ) with 2 deviation and you can use only single and customizable deviation. I have decided to release an advanced version of Bollinger Bands .
Most traders use Double Bollinger Bands strategy. However, it's not enough either. We sometimes need more than that. You can still use a single one by disabling the rest. Also what if you would like to use WMA instead of SMA? Now you can even choose your favorite moving average.
Please remember to subscribe to my channel and add some comments below. Hope you enjoy it.
FYI: This is not financial advice
Trade safe,
Atilla Yurtseven


RatTrend Multiple RSI Divergence MA Cross OscillatorThis Indicator based on RSI Divergence with Overbought and oversold signals.
All tops and bottoms calculated with Moving Average Crosses and combines with RSI signals.
Best working Timeframe is H4 on current settings, you can modify values to find best for you.
Current settings best for BTC trading.
At the beginning it can confuse you to understand but you will understand signal patterns.
Have fun.

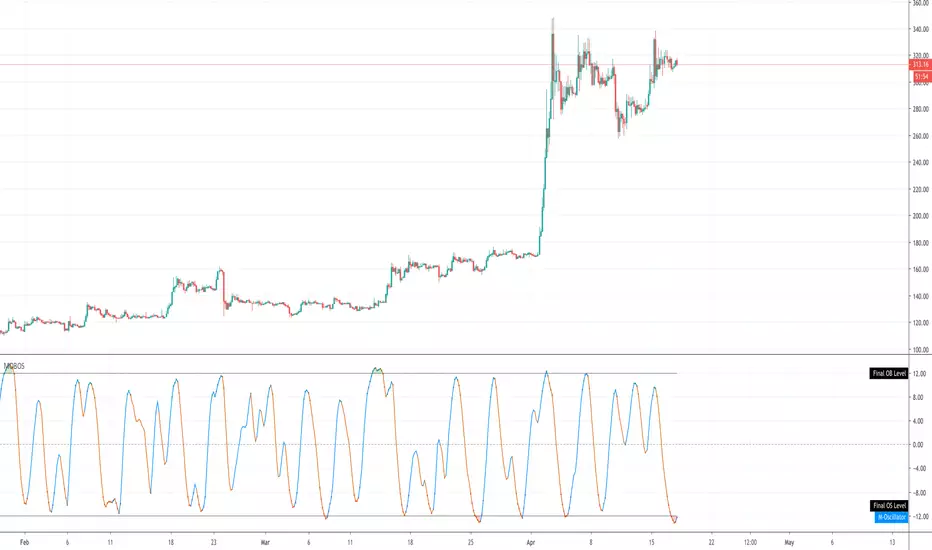
MOBOSThis indicator combines a bunch of overbought / oversold indicators to determine overbought / oversold levels. It is best used like a Stoch RSI and works on all instruments.

Momentum Oscillator Momentum Oscillator
Concept for this leading indicator presented in IFTA by By M.Fawzy.
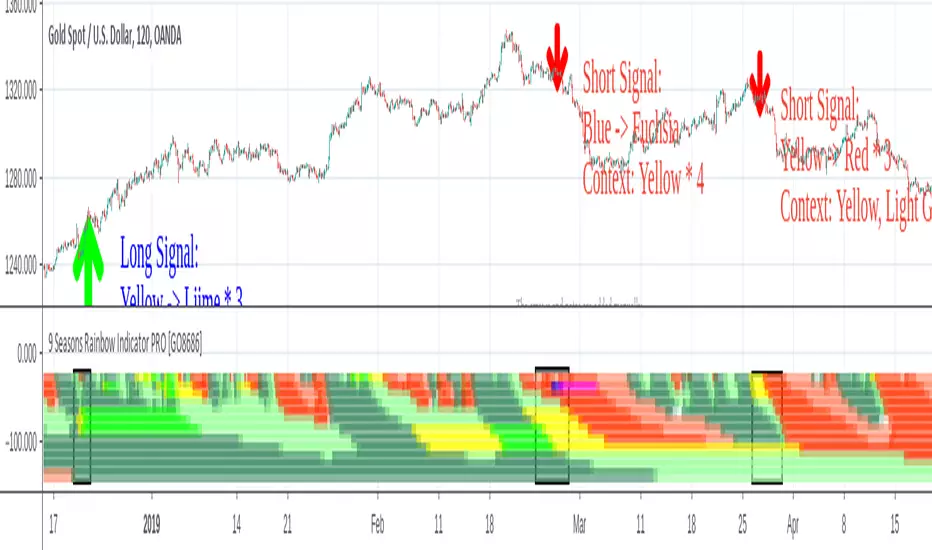
9 Seasons Rainbow Multiple Time Frames Pattern DEMO [9SRDEN]The indicator discovers profitable patterns by associating Price Season of multiple time frames.
Full Name: 9 Seasons Rainbow - Multiple Time Frames Associated Price Wave Pattern Indicator
This is redefined from “9 Seasons Rainbow Indicator DEMO”, with clearer definition of 9 Seasons and user manual.
Version: DEMO
Language: English
Copyright: 2019
---------- How to use the indicator ----------
Go through the manual and related ideas underneath or follow the tutorials list. Look through the profitable patterns and related cases, wait for or set alert for specific profitable pattern.
---------- Definition: 9 Seasons ----------
A life cycle of Price Wave is divided into 9 Seasons. Each time frame, from 5 minute to 1 month, has 9 seasons, Independent of each other:
Bull (Green)
Bull Pullback (Light Green): a pullback or retracement
Resistance / Overbought (Yellow): a resistance area, may become a Top, or be broken through.
Crazy Bought (Lime): Price is going up in a high volatility, could be a valid breakout, or a Bull Trap.
Neutral (White): a wandering season without direction, evolves into Bull or Bear
Bear (Red)
Bear Bounce (Light Red): Price bounces
Support / Oversold (Blue): a support area, may become a Bottom, or be broken through.
Crazy Sold (Fuchsia): Price is going down in a high volatility, could be a valid breakdown, or a Bear Trap.
---------- Some important evolution between seasons ----------
Resistance / Overbought (Yellow) -> Crazy Bought (Lime):
Bull is breaking through a resistance.
Crazy Bought (Lime) -> Resistance / Overbought (Yellow):
This normally indicates a failed breakout, Price goes back to the resistance.
Crazy Bought (Lime) -> Bull Pullback (Light Green):
This normally indicates Price has risen to a new level
Support / Oversold (Blue) -> Crazy Sold (Fuchsia):
Bear is breaking through a support.
Crazy Sold (Fuchsia) -> Support / Oversold (Blue):
This normally indicates a failed breakdown, Price recovers to the support.
Crazy Sold (Fuchsia) -> Bear Bounce (Light Red):
This normally indicates price has dropped to a new level
---------- Rainbow Ribbons for Multiple Time Frames ----------
Each ribbon of a rainbow represents a time frame.
The uppermost ribbon represents the shortest-term time frame - current time period of the chart, which is the time frame for trading.
The lowermost ribbon represent longest-term time frame, which work as environment, together with the other medium-term and long-term time frames.
The difference between two frames is 1.4142 fold (square root of 2), if level 1 is 15 minute, level 2 is 15 minute * (square root of 2) .
Examples of time frames in a rainbow:
For STANDARD in 15M: 15M - 21M - 30M - 42M - 60M(1H) - 85M - 120M(2H) - 170M
For PRO in 15M: 15M - 21M - 30M - 42M - 60M(1H) - 85M - 120M(2H) - 170M - 240M(4H) - 339M - 480M(8H) - 679M
---------- Trading Methods ----------
How to open a Long position?
When a profitable Long pattern appears, open small position first based on signal on shortest-term time frame; after retesting and confirming the support, open 2nd position; when it breaks through the resistance, pullbacks and confirms the breakout, open 3rd position.
How to exit a Long position?
Lift the Stop to a confirmed higher low, so that to take advantages of the bull run as possible.
How to open a Short position?
When a profitable Short pattern appears, open small position first based on signal on shortest-term time frame; after retesting and confirming the resistance, open 2nd position; when it breaks through the support, bounces and confirms the breakdown, add 3rd position.
How to exit a Short position?
Lower the Stop to a confirmed lower high, so that to take advantages of the bear run as possible.
---------- Versions Description ----------
The features may change later without advance notice.
PRO:
Invite-Only, with the following advanced features:
12 Ribbons Rainbow displays 9 Seasons of 12 time frames on a chart.
Advanced alert sets allows set alerts on short-term, medium-term, and long-term time frames.
Capability to input different trading instrument to compare with the current ticker.
Full time periods access allows apply it to broadest time periods, from 1 minute to 1 week (if history data is enough)
More new features in updates.
STANDARD:
Invite-Only, with the following advanced features:
8 Ribbons Rainbow displays 9 Seasons of 8 time frames on a chart.
Advanced alert sets allows set alerts on upper and lower frames.
Broad time periods access allows apply it to the most popular time periods, from 15 minute to 1 week (if history data is enough)
More new features in updates.
DEMO:
DEMO version is for trial purpose, having most of the features.
It is applicable to a list of trading instruments and specific time periods (1 hour to 1 day), which may change later without advance notice.
---------- Access to Indicators ----------
Please use DEMO version for Trial
Asking access to Invite-Only PRO and STANDARD versions:
9seasonsrainbowindicator.blogspot.com
Or contact the author.
---------- Install Invite Only: STANDARD & PRO Version----------
Ask access to STANDARD or PRO version
Open the chart -> Indicators (On the Top) -> Invite-Only Scripts (2nd button of the left bar)
Like/Favorite the indicator
Click to install on the chart
---------- About Loading Time ----------
It may take up to 2 minutes for your browser to load a new setting, depending on the your computer and network speed.
---------- List of the author's Indicators ----------
www.tradingview.com
---------- Disclaimer ----------
By using or requesting access to the indicator, you acknowledge that you have read and accepted that the indicator and any related content, including but not limited to: user manual, tutorials, ideas, videos, chats, emails, blog, are for the purpose of trading strategies studying and paper trading.
If a customer or user uses the indicator or related content mentioned above for live trading or investment, she/he should take all risks and be responsible for her/his own trading and investment activities.
---------- Updates ----------
The latest updates override the previous description.
To activate a update: Close the browser, Reopen the chart and apply the indicator.

Janus ƩRSI An overhaul to classical RSI
First version have 12 lag types to chose from, extreme conditions are highlighted with horizontal bands to be more intuitive.
Dynamics and signals vastly depend on filter used.
Main signals for current modes variate from self explanatory oscillators color change while moving out of extreme condition zone (overbought/oversold) to a brownish tint forming on impulse edges and representing S/R
Previous version hosted in tradingview bellow

9 Seasons Rainbow Indicator PRO [GO8686]Trading on 5 minutes frame can be as reasonable as on 4H frame, use 9 Seasons Rainbow Indicator PRO for both.
5分钟维度的交易可以与4小时维度一样合理,请使用9季彩虹指标 PRO 。
Market is full of life, with seasons.
9 Seasons Rainbow Indicator displays 9 seasons of any trading instrument in multiple time frames, helping traders and investors understand the flow of price.
The combination of seasons in different time dimensions may give perfect trading signals, for instance: overbought in both small time frame and big time frame has high success probability of shorting trade.
Please install the indicator: Demo, PRO or STANDARD Version. Apply the indicator to your favorites trading instruments: indices, stocks, futures , forex or crypto currencies. Find your patterns that make money.
---------- 9 Seasons ----------
Bull(Green), evolves into BullRest, OverBought, Bear, or Neutral
Bull Rest(Light Green): a pullback or retracement, evolves into Bull or Bear
OverBought(Yellow): may have defined a top or resistance, can happen in range, evolves into CrazyBought or Bear
CrazyBought(Lime): going up in a high volatility , evolves into Bear, OverBought, or BullRest
Neutral(White): a wandering season without direction, evolves into Bull or Bear
Bear(Red), evolves into BearRest, OverSold, Bull or Neutral
Bear Rest(Light Red): a bounce, evolves into Bear or Bull
OverSold(Blue): may have defined a bottom or support, can happen in range, evolves into CrazySold or Bull
CrazySold(Fuchsia): going down in a high volatility , evolves into Bull, OverSold, or BearRest
---------- Some important evolutions of seasons ----------
OverBought -> CrazyBought: can happen with a breakout
CrazyBought -> OverBought or Bear: could mean fading of a breakout
CrazyBought -> BullRest: can happen after rising over a new level
OverSold -> CrazySold: can happen with a breakdown
CrazySold -> OverSold or Bear: could mean fading of a breakdown
CrazySold -> BearRest: can happen after dropping to a new level
---------- Rainbow Ribbons for multiple time frames ----------
Each ribbon of the rainbow represents a time frame,
The difference between two frames is 1.4142 fold (square root of 2), if level 1 is 15 M, level 2 is 15 * (square root of 2) M. level 3 is 15*2 M, level 4 is 30 * (square root of 2) M, level 5 is 30 * 2 m etc.
The uppermost ribbon represents the smallest time frame - current time period of the chart.
The lower ribbons represent bigger time frames, which work as context.
Examples for time frame rainbow:
For DEMO in 30M: 30M - 42M - 60M(1H) - 85M - 120M(2H) - 170M - 240M(4H) - 339M
For STANDARD in 15M: 15M - 21M - 30M - 42M - 60M(1H) - 85M - 120M(2H) - 170M
For PRO in 15M: 15M - 21M - 30M - 42M - 60M(1H) - 85M - 120M(2H) - 170M - 240M(4H) - 339M - 480M(8H) - 679M
---------- Versions Description ----------
The features may change later, please refer to latest update.
PRO:
PRO version of 9 Seasons Rainbow Indicator is invite-only, with the following advanced features:
12 Ribbon Rainbow lets you discover trading opportunities hidden in the 1.4142 fold time dimension while monitoring market conditions spanning 45 times.
Advanced alert sets allows you set alerts for Overbought, Crazybought, OverSold, CrazySold on low, medium, and high time frames.
Option to input different trading instrument to compare with the current ticker.
Full time periods access allows you to watch the market on broadest time dimensions.
More new features in updates.
STANDARD:
This is STANDARD version of 9 Seasons Rainbow Indicator, invite-only, with the following advanced features:
8 Ribbon Rainbow lets you discover trading opportunities hidden in the 1.4142 fold time dimension while monitoring market conditions spanning 11 times.
Advanced alert sets allows you set alerts for Overbought, Crazybought, OverSold, CrazySold on upper and lower time frames.
Broad time periods access allows you to watch the market on popular time dimensions from 15M - 1D,2D,3D,4D,5D,6D,1W.
More new features in updates.
DEMO:
A DEMO of Standard version for trial purpose, having most the functions except alert preset conditions.
It is applicable to a list of trading instruments and specific time periods(30m-1D), which may change later. please refer to latest updates.
---List of tickers applicable for Demo version.
Currency Index:AXY, BXY , CXY , DXY , EXY , JXY , SXY , ZXY ,
Stock Index:SPX,TSX, DAX , NI225 ,KOSPI,399001, SHCOMP , HSI , XJO , TAIEX , SX5E ,
Crypto:BTCUSD
Commodity:BCOUSD, GOLD
---------- Access to Indicators ----------
Please use DEMO version to taste the indicator.
Please contact the author for access to PRO or Standard versions.
---------- About Loading Time ----------
It may take up to 2 minutes for your browser to load a new setting, depending on the your computer and network speed.
---------- List of the author's Indicators ----------
tradingview.com/u/go8686/#published-scripts
---------- Disclaim ----------
By using or requesting access to this indicator, you acknowledge that you have read and accepted that this indicator is for study purposes only and it does NOT guarantee you will make money.
I am not financial adviser and I am NOT responsible for any profits or losses you may incur by using this indicator!
Users should make their own decisions, carefully assess risks and be responsible for investment and trading activities.
The latest updates override the previous description. Please check the updates.
9季彩虹指标 PRO
市场充满生机。
9季彩虹指标在多个时间维度上显示任何交易品种的9个季节交替,帮助交易者和投资者了解价格流动。
不同时间维度的季节组合可以给出完美的交易信号,例如:在小时间框架和大时间框架上同时出现超买具有很高的卖空交易成功概率。
请安装指标:DEMO,STANDARD 或者 PRO 版本. 应用指标到您的交易品种:证券,期货,外汇或者加密货币。找到属于您的盈利模式。
---------- 季节的定义 ----------
牛(绿色),可以演变到牛市回调,超买,熊 或者 中性
牛市回调(淡绿色):可以演变到牛或者熊
超买(黄色),可能刚刚定义了一个头部或者阻力区,可以发生在盘整期,可以演变到狂买或者熊
狂买(亮绿色):高波动性上涨,可以演变到熊,超买或者牛市回调
中性(白色): 没有方向的徘徊期,可以演变到牛或者熊
熊(红色),可以演变到熊市反弹,超卖,牛 或者 中性
熊市反弹(淡红色),可以演变到熊或者牛
超卖(蓝色),可能刚刚定义了一个底部或者支撑,可以发生在盘整期,可以演变到狂卖或者牛
狂卖(紫红色),高波动性下跌,可以演变到牛,超卖 或者熊市反弹
一些重要的季节交替
超买 -> 狂买:可能发生在向上突破时
狂买 -> 熊 或者 超买:可能发生在突破失败时
狂买 -> 牛市回调: 可能发生在上平台后
超卖 -> 狂卖:可能发生在向下突破时
狂卖 -> 牛 或者 超卖:可能发生在突破失败时
狂卖 -> 熊市回调: 可能发生在下平台后
---------- 色带彩虹所代表的时间维度 ----------
每条色带代表一个时间维度。
色带间隔1.4142倍(2的开方),如果第一维度是15分钟,第二维度是15*1.4142=21分钟,第三维度是15*2=30分钟,以此类推。
最上面的色带代表最小的时间维度,也就是目前图表的时间维度
最下面的色带代表最大的时间维度。
例子:
演示版: 30m-42m-60m(1H)-85m-120m(2H)-170m-240m(4H)-339m
标准版: 15m-21m-30m-42m-60m(1H)-85m-120m(2H)-170m
专业版: 15m-21m-30m-42m-60m(1H)-85m-120m(2H)-170m-240m(4H)-339m-480m(8H)-679m
---------- 不同版本功能描述 ----------
这些特征及功能可能会发生变化,以更新为准。
---专业版PRO高级特征
12色带彩虹让您发现隐藏在1.4142时间维度的交易机会,同时监控时间跨度达四十五倍的市场状态
高级警报功能:允许您在低,中,高时间帧上设置超买,狂买,超卖,狂卖的警报。
可以输入不同的交易品种用于指标,便于与当前交易品种进行比较。
全时间维度(分钟到日线级别)给您全视角观察市场
更新中的更多新功能。
---标准版STANDARD特征
8色带彩虹让您发现隐藏在1.4142时间维度的交易机会,同时监控时间跨度达十一倍的市场状态
高级警报功能:允许您在低,高时间层级上设置超买,狂买,超卖,狂卖的警报。
宽时间维度(15分钟到日线级别)让您从更宽阔的视角观察市场
更新中的更多新功能。
--演示版DEMO
演示版用于标准版的演示和试用,适用于特定的资产列表和时间维度(30M-1D),后续可能调整.
适用的品种列表
AXY , BXY , CXY , DXY , EXY , JXY , SXY , ZXY ,
SPX ,TSX, DAX , NI225 ,KOSPI,399001, SHCOMP , HSI , XJO , TAIEX , SX5E ,
BTCUSD , BCOUSD , GOLD
---------- 获得使用权 ----------
请使用演示版以初步了解指标的运行机理。
联系指标开发者以取得标准版和专业版的使用权
---------- 开发者的指标列表 ----------
tradingview.com/u/go8686/#published-scripts
---------- 加载时间 ----------
可能需要2分钟,取决于网络和电脑配置。
---------- 免责声明 ----------
在要求获得本指标使用权之前以及在使用本指标之前,用户认可已经完全了解和接受:本指标仅供研究目的, 它不提供任何赢利的可能性。
本指标的开发者并非专业投资顾问,因此不对用户的任何赢亏负责。
用户应独立判断,审慎评估并自负投资和交易风险!
最近的更新会覆盖之前的说明。 请参阅更新来查看指标的新特征和功能。
9 Seasons Rainbow Indicator STANDARD [GO8686]Market is full of life, with seasons.
9 Seasons Rainbow Indicator displays 9 seasons of any trading instrument in multiple time frames, helping traders and investors understand the flow of price.
The combination of seasons in different time dimensions may give perfect trading signals, for instance: overbought in both small time frame and big time frame has high success probability of shorting trade.
Please install the indicator: Demo, PRO or STANDARD Version. Apply the indicator to your favorites trading instruments: indices, stocks, futures , forex or crypto currencies. Find your patterns that make money.
---------- 9 Seasons ----------
Bull(Green), evolves into BullRest, OverBought, Bear, or Neutral
Bull Rest(Light Green): a pullback or retracement, evolves into Bull or Bear
OverBought(Yellow): may have defined a top or resistance, can happen in range, evolves into CrazyBought or Bear
CrazyBought(Lime): going up in a high volatility , evolves into Bear, OverBought, or BullRest
Neutral(White): a wandering season without direction, evolves into Bull or Bear
Bear(Red), evolves into BearRest, OverSold, Bull or Neutral
Bear Rest(Light Red): a bounce, evolves into Bear or Bull
OverSold(Blue): may have defined a bottom or support, can happen in range, evolves into CrazySold or Bull
CrazySold(Fuchsia): going down in a high volatility , evolves into Bull, OverSold, or BearRest
---------- Some important evolutions of seasons ----------
OverBought -> CrazyBought: can happen with a breakout
CrazyBought -> OverBought or Bear: could mean fading of a breakout
CrazyBought -> BullRest: can happen after rising over a new level
OverSold -> CrazySold: can happen with a breakdown
CrazySold -> OverSold or Bear: could mean fading of a breakdown
CrazySold -> BearRest: can happen after dropping to a new level
---------- Rainbow Ribbons for multiple time frames ----------
Each ribbon of the rainbow represents a time frame,
The difference between two frames is 1.4142 fold (square root of 2), if level 1 is 15 M, level 2 is 15 * (square root of 2) M. level 3 is 15*2 M, level 4 is 30 * (square root of 2) M, level 5 is 30 * 2 m etc.
The uppermost ribbon represents the smallest time frame - current time period of the chart.
The lower ribbons represent bigger time frames, which work as context.
Examples for time frame rainbow:
For DEMO in 30M: 30M - 42M - 60M(1H) - 85M - 120M(2H) - 170M - 240M(4H) - 339M
For STANDARD in 15M: 15M - 21M - 30M - 42M - 60M(1H) - 85M - 120M(2H) - 170M
For PRO in 15M: 15M - 21M - 30M - 42M - 60M(1H) - 85M - 120M(2H) - 170M - 240M(4H) - 339M - 480M(8H) - 679M
---------- Versions Description ----------
The features may change later, please refer to latest update.
STANDARD:
This is STANDARD version of 9 Seasons Rainbow Indicator, invite-only, with the following advanced features:
8 Ribbon Rainbow lets you discover trading opportunities hidden in the 1.4142 fold time dimension while monitoring market conditions spanning 11 times.
Advanced alert sets allows you set alerts for Overbought, Crazybought, OverSold, CrazySold on upper and lower time frames.
Broad time periods access allows you to watch the market on popular time dimensions from 15M - 1D,2D,3D,4D,5D,6D,1W.
More new features in updates.
PRO:
PRO version of 9 Seasons Rainbow Indicator is invite-only, with the following advanced features:
12 Ribbon Rainbow lets you discover trading opportunities hidden in the 1.4142 fold time dimension while monitoring market conditions spanning 45 times.
Advanced alert sets allows you set alerts for Overbought, Crazybought, OverSold, CrazySold on low, medium, and high time frames.
Option to input different trading instrument to compare with the current ticker.
Full time periods access allows you to watch the market on broadest time dimensions.
More new features in updates.
DEMO:
A DEMO of Standard version for trial purpose, having most the functions except alert preset conditions.
It is applicable to a list of trading instruments and specific time periods(30m-1D), which may change later. please refer to latest updates.
---List of tickers applicable for Demo version.
Currency Index:AXY, BXY , CXY , DXY , EXY , JXY , SXY , ZXY ,
Stock Index:SPX,TSX, DAX , NI225 ,KOSPI,399001, SHCOMP , HSI , XJO , TAIEX , SX5E ,
Crypto:BTCUSD
Commodity:BCOUSD, GOLD
---------- Access to Indicators ----------
Please contact the author for access to PRO or Standard versions.
---------- About Loading Time ----------
It may take up to 2 minutes for your browser to load a new setting, depending on the your computer and network speed.
---------- List of the author's Indicators ----------
tradingview.com/u/go8686/#published-scripts
---------- Disclaim ----------
By using or requesting access to this indicator, you acknowledge that you have read and accepted that this indicator is for study purposes only and it does NOT guarantee you will make money.
I am not financial adviser and I am NOT responsible for any profits or losses you may incur by using this indicator!
Users should make their own decisions, carefully assess risks and be responsible for investment and trading activities.
The latest updates override the previous description. Please check the updates.
9季彩虹指标 标准版 STANDARD
市场充满生机。
9季彩虹指标在多个时间维度上显示任何交易品种的9个季节交替,帮助交易者和投资者了解价格流动。
不同时间维度的季节组合可以给出完美的交易信号,例如:在小时间框架和大时间框架上同时出现超买具有很高的卖空交易成功概率。
请安装指标:DEMO,STANDARD 或者 PRO 版本. 应用指标到您的交易品种:证券,期货,外汇或者加密货币。找到属于您的盈利模式。
---------- 季节的定义 ----------
牛(绿色),可以演变到牛市回调,超买,熊 或者 中性
牛市回调(淡绿色):可以演变到牛或者熊
超买(黄色),可能刚刚定义了一个头部或者阻力区,可以发生在盘整期,可以演变到狂买或者熊
狂买(亮绿色):高波动性上涨,可以演变到熊,超买或者牛市回调
中性(白色): 没有方向的徘徊期,可以演变到牛或者熊
熊(红色),可以演变到熊市反弹,超卖,牛 或者 中性
熊市反弹(淡红色),可以演变到熊或者牛
超卖(蓝色),可能刚刚定义了一个底部或者支撑,可以发生在盘整期,可以演变到狂卖或者牛
狂卖(紫红色),高波动性下跌,可以演变到牛,超卖 或者熊市反弹
一些重要的季节交替
超买 -> 狂买:可能发生在向上突破时
狂买 -> 熊 或者 超买:可能发生在突破失败时
狂买 -> 牛市回调: 可能发生在上平台后
超卖 -> 狂卖:可能发生在向下突破时
狂卖 -> 牛 或者 超卖:可能发生在突破失败时
狂卖 -> 熊市回调: 可能发生在下平台后
---------- 色带彩虹所代表的时间维度 ----------
每条色带代表一个时间维度。
色带间隔1.4142倍(2的开方),如果第一维度是15分钟,第二维度是15*1.4142=21分钟,第三维度是15*2=30分钟,以此类推。
最上面的色带代表最小的时间维度,也就是目前图表的时间维度
最下面的色带代表最大的时间维度。
例子:
演示版: 30m-42m-60m(1H)-85m-120m(2H)-170m-240m(4H)-339m
标准版: 15m-21m-30m-42m-60m(1H)-85m-120m(2H)-170m
专业版: 15m-21m-30m-42m-60m(1H)-85m-120m(2H)-170m-240m(4H)-339m-480m(8H)-679m
---------- 不同版本功能描述 ----------
这些特征及功能可能会发生变化,以更新为准。
---标准版STANDARD特征
8色带彩虹让您发现隐藏在1.4142时间维度的交易机会,同时监控时间跨度达十一倍的市场状态
高级警报功能:允许您在低,高时间层级上设置超买,狂买,超卖,狂卖的警报。
宽时间维度(15分钟到日线级别)让您从更宽阔的视角观察市场
更新中的更多新功能。
---专业版PRO高级特征
12色带彩虹让您发现隐藏在1.4142时间维度的交易机会,同时监控时间跨度达四十五倍的市场状态
高级警报功能:允许您在低,中,高时间帧上设置超买,狂买,超卖,狂卖的警报。
可以输入不同的交易品种用于指标,便于与当前交易品种进行比较。
全时间维度(分钟到日线级别)给您全视角观察市场
更新中的更多新功能。
--演示版DEMO
演示版用于标准版的演示和试用,适用于特定的资产列表和时间维度(30M-1D),后续可能调整.
适用的品种列表
AXY , BXY , CXY , DXY , EXY , JXY , SXY , ZXY ,
SPX ,TSX, DAX , NI225 ,KOSPI,399001, SHCOMP , HSI , XJO , TAIEX , SX5E ,
BTCUSD , BCOUSD , GOLD
---------- 获得使用权 ----------
联系指标开发者以取得标准版和专业版的使用权
---------- 开发者的指标列表 ----------
tradingview.com/u/go8686/#published-scripts
---------- 加载时间 ----------
可能需要2分钟,取决于网络和电脑配置。
---------- 免责声明 ----------
在要求获得本指标使用权之前以及在使用本指标之前,用户认可已经完全了解和接受:本指标仅供研究目的, 它不提供任何赢利的可能性。
本指标的开发者并非专业投资顾问,因此不对用户的任何赢亏负责。
用户应独立判断,审慎评估并自负投资和交易风险!
最近的更新会覆盖之前的说明。 请参阅更新来查看指标的新特征和功能。
9 Seasons Rainbow Indicator DEMO [GO8686]Having good pattern recognition? Use this indicator to test and practice it.
Market is full of life, with seasons.
9 Seasons Rainbow Indicator displays 9 seasons of any trading instrument in multiple time frames, helping traders and investors understand the flow of price.
The combination of seasons in different time dimensions may give perfect trading signals, for instance: overbought in both small time frame and big time frame has high success probability of shorting trade.
Please install the indicator: Demo, PRO or STANDARD Version. Apply the indicator to your favorites trading instruments: indices, stocks, futures, forex or crypto currencies. Find your patterns that make money.
---------- 9 Seasons ----------
Bull(Green), evolves into BullRest, OverBought, Bear, or Neutral
Bull Rest(Light Green): a pullback or retracement, evolves into Bull or Bear
OverBought(Yellow): may have defined a top or resistance, can happen in range, evolves into CrazyBought or Bear
CrazyBought(Lime): going up in a high volatility, evolves into Bear, OverBought, or BullRest
Neutral(White): a wandering season without direction, evolves into Bull or Bear
Bear(Red), evolves into BearRest, OverSold, Bull or Neutral
Bear Rest(Light Red): a bounce, evolves into Bear or Bull
OverSold(Blue): may have defined a bottom or support, can happen in range, evolves into CrazySold or Bull
CrazySold(Fuchsia): going down in a high volatility, evolves into Bull, OverSold, or BearRest
---------- Some important evolutions of seasons ----------
OverBought -> CrazyBought: can happen with a breakout
CrazyBought -> OverBought or Bear: could mean fading of a breakout
CrazyBought -> BullRest: can happen after rising over a new level
OverSold -> CrazySold: can happen with a breakdown
CrazySold -> OverSold or Bear: could mean fading of a breakdown
CrazySold -> BearRest: can happen after dropping to a new level
---------- Rainbow Ribbons for multiple time frames ----------
Each ribbon of the rainbow represents a time frame,
The difference between two frames is 1.4142 fold (square root of 2), if level 1 is 15 M, level 2 is 15 * (square root of 2) M. level 3 is 15*2 M, level 4 is 30 * (square root of 2) M, level 5 is 30 * 2 m etc.
The uppermost ribbon represents the smallest time frame - current time period of the chart.
The lower ribbons represent bigger time frames, which work as context.
Examples for time frame rainbow:
For DEMO in 30M: 30M - 42M - 60M(1H) - 85M - 120M(2H) - 170M - 240M(4H) - 339M
For STANDARD in 15M: 15M - 21M - 30M - 42M - 60M(1H) - 85M - 120M(2H) - 170M
For PRO in 15M: 15M - 21M - 30M - 42M - 60M(1H) - 85M - 120M(2H) - 170M - 240M(4H) - 339M - 480M(8H) - 679M
---------- Versions Description ----------
The features may change later, please refer to latest update.
DEMO:
This is DEMO of Standard version for trial purpose, having most the functions except alert preset conditions.
It is applicable to a list of trading instruments and specific time periods(30m-1D), which may change later. please refer to latest updates.
---List of tickers applicable for Demo version.
Currency Index:AXY,BXY,CXY,DXY,EXY,JXY,SXY,ZXY,
Stock Index:SPX,TSX,DAX,NI225,KOSPI,399001,SHCOMP,HSI,XJO,TAIEX,SX5E,
Crypto:BTCUSD
Commodity:BCOUSD,GOLD
STANDARD:
STANDARD version of 9 Seasons Rainbow Indicator is invite-only, with the following advanced features:
8 Ribbon Rainbow lets you discover trading opportunities hidden in the 1.4142 fold time dimension while monitoring market conditions spanning 11 times.
Advanced alert sets allows you set alerts for Overbought, Crazybought, OverSold, CrazySold on upper and lower time frames.
Broad time periods access allows you to watch the market on popular time dimensions from 15M - 1D,2D,3D,4D,5D,6D,1W.
More new features in updates.
PRO:
PRO version of 9 Seasons Rainbow Indicator is invite-only, with the following advanced features:
12 Ribbon Rainbow lets you discover trading opportunities hidden in the 1.4142 fold time dimension while monitoring market conditions spanning 45 times.
Advanced alert sets allows you set alerts for Overbought, Crazybought, OverSold, CrazySold on low, medium, and high time frames.
Option to input different trading instrument to compare with the current ticker.
Full time periods access allows you to watch the market on broadest time dimensions.
More new features in updates.
---------- Access to Indicators ----------
Please contact the author for access to PRO or Standard versions.
---------- About Loading Time ----------
It may take up to 2 minutes for your browser to load a new setting, depending on the your computer and network speed.
---------- List of the author's Indicators ----------
www.tradingview.com
---------- Disclaim ----------
By using or requesting access to this indicator, you acknowledge that you have read and accepted that this indicator is for study purposes only and it does NOT guarantee you will make money.
I am not financial adviser and I am NOT responsible for any profits or losses you may incur by using this indicator!
Users should make their own decisions, carefully assess risks and be responsible for investment and trading activities.
The latest updates override the previous description. Please check the updates.
9季彩虹指标 演示版
具备优秀的模式识别能力吗? 9季彩虹指标检验,提升您的模式识别能力。
市场充满生机。
9季彩虹指标在多个时间维度上显示任何交易品种的9个季节交替,帮助交易者和投资者了解价格流动。
不同时间维度的季节组合可以给出完美的交易信号,例如:在小时间框架和大时间框架上同时出现超买具有很高的卖空交易成功概率。
请安装指标:Demo,STANDARD 或者 PRO 版本. 应用指标到您的交易品种:证券,期货,外汇或者加密货币。找到属于您的盈利模式。
---------- 季节的定义 ----------
牛(绿色),可以演变到牛市回调,超买,熊 或者 中性
牛市回调(淡绿色):可以演变到牛或者熊
超买(黄色),可能刚刚定义了一个头部或者阻力区,可以发生在盘整期,可以演变到狂买或者熊
狂买(亮绿色):高波动性上涨,可以演变到熊,超买或者牛市回调
中性(白色): 没有方向的徘徊期,可以演变到牛或者熊
熊(红色),可以演变到熊市反弹,超卖,牛 或者 中性
熊市反弹(淡红色),可以演变到熊或者牛
超卖(蓝色),可能刚刚定义了一个底部或者支撑,可以发生在盘整期,可以演变到狂卖或者牛
狂卖(紫红色),高波动性下跌,可以演变到牛,超卖 或者熊市反弹
一些重要的季节交替
超买 -> 狂买:可能发生在向上突破时
狂买 -> 熊 或者 超买:可能发生在突破失败时
狂买 -> 牛市回调: 可能发生在上平台后
超卖 -> 狂卖:可能发生在向下突破时
狂卖 -> 牛 或者 超卖:可能发生在突破失败时
狂卖 -> 熊市回调: 可能发生在下平台后
---------- 色带彩虹所代表的时间维度 ----------
每条色带代表一个时间维度。
色带间隔1.4142倍(2的开方),如果第一维度是15分钟,第二维度是15*1.4142=21分钟,第三维度是15*2=30分钟,以此类推。
最上面的色带代表最小的时间维度,也就是目前图表的时间维度
最下面的色带代表最大的时间维度。
例子:
演示版: 30m-42m-60m(1H)-85m-120m(2H)-170m-240m(4H)-339m
标准版: 15m-21m-30m-42m-60m(1H)-85m-120m(2H)-170m
专业版: 15m-21m-30m-42m-60m(1H)-85m-120m(2H)-170m-240m(4H)-339m-480m(8H)-679m
---------- 不同版本功能描述 ----------
这些特征及功能可能会发生变化,以更新为准。
--演示版DEMO
演示版用于标准版的演示和试用,适用于特定的资产列表和时间维度(30M-1D),后续可能调整.
适用的品种列表
AXY,BXY,CXY,DXY,EXY,JXY,SXY,ZXY,
SPX,TSX,DAX,NI225,KOSPI,399001,SHCOMP,HSI,XJO,TAIEX,SX5E,
BTCUSD,BCOUSD,GOLD
---标准版STANDARD特征
8色带彩虹让您发现隐藏在1.4142时间维度的交易机会,同时监控时间跨度达十一倍的市场状态
高级警报功能:允许您在低,高时间层级上设置超买,狂买,超卖,狂卖的警报。
宽时间维度(15分钟到日线级别)让您从更宽阔的视角观察市场
更新中的更多新功能。
---专业版PRO高级特征
12色带彩虹让您发现隐藏在1.4142时间维度的交易机会,同时监控时间跨度达四十五倍的市场状态
高级警报功能:允许您在低,中,高时间帧上设置超买,狂买,超卖,狂卖的警报。
可以输入不同的交易品种用于指标,便于与当前交易品种进行比较。
全时间维度(分钟到日线级别)给您全视角观察市场
更新中的更多新功能。
---------- 获得使用权 ----------
联系指标开发者以取得标准版和专业版的使用权
---------- 开发者的指标列表 ----------
www.tradingview.com
---------- 加载时间 ----------
可能需要2分钟,取决于网络和电脑配置。
---------- 免责声明 ----------
在要求获得本指标使用权之前以及在使用本指标之前,用户认可已经完全了解和接受:本指标仅供教育和研究目的, 它不提供任何赢利的可能性。
本指标的开发者并非专业投资顾问,因此不对用户的任何赢亏负责。
用户应独立判断,审慎评估并自负投资和交易风险!
最近的更新会覆盖之前的说明。 请参阅更新来查看指标的新特征和功能。
