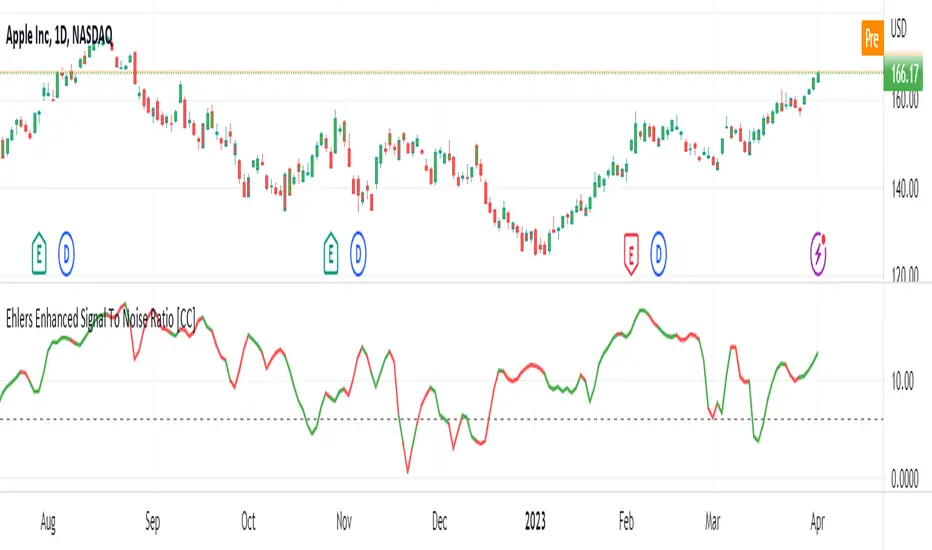
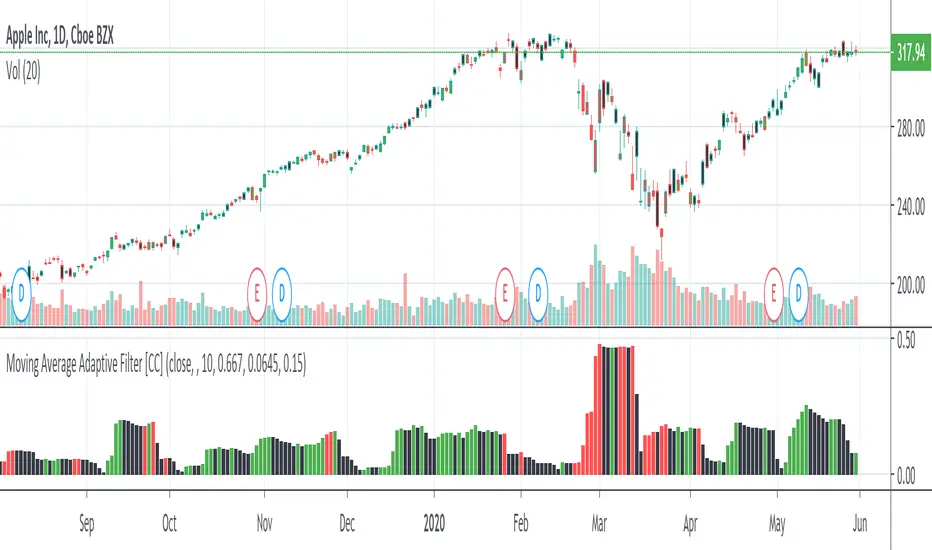
Candlestick Pattern IdentifierMy script builds upon another user-submitted script by rebuilding the logic used to identify candlestick patterns. The logic in my script is a mix of strict and lax guidelines to mitigate false flags and present valid buy and sell signals.
-To use this indicator, simply add it to any chart. It will identify trends on any time frame although the lower you go, the more signals you'll see and the higher probability of those signals being false flags. You can also disable any candlestick patterns that you feel are not as useful.
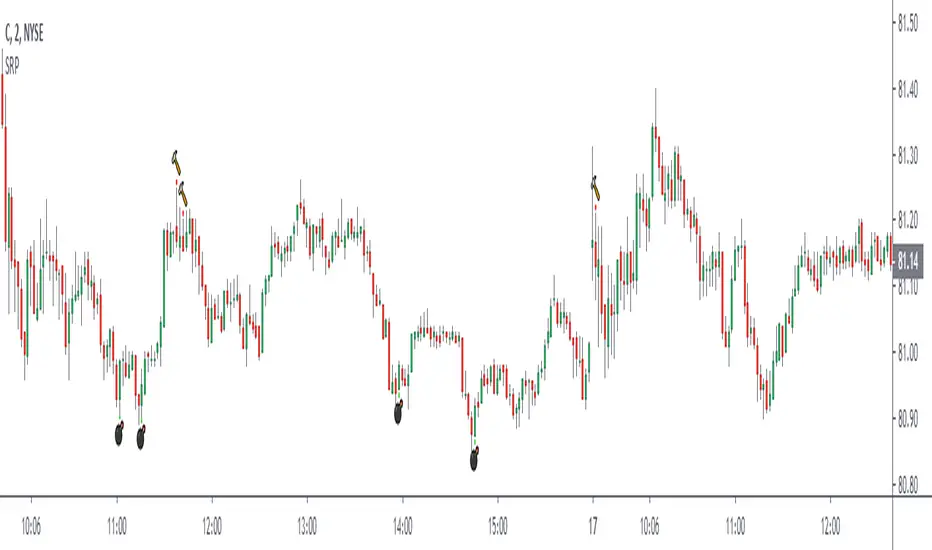
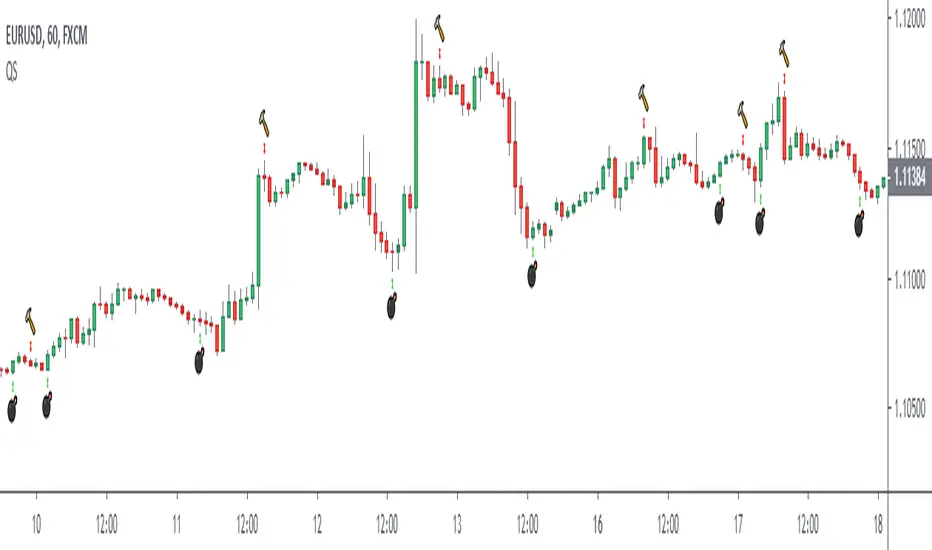
- This indicator works best with Stocks and also with Forex markets to a lesser extent.
- This indicator works the best on the Daily chart and also works (with varying degrees of success) on any timeframe at or above 1 hour. I've found that this indicator works the best when used in tandem with the Daily and Hourly charts with the Hourly chart being used to determine an entry point while the Daily chart is used for long term trend analysis.
Penunjuk Pine Script®